JUST Report
JUST Capital’s Quarterly Review of Stakeholder Performance – Q1 2023
- More Reports
- View all JUST Reports
This report was written by Mona Patni, Director of Quantitative Research & Analytics.
After a year of volatility and uncertainty, U.S. stocks gained during the first quarter of 2023 in a surprise show of resilience despite a banking crisis, cryptocurrency meltdowns, and plenty of uncertainty around interest rates. The Russell 1000 index concluded a turbulent first quarter of 2023 to rise around 7%, while the tech-heavy Nasdaq Composite proved to be the real standout, soaring nearly 17%. With respect to sector performance, seven of the 11 large-cap sectors were higher, led by Technology and Communications while stocks in the energy and healthcare sectors lagged the most over the quarter.
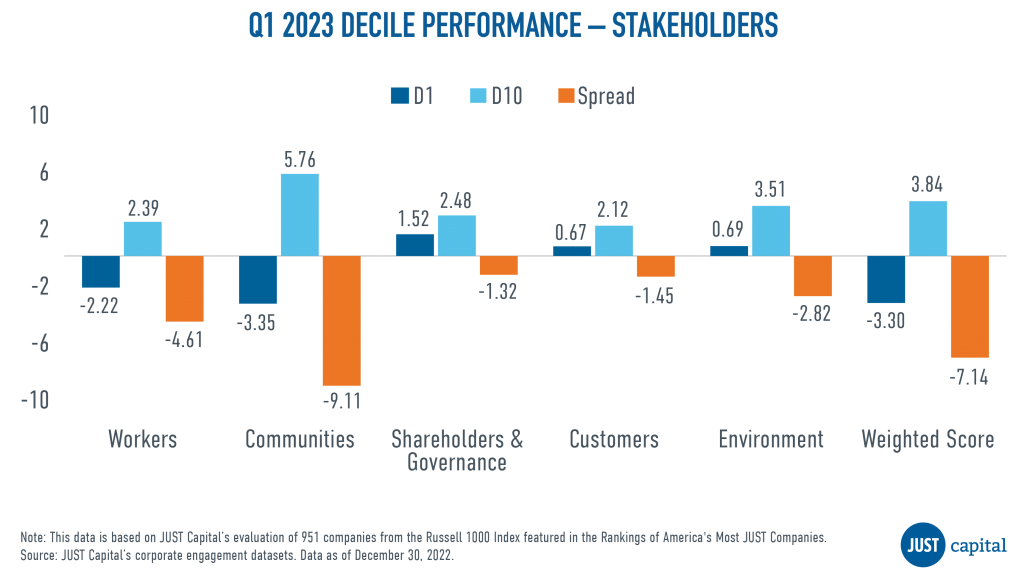
Although the JUST Overall Weighted Score has outperformed the Russell 1000 by 50.67% from Jan 2018 to March 2023, JUST Capital found that all five stakeholders we track delivered negative performance in Q1 2023, primarily driven by negative contribution from the Financials sector. The Shareholders and Governance stakeholder delivered the best performance over this period with a long-short spread of -1.32%, while Communities stakeholder fared the worst at -9.11%. Within the Workers and Communities stakeholders, underperformance was driven by both deciles, with the top decile underperforming and bottom decile outperforming. For the remaining stakeholders, underperformance was driven by the bottom decile.
JUST Capital’s Overall Weighted Score takes into account the 20 core Issues determined through our survey research – including paying a living wage, creating a diverse, inclusive workplace, and helping combat climate change – across key business stakeholders: Workers, Communities, Shareholders and Governance, Customers, and Environment. This Overall Weighted Score had a negative long-short spread of -7.14% over the period ending March 31, 2023.
Negative contribution in the top decile of the Overall Weighted Score was driven primarily by both allocation and selection within the Financials sector. Overweight in Financials was driven by banks outperforming other industries on the Local Job Creation, Resource Efficiency, and Living Wage Issues, which together make up more than 33% of our model.
Owning stocks like First Republic Bank (-88.9%) and Comerica (-33.98%) didn’t help the performance of the top decile of the Overall Weighted Score. Following the failures of Silicon Valley Bank and Signature Bank, which led to broader concerns about industry liquidity, regional banks’ (especially First Republic Bank’s) stock price came under pressure due to exposure to venture capital and a large amount of uninsured deposits, similar to the failed banks. On the other hand, the bottom decile, which consists of low performers, counter-intuitively outperformed the Russell 1000. Negative contributions largely came from Industrials and Technology names. Bottom decile companies like Vontier (Industrials) and Universal Display Corp (Technology) rallied during this quarter.
Workers Performance
The Workers stakeholder measures a company across five Issues:
- Living Wage
- Health & Safety
- Benefits & Work-Life Balance
- Diversity, Equity, and Inclusion
- Workforce Advancement
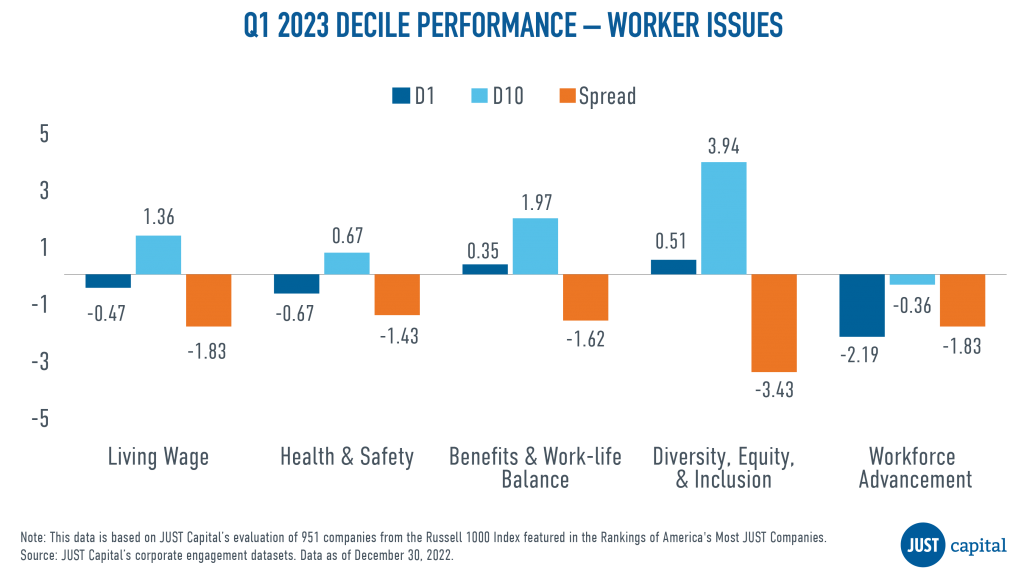
In Q1 2023, we saw all the Worker Issues underperform. Underperformance in Living Wage and Health & Safety was driven by negative performance from both top and bottom decile companies.
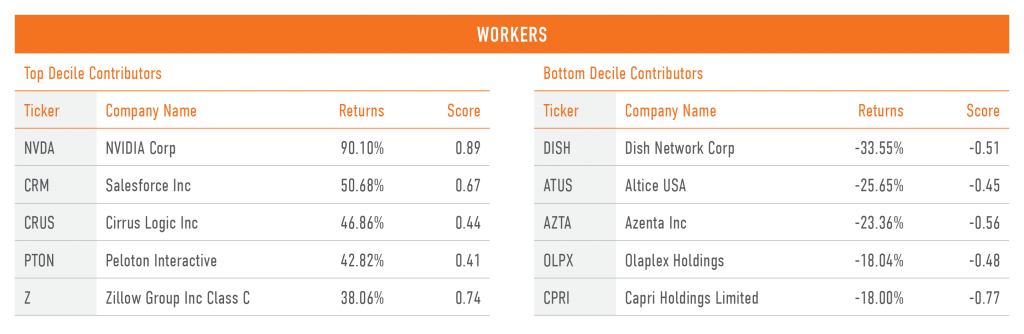
Shown below are the top and bottom five contributors to the top decile (D1), the top-ranked companies as measured by their Workers score, and the bottom decile (D10), the lowest-ranked companies as measured by their Worker score.
Communities Performance
The Communities stakeholder measures a company across four Issues:
- Local Job Creation
- Human Rights
- Community Development
- Community Support
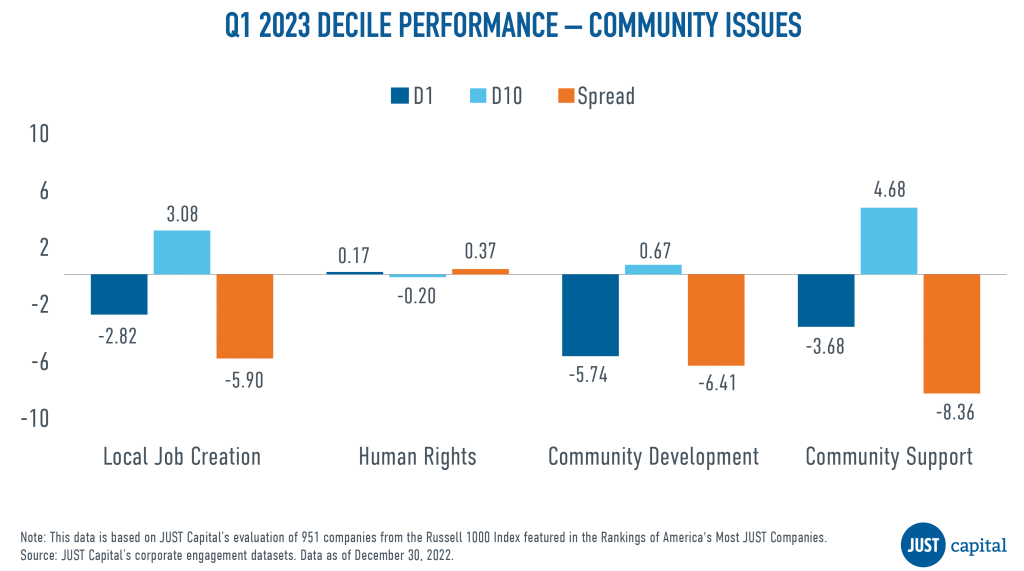
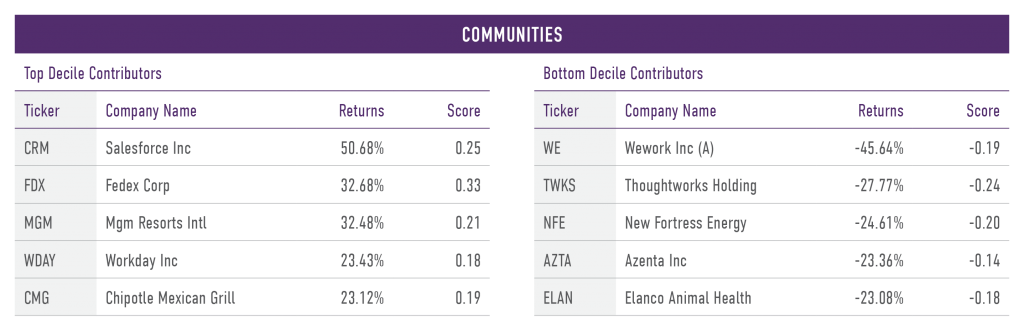
Community Support was the weakest performer followed by Community Development and Local Job Creation, with negative contribution coming from both top and bottom decile companies.
Shown below are the both top and bottom five contributors to the top decile (D1), the best-ranked companies as measured by their Communities score, and the bottom decile (D10), the lowest-ranked companies as measured by their Communities score.
Shareholders and Governance Performance
The Shareholders and Governance stakeholder measures a company across three Issues:
- Accountability to Stakeholders
- Ethical Leadership
- Investor Return
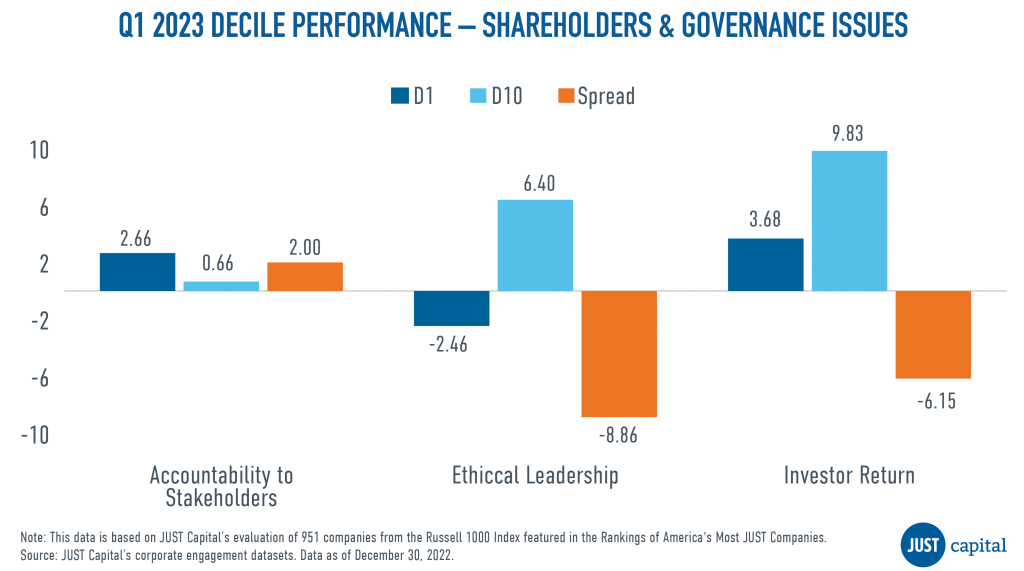
In Q1 we saw the Accountability to Stakeholders Issue deliver positive performance, with a long-short spread of 2%, whereas Ethical Leadership and Investor Return stakeholder performance was negative.
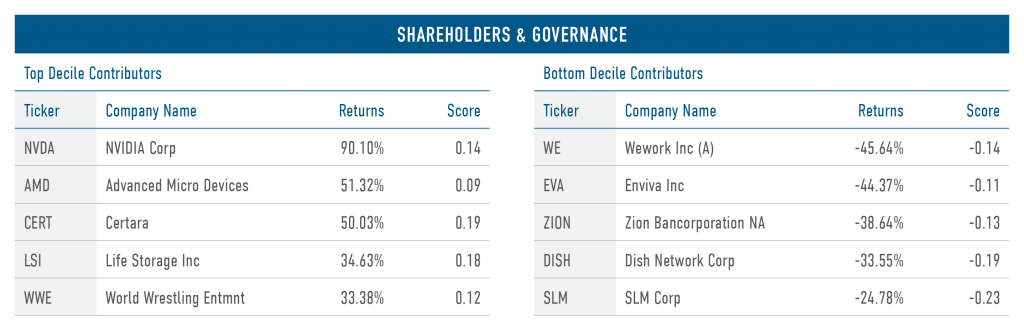
Shown below are both the top and bottom five contributors to the top decile (D1), the best-ranked companies as measured by their Shareholders and Governance score, and the bottom decile (D10), the lowest-ranked companies as measured by their Shareholders and Governance score.
Customers Performance
The Customers stakeholder measures a company across four Issues:
- Customer Privacy
- Customer Treatment
- Transparent Communication
- Beneficial Products
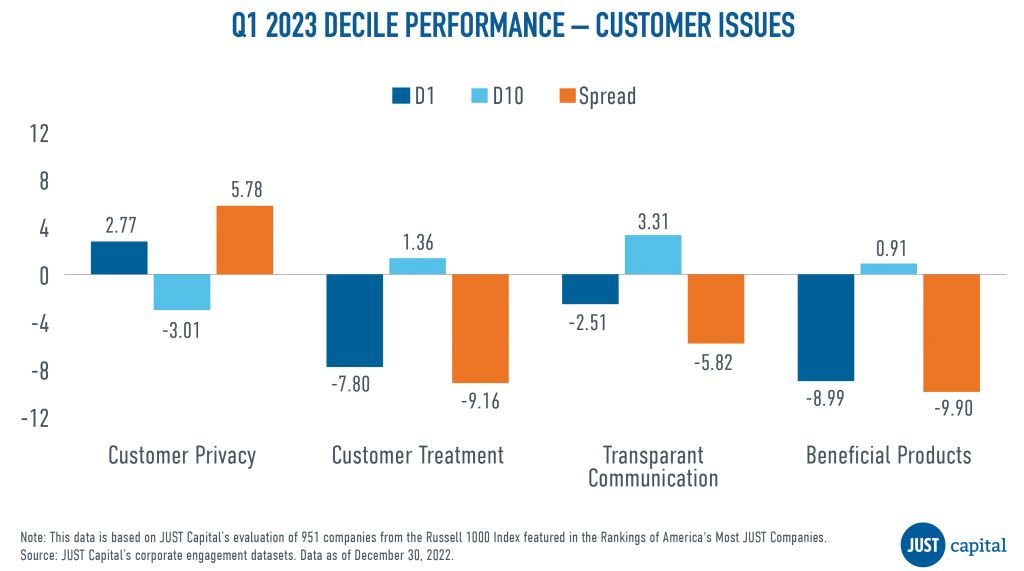
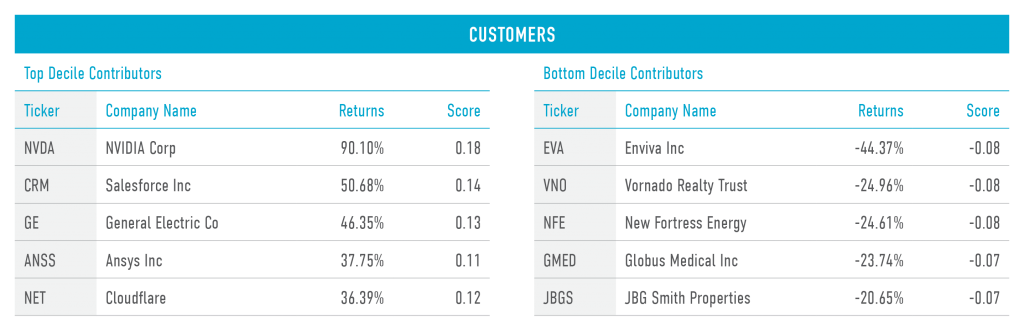
In Q1 2023, we saw Customer Privacy outperform the other Customer Issues, with a long-short spread of 5.78%. Beneficial Products, Customer Treatment, and Transparent Communication were negative contributors to Customer performance.
Shown below are the both top and bottom five contributors to the top decile (D1), the best-ranked companies as measured by their Customer score, and the bottom decile (D10), the lowest-ranked names as measured by Customer score).
Environment Performance
The Environment stakeholder measures a company across four Issues:
- Sustainable Materials
- Pollution Reduction
- Climate Change
- Resource Efficiency
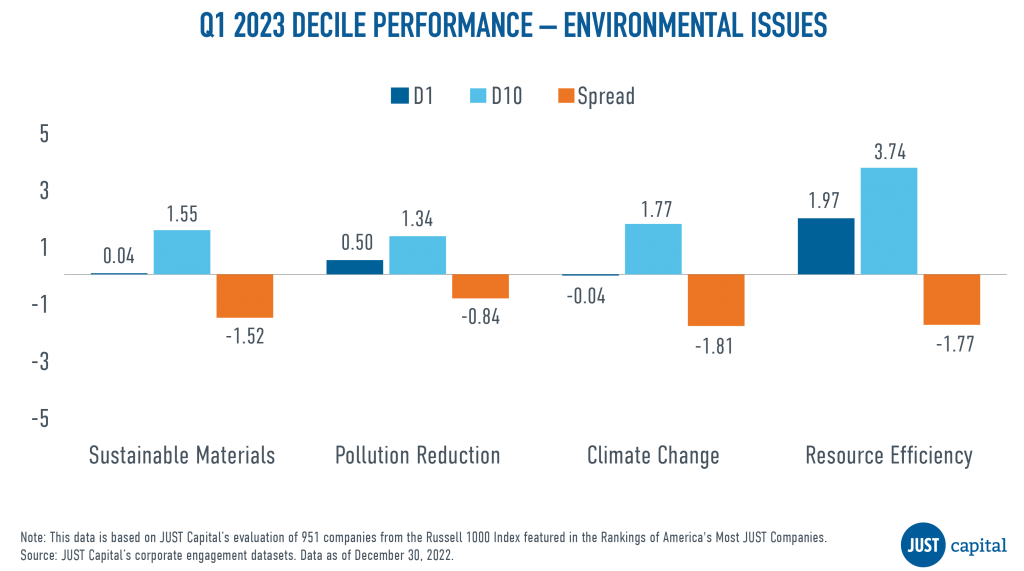
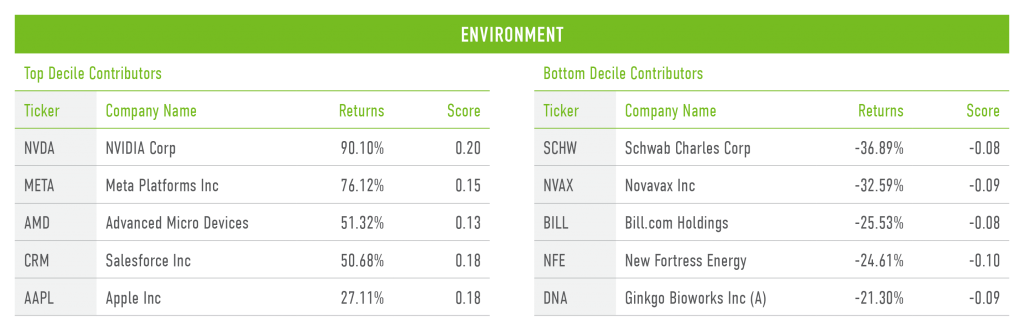
In Q1 2023, we saw all Environment Issues deliver negative performance with Pollution Reduction outperforming other Environment Issues. Resource Efficiency, Sustainable Materials, and Climate Change delivered negative performance in this quarter.
Shown below are the both top and bottom five contributors to the top decile (D1), the best-ranked companies as measured by their Environmental score, and the bottom decile (D10), the lowest-ranked companies as measured by their Environmental score.
Appendix
Computation Methodology
We monitor the performance of these stakeholders and Issues on a long-short basis. The long and short portfolios are selected based on the factor scores as the top and bottom deciles within the universe of companies we track in the Russell 1000. Top decile (D1) companies are those that rank highest based on the factor score, and bottom decile (D10) companies are those that rank lowest based on the factor score.
D1 Performance is computed as:
(Equally weighted average of returns of stocks in D1 bucket) – (Equally weighted average of returns of all stocks within the Universe)
D10 Performance is computed as:
(Equally weighted average of returns of stocks in D10 bucket) – (Equally weighted average of returns of all stocks within the Universe)
Spread is computed as:
D1 Performance – D10 Performance