JUST Report
JUST Capital’s Quarterly Review of Stakeholder Performance – Q3 2024
- More Reports
- View all JUST Reports
In the third quarter of 2024, the S&P 500 posted a gain of 5.9%, reflecting the resilience of equity markets as they overcame initial volatility, including a sharp 12% correction in the technology sector. This recovery was driven by a significant shift in Federal Reserve policy, with the Fed implementing a 0.50% rate cut in September, the first such reduction since March 2020.
Sector performance underscored a rotation from growth-oriented areas of the market to more stable, income-generating value sectors. Value stocks out-performed growth stocks, with value sectors like utilities, financials, and consumer staples gaining traction amid market uncertainty. Value stocks returned a robust 9% for the quarter, significantly outperforming growth stocks, which posted a more modest 3.6% gain. Utilities led the way with an impressive 19.4% return, followed by real estate investment trusts (REITs), which gained 17.2%, and financials, which rose 10.7%. These sectors benefited from their defensive characteristics and income-generating potential, which became more attractive as interest rate expectations shifted. Energy, however, was the sole sector in negative territory due to weaker demand and lower oil prices, although it remains up 8.4% year-to-date.
The Federal Reserve’s rate cut also supported a notable rally in small-cap stocks, which outperformed their large-cap counterparts. The Russell 2000 small-cap index gained 9.3% during the quarter, benefitting from the Fed’s dovish stance, as lower rates tend to favor smaller companies that are more sensitive to borrowing costs. This marked a reversal from earlier in the year, when large-cap growth stocks dominated due to their perceived stability in a volatile economic environment.
As of September 30, 2024, our flagship index – the JUST U.S. Large Cap Diversified Index (JULCD) has out-performed the Russell 1000 (Cap-Weighted) benchmark by 0.46% year-to-date and by 11.97% since its inception. Additionally, the JUST 100 (equally weighted index) has outperformed the Russell 1000 (Equally-Weighted) index by 7.38% year-to-date and by 51.1% since its inception.
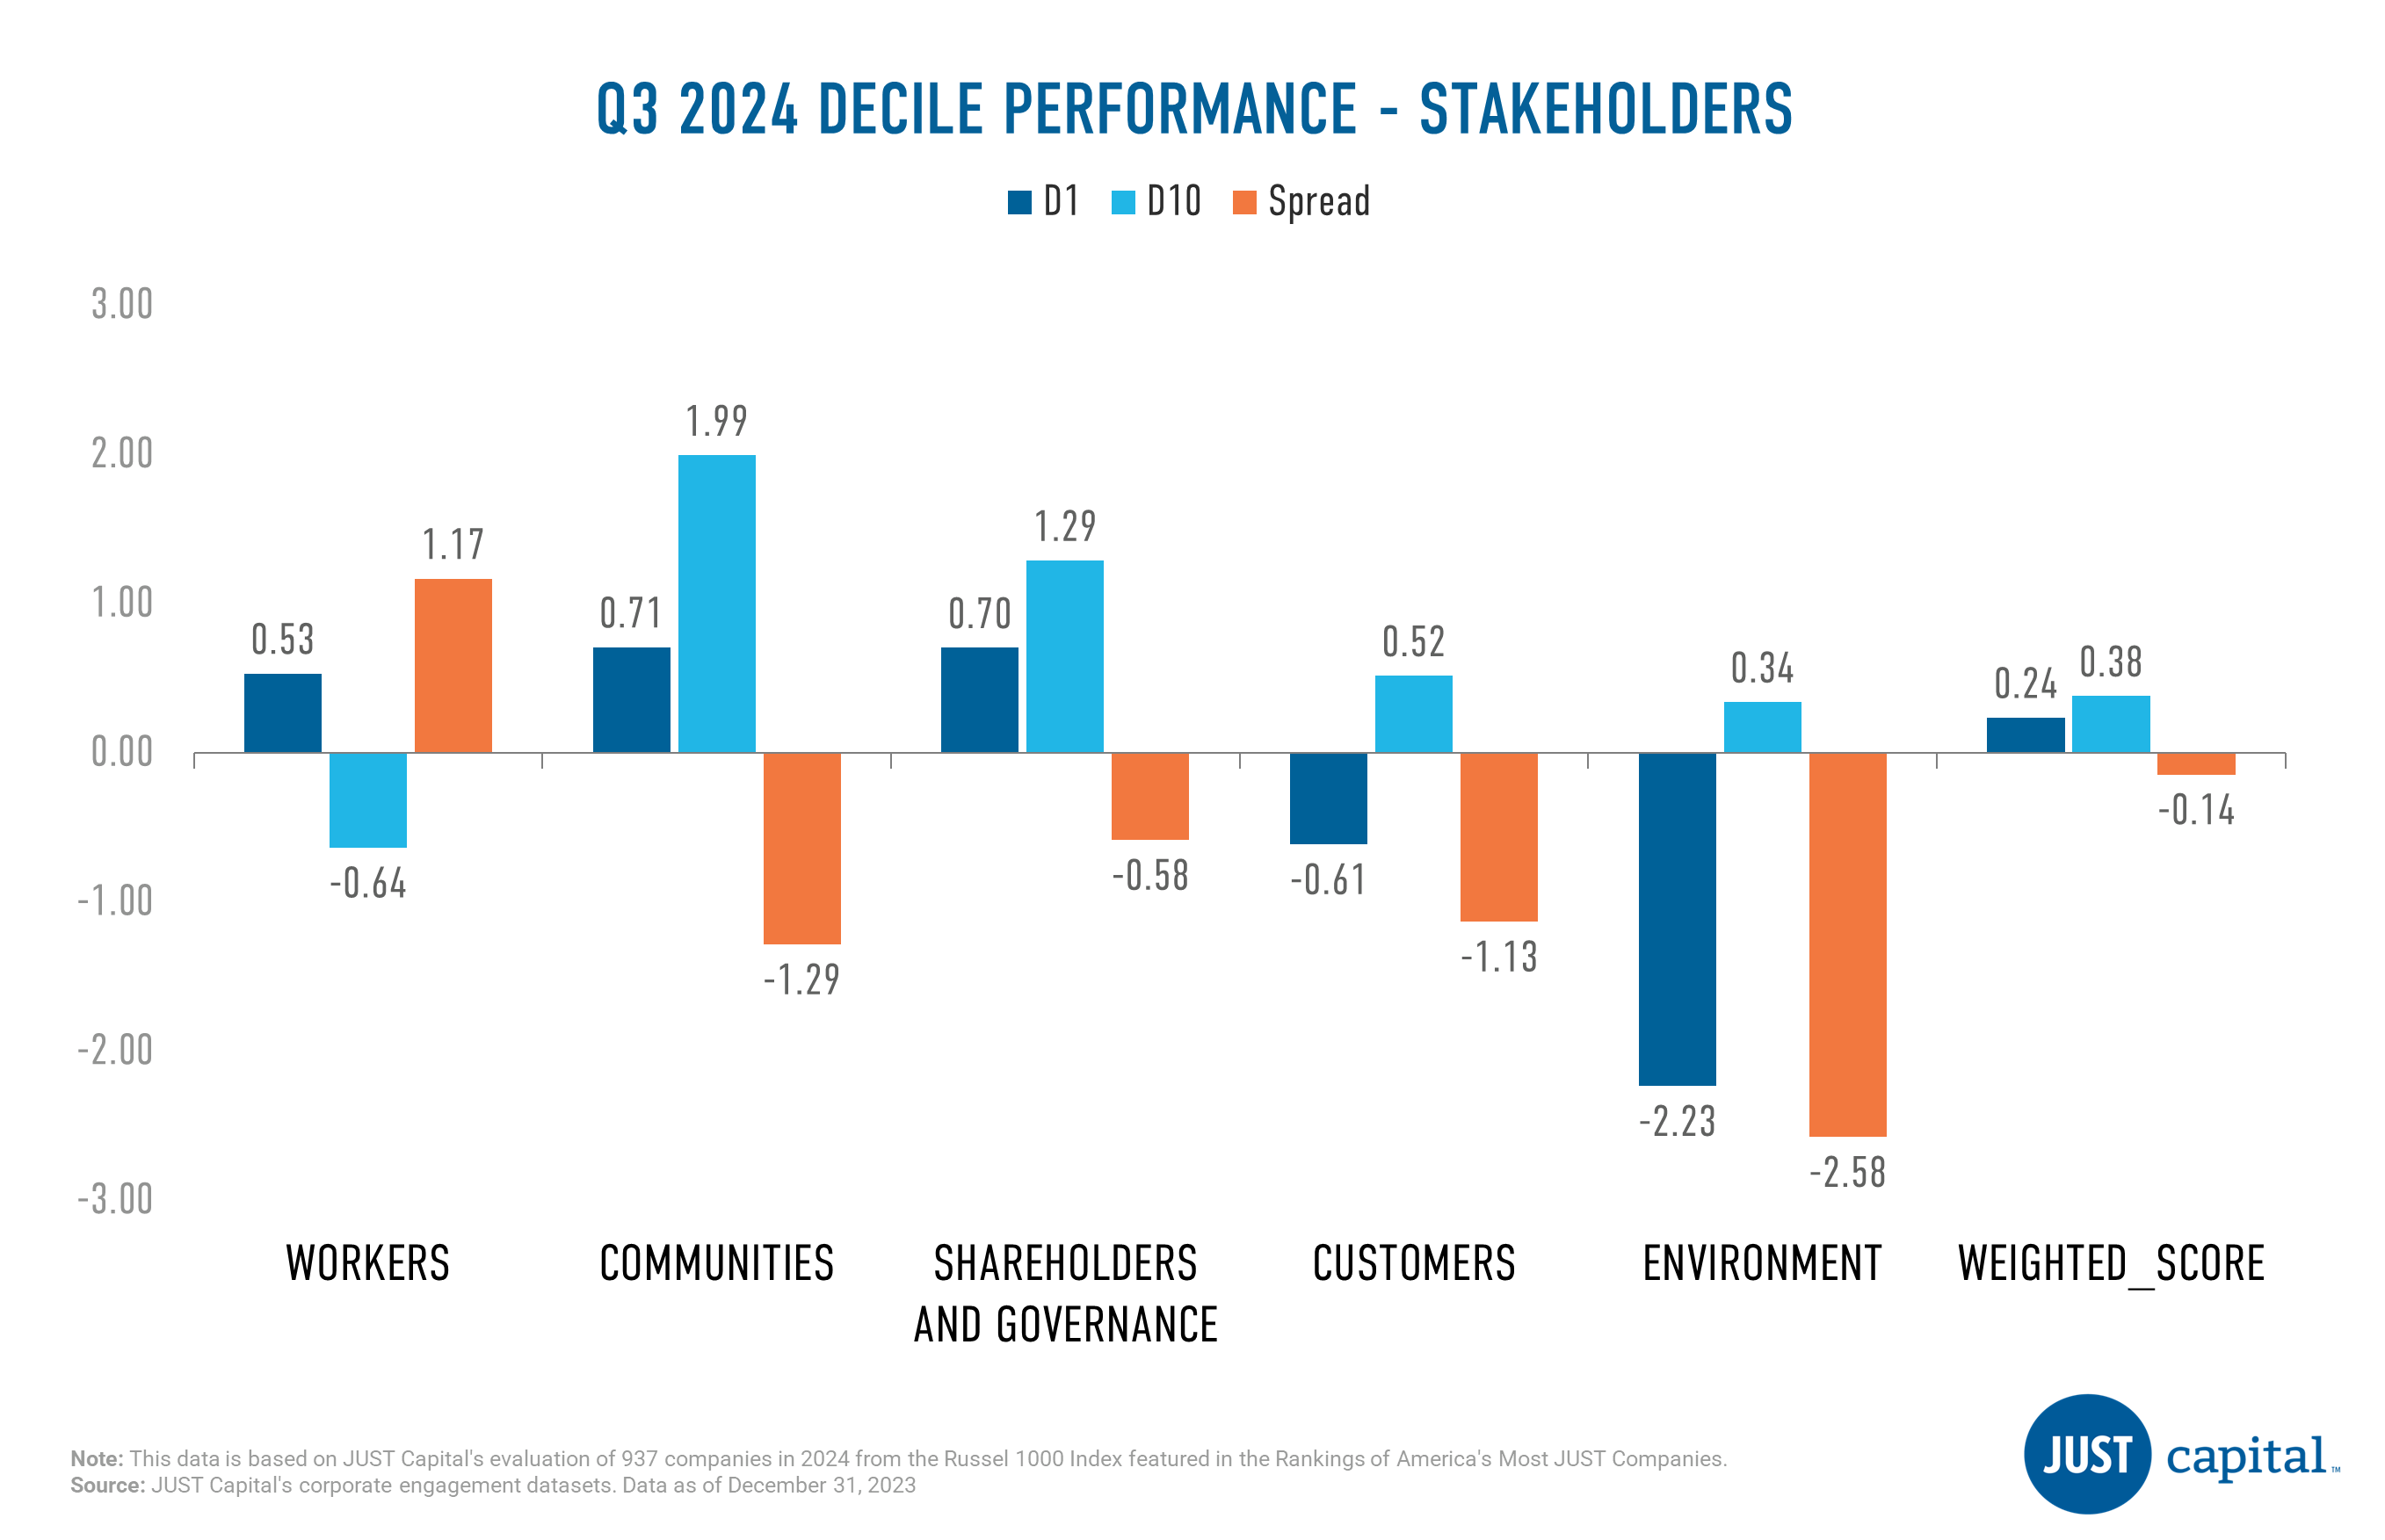
JUST Capital found that four out of the five stakeholder categories it tracks delivered negative performance in Q3 2024, with the “Workers” stakeholder being the sole positive performer. The Workers stakeholder delivered the strongest performance over this period with a long-short spread of 1.17%. Notably, within the Workers stakeholder, outperformance was driven by both the top and bottom deciles.
JUST Capital’s Overall Weighted Score takes into account the 20 core Issues determined through our annual survey research – including paying a living wage, creating a diverse, inclusive workplace, and helping combat climate change – across key business stakeholders: Workers, Communities, Shareholders & Governance, Customers, and Environment. The Overall Weighted Score delivered an almost neutral long-short spread of -0.14%, with the bottom decile serving as the primary negative contributor for the period ending September 30, 2024. Year-to-date the performance spread between top and bottom decile for Overall Score is at 9.11%
Workers
The Workers stakeholder measures a company across five Issues:
- Living Wage
- Health & Safety
- Benefits & Work-Life Balance
- Diversity, Equity, and Inclusion
- Workforce Advancement
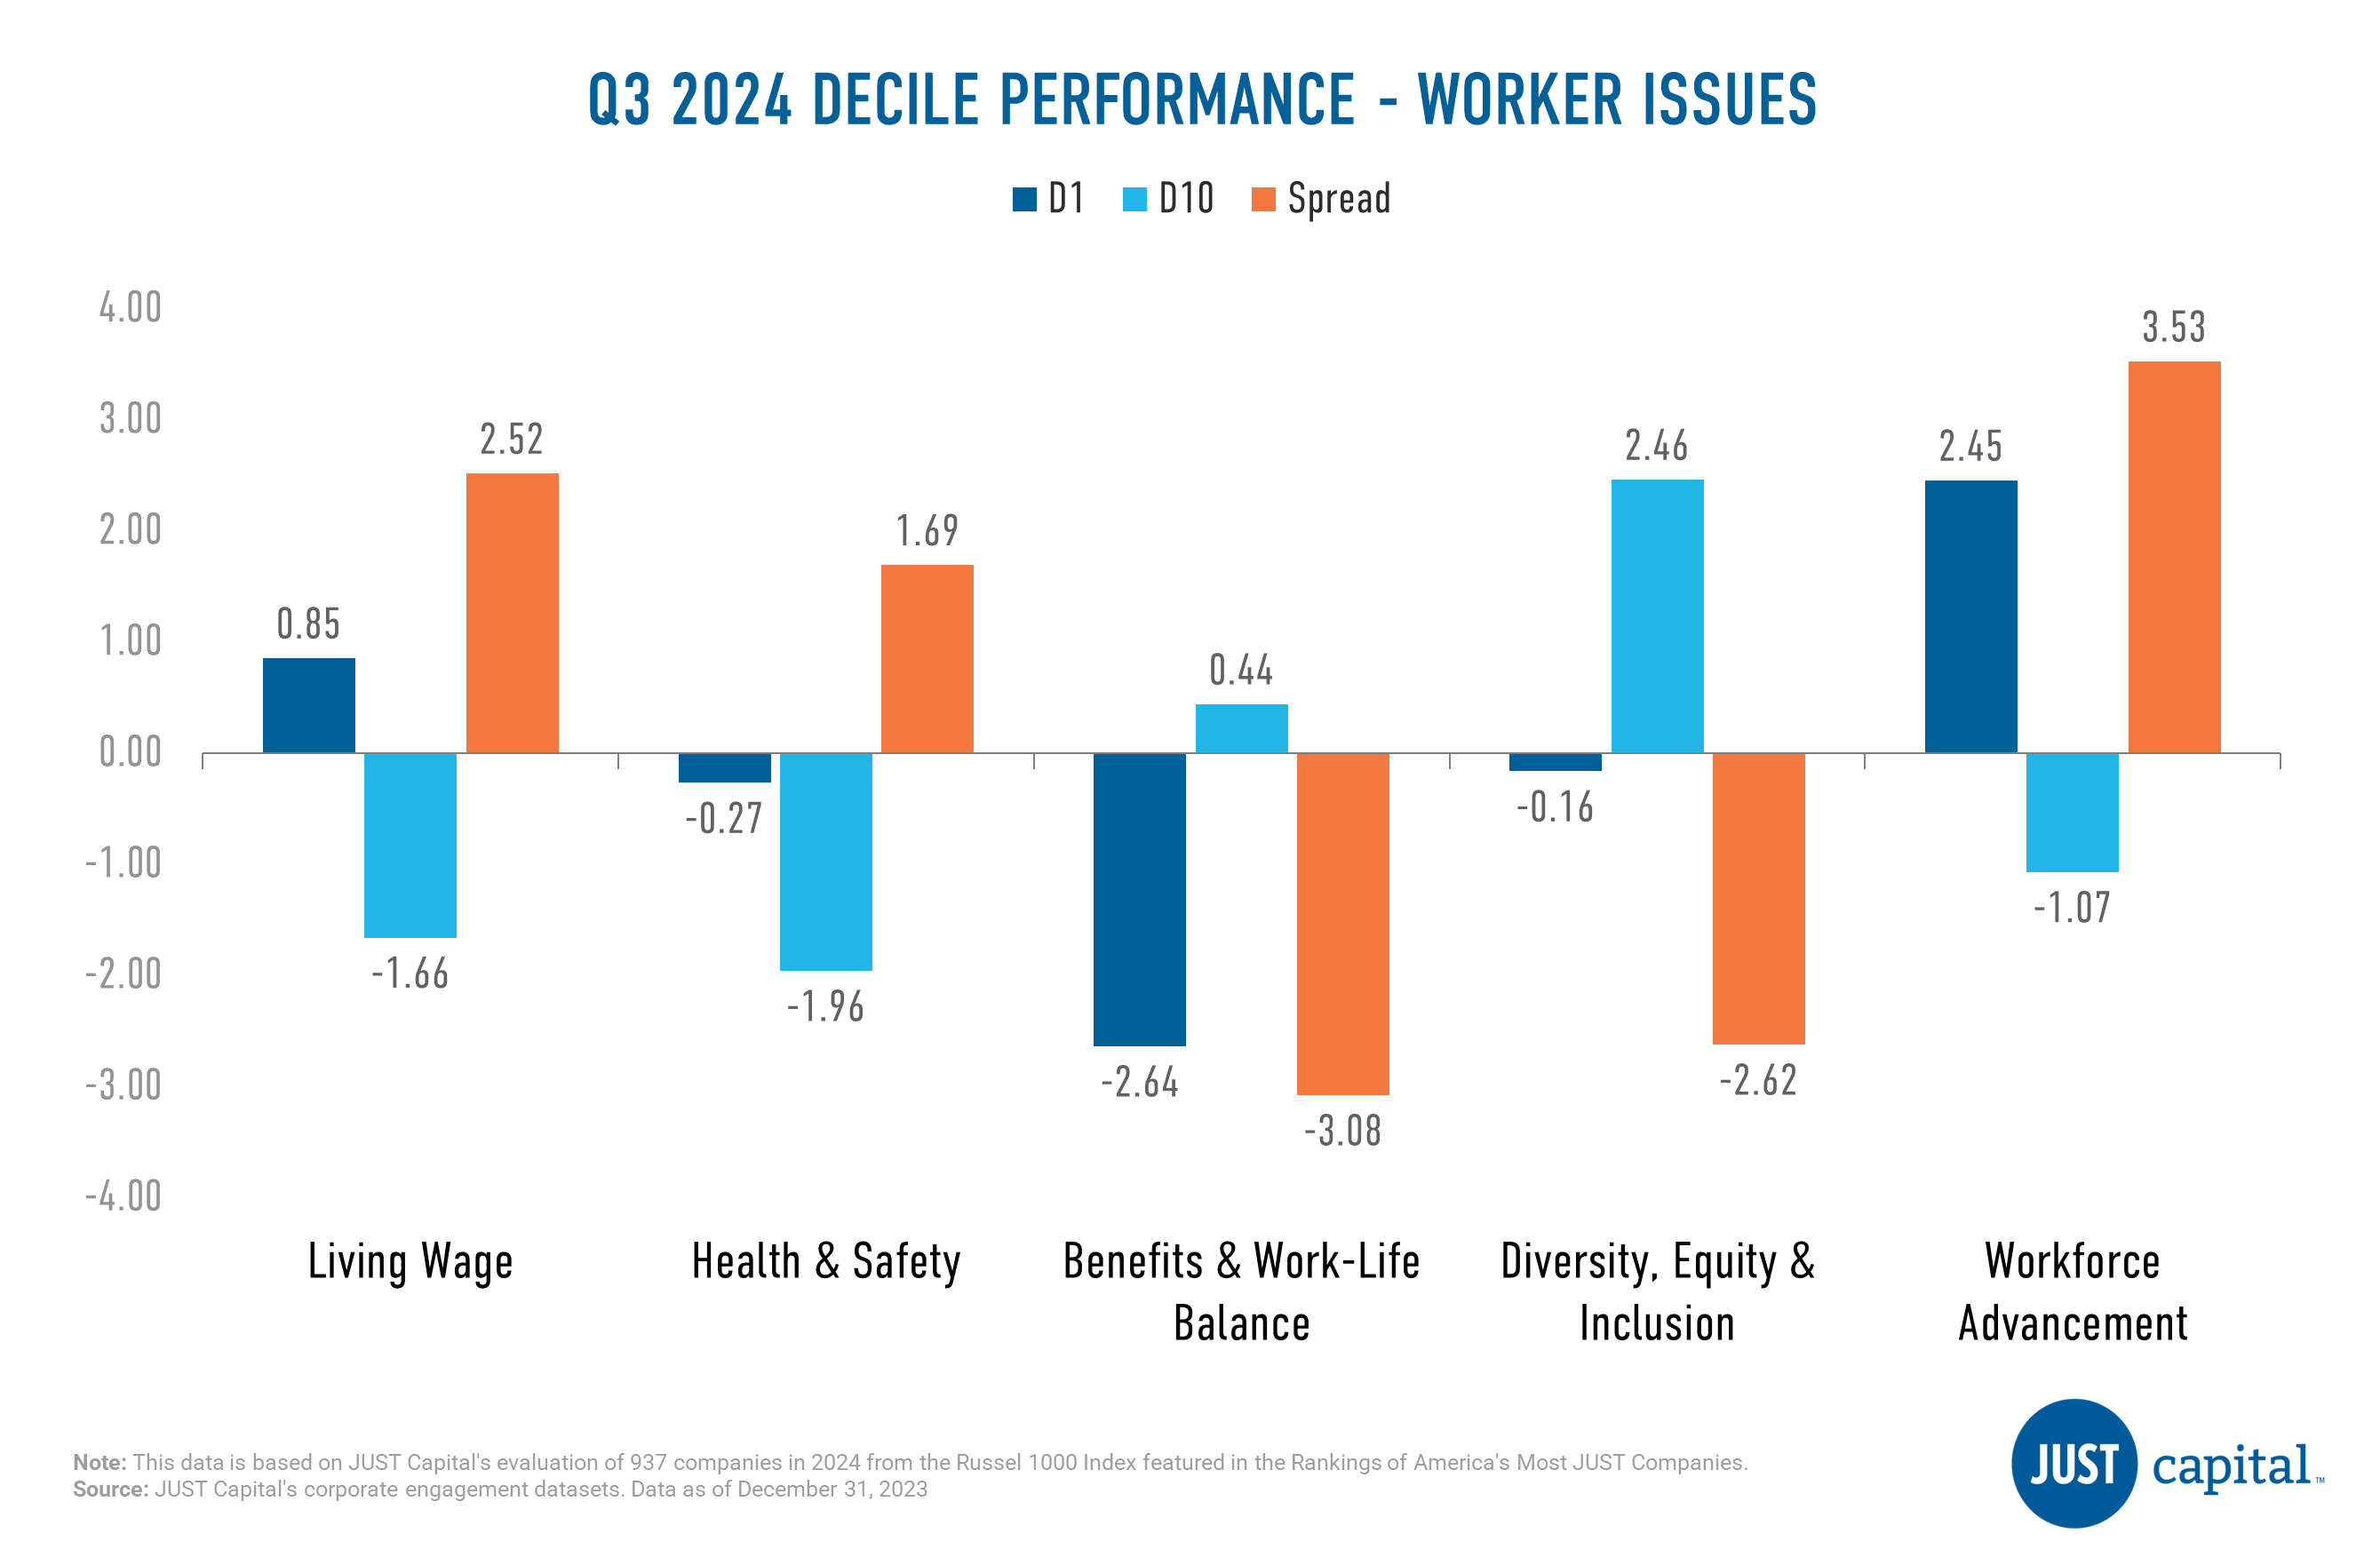
In Q3 2024, we saw three out of five issues deliver positive performance, with the Workforce Advancement Issue faring the best. Benefits & Work-Life Balance was the weakest performer amongst the Worker issues.
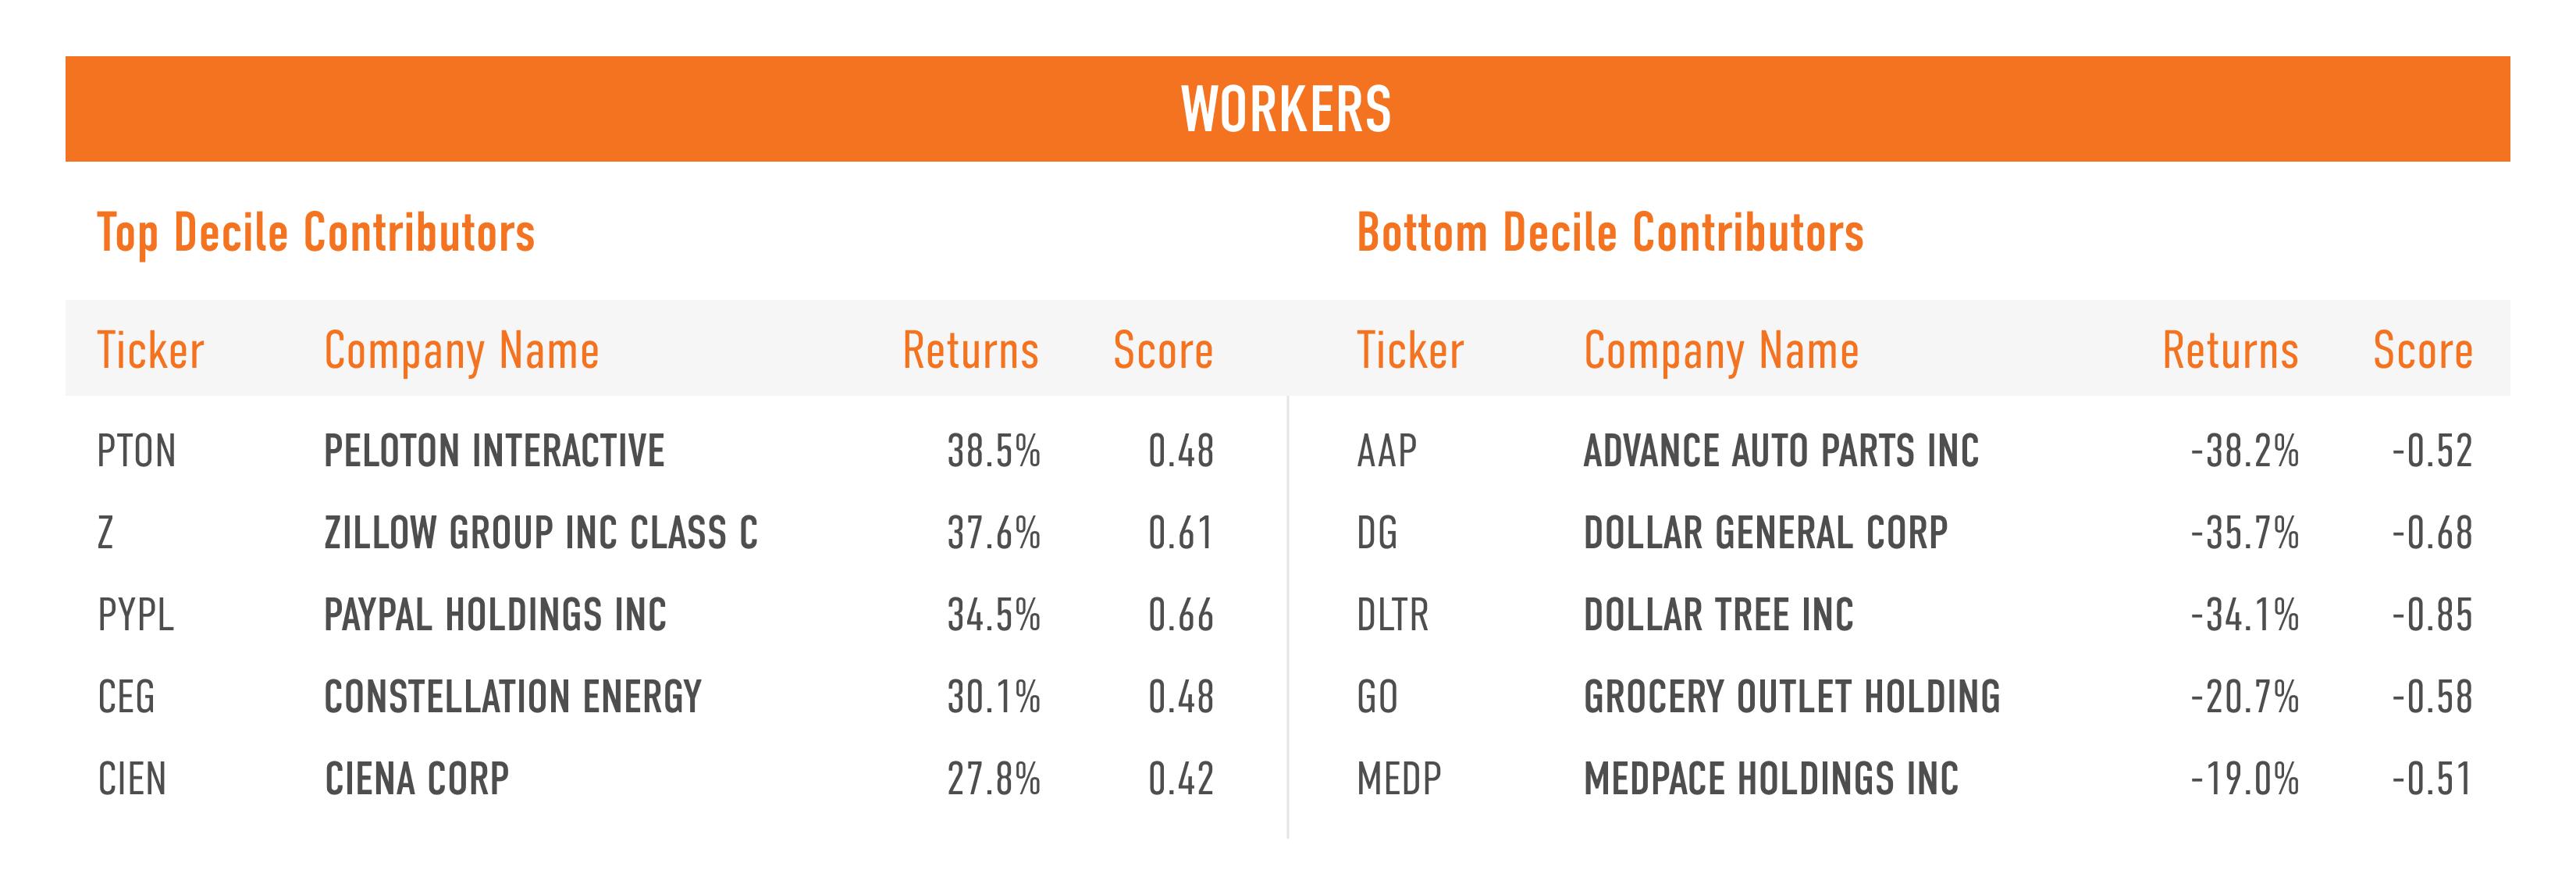
Shown below are the top and bottom five contributors to the top decile (D1), the top-ranked companies as measured by their Workers score, and the bottom decile (D10), the lowest-ranked companies as measured by their Workers score.
Communities
The Communities stakeholder measures a company across four Issues:
- Local Job Creation
- Human Rights
- Community Development
- Community Support
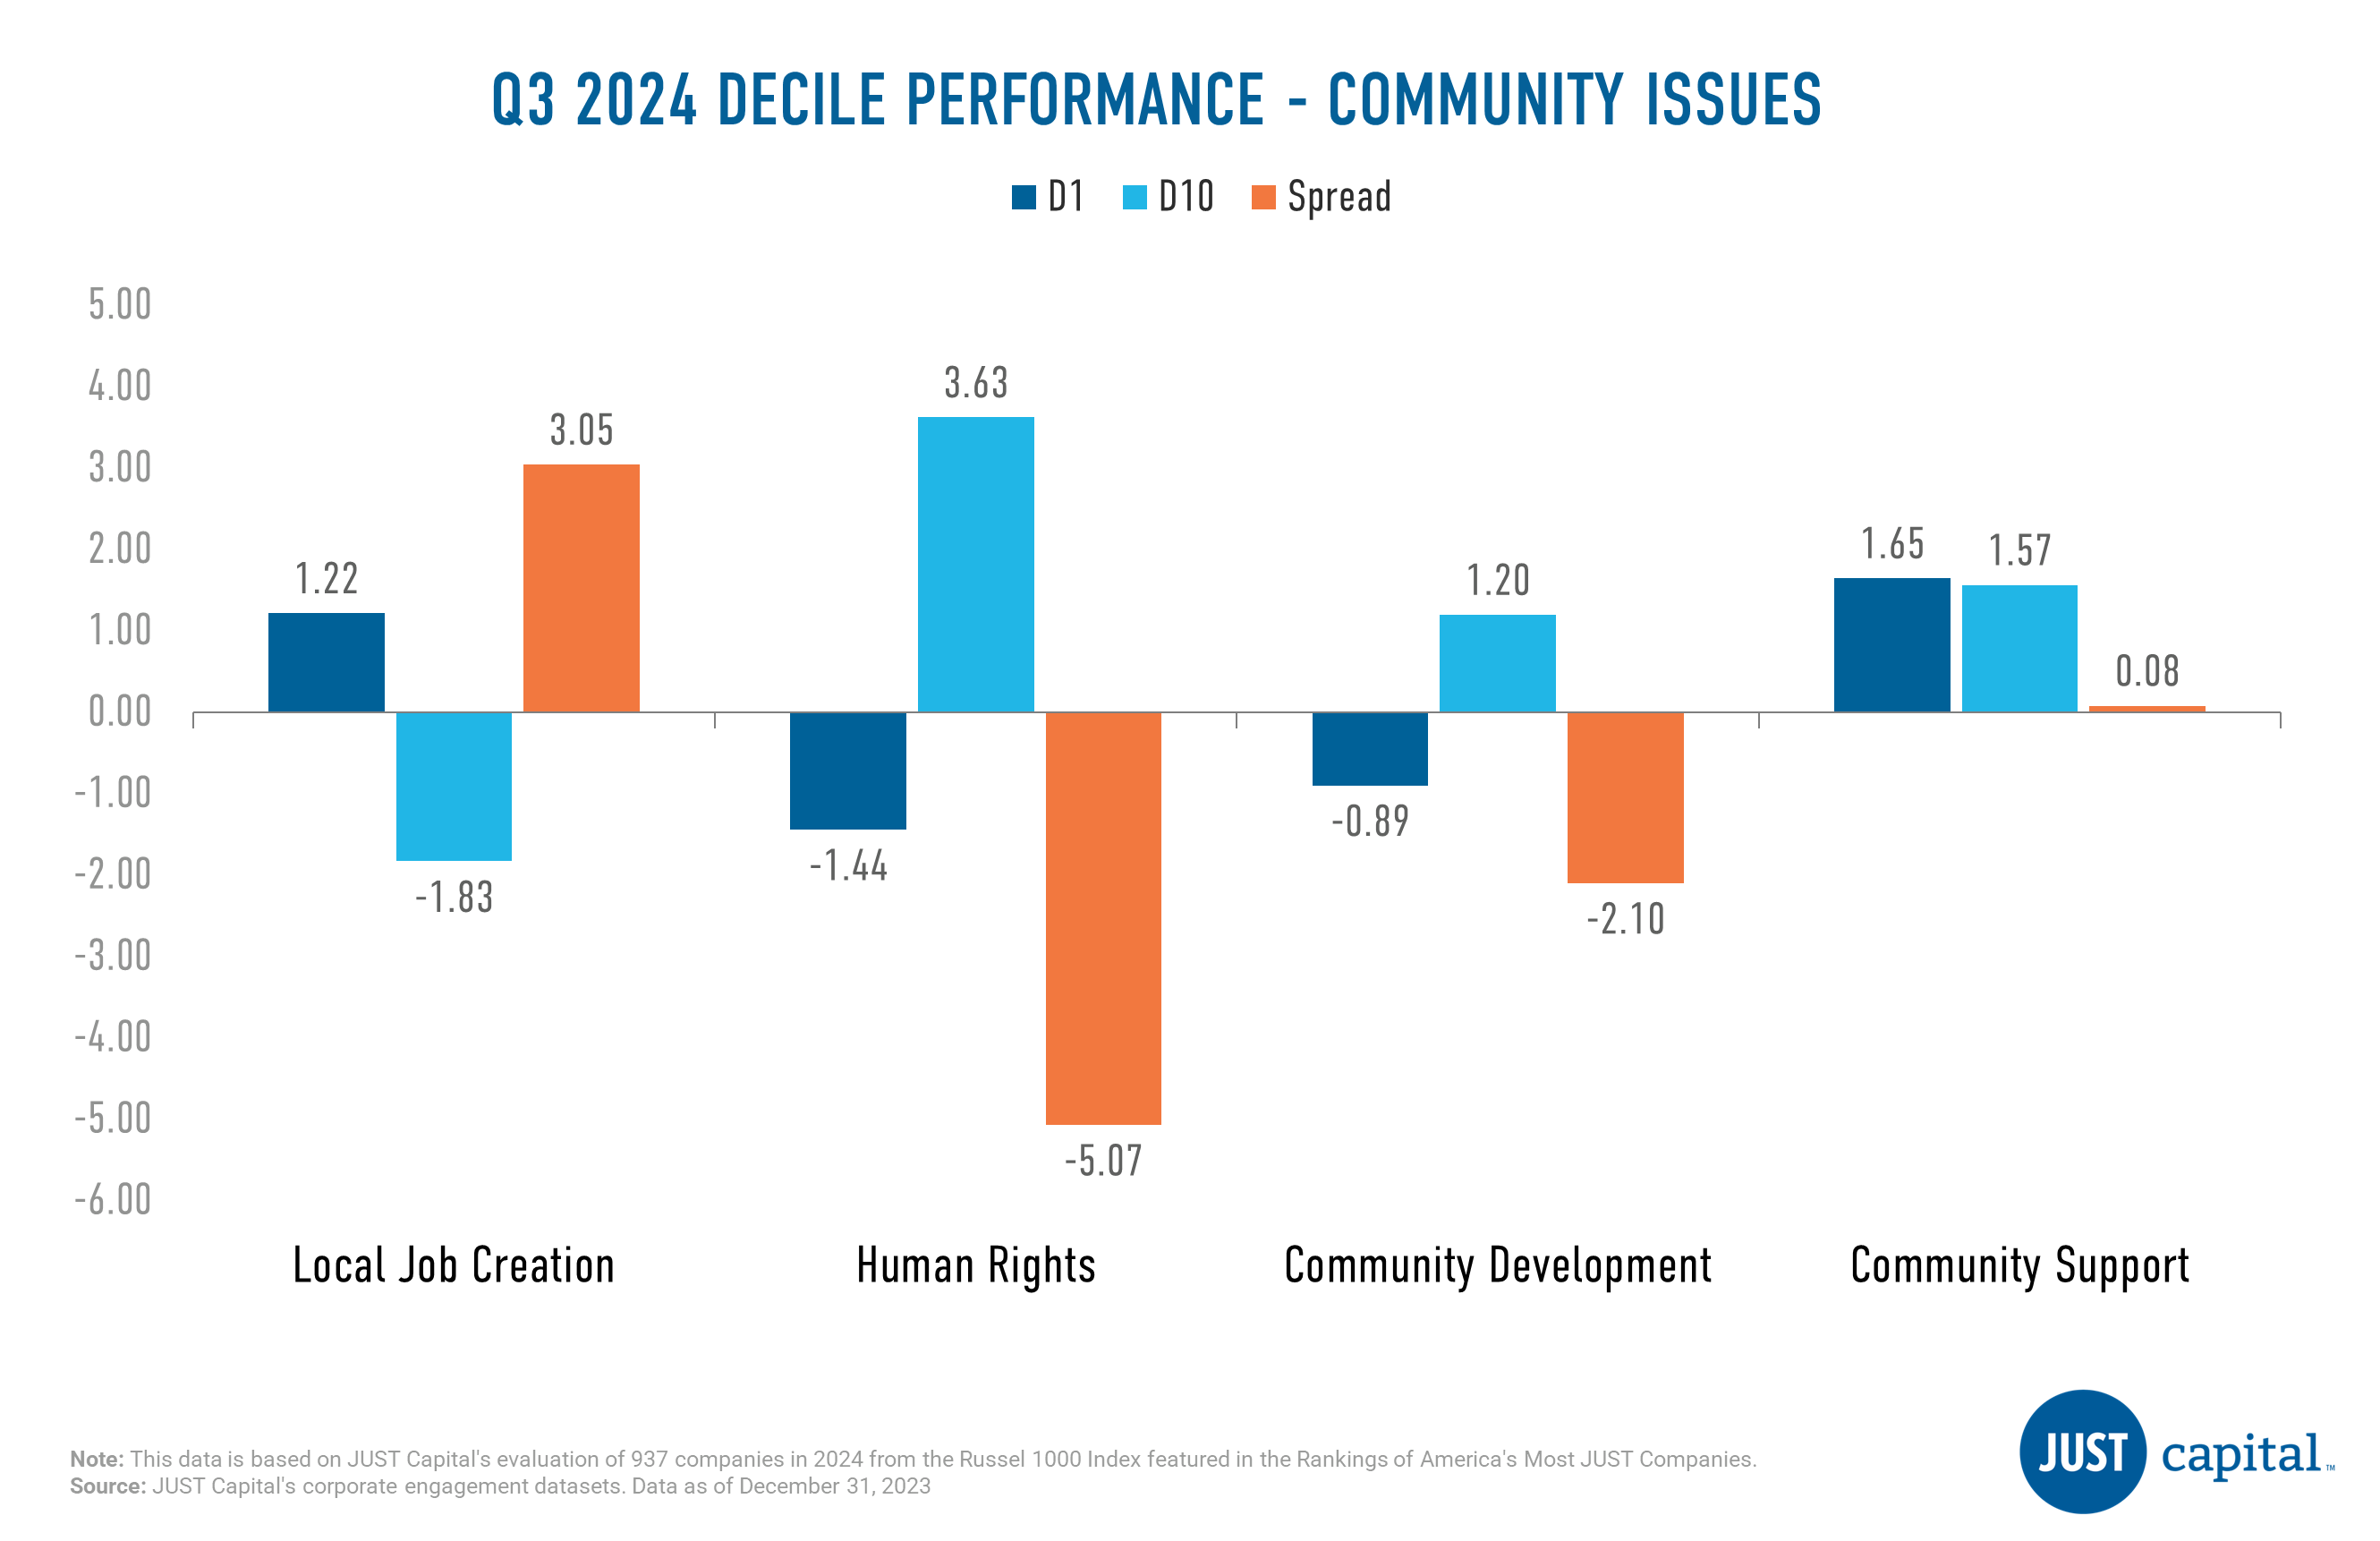
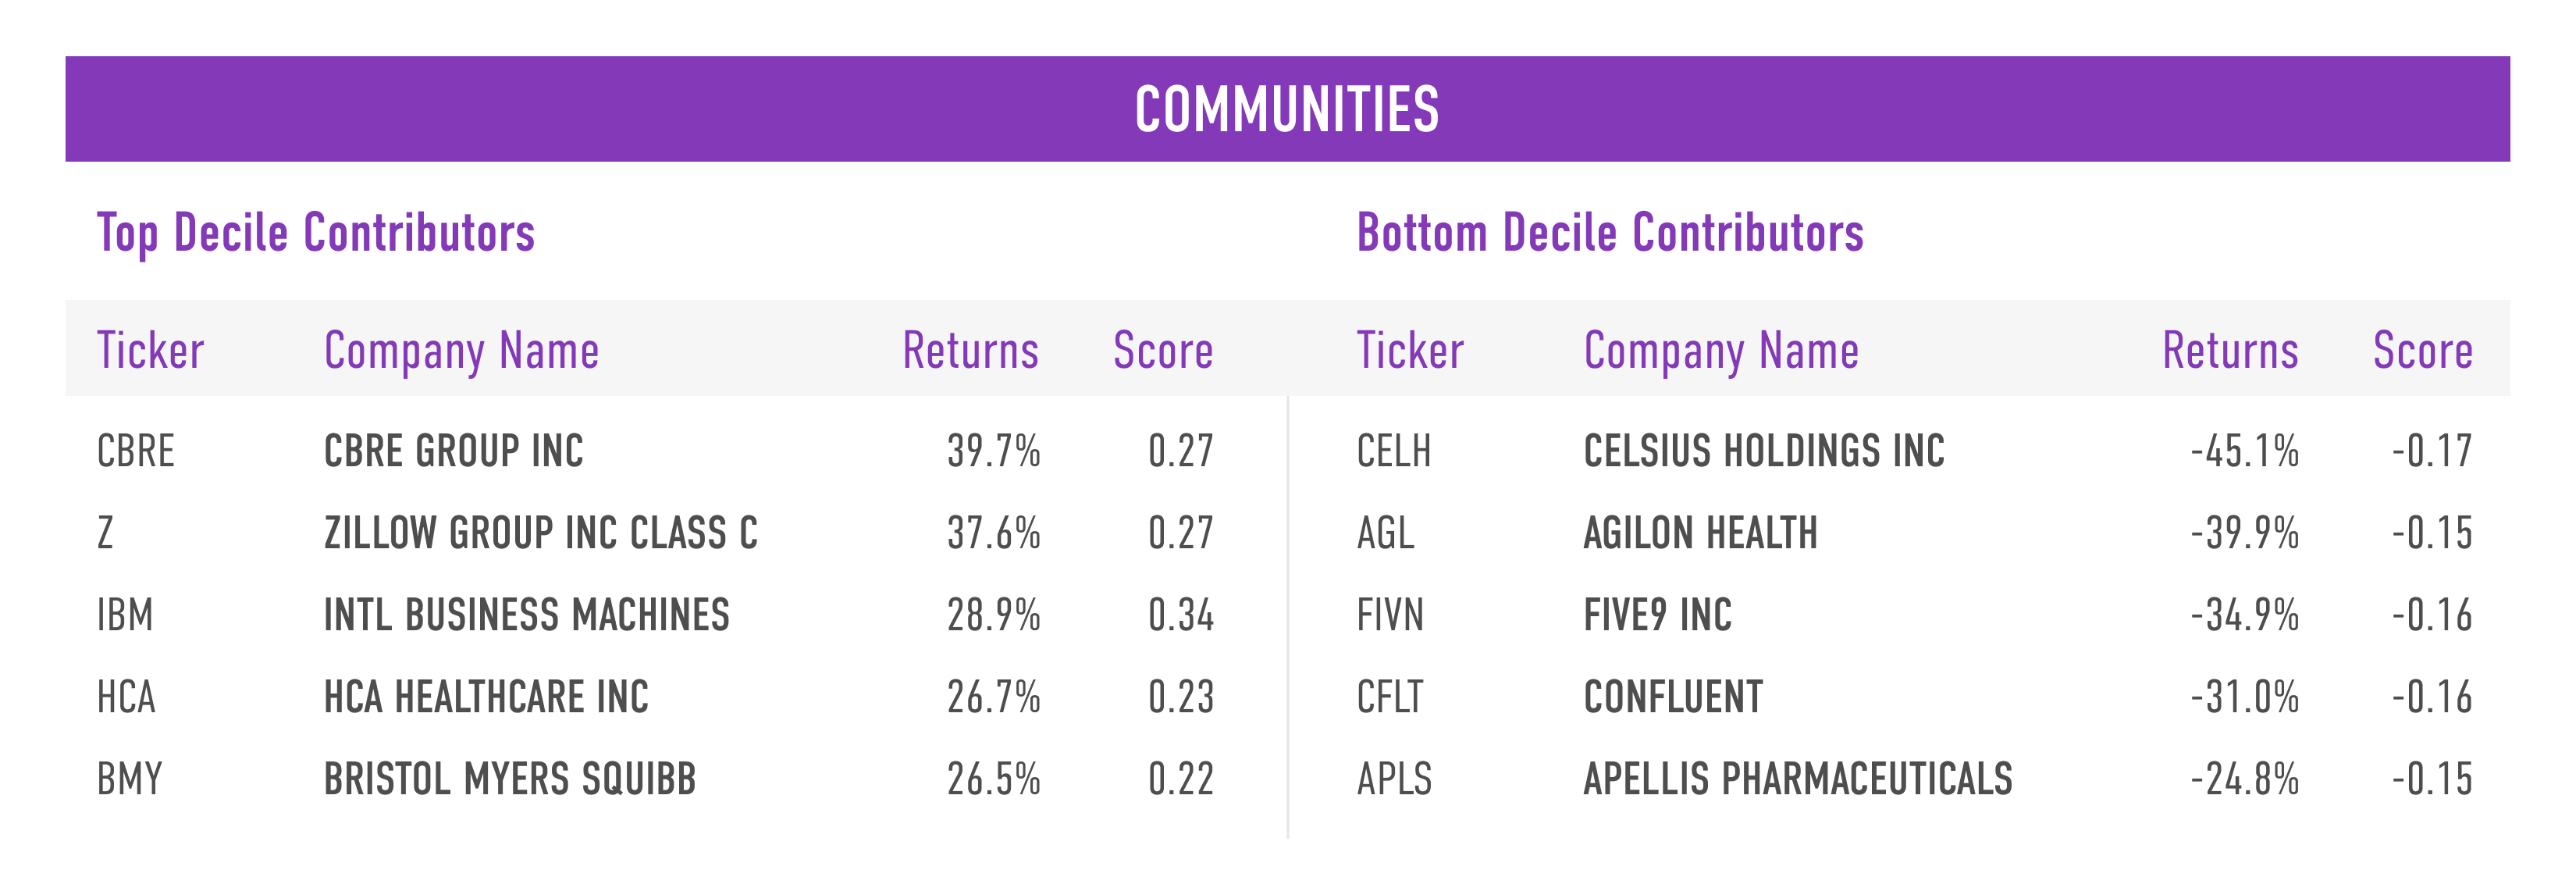
Local Job Creation was the strongest performer followed by Community Support. Human Rights and Community Development were negative contributors this quarter.
Shown below are the top and bottom five contributors to the top decile (D1), the best-ranked companies as measured by their Communities score, and the bottom decile (D10), the lowest-ranked companies as measured by their Communities score.
Shareholders and Governance
The Shareholders and Governance stakeholder measures a company across three Issues:
- Accountability to Stakeholders
- Ethical Leadership
- Investor Return
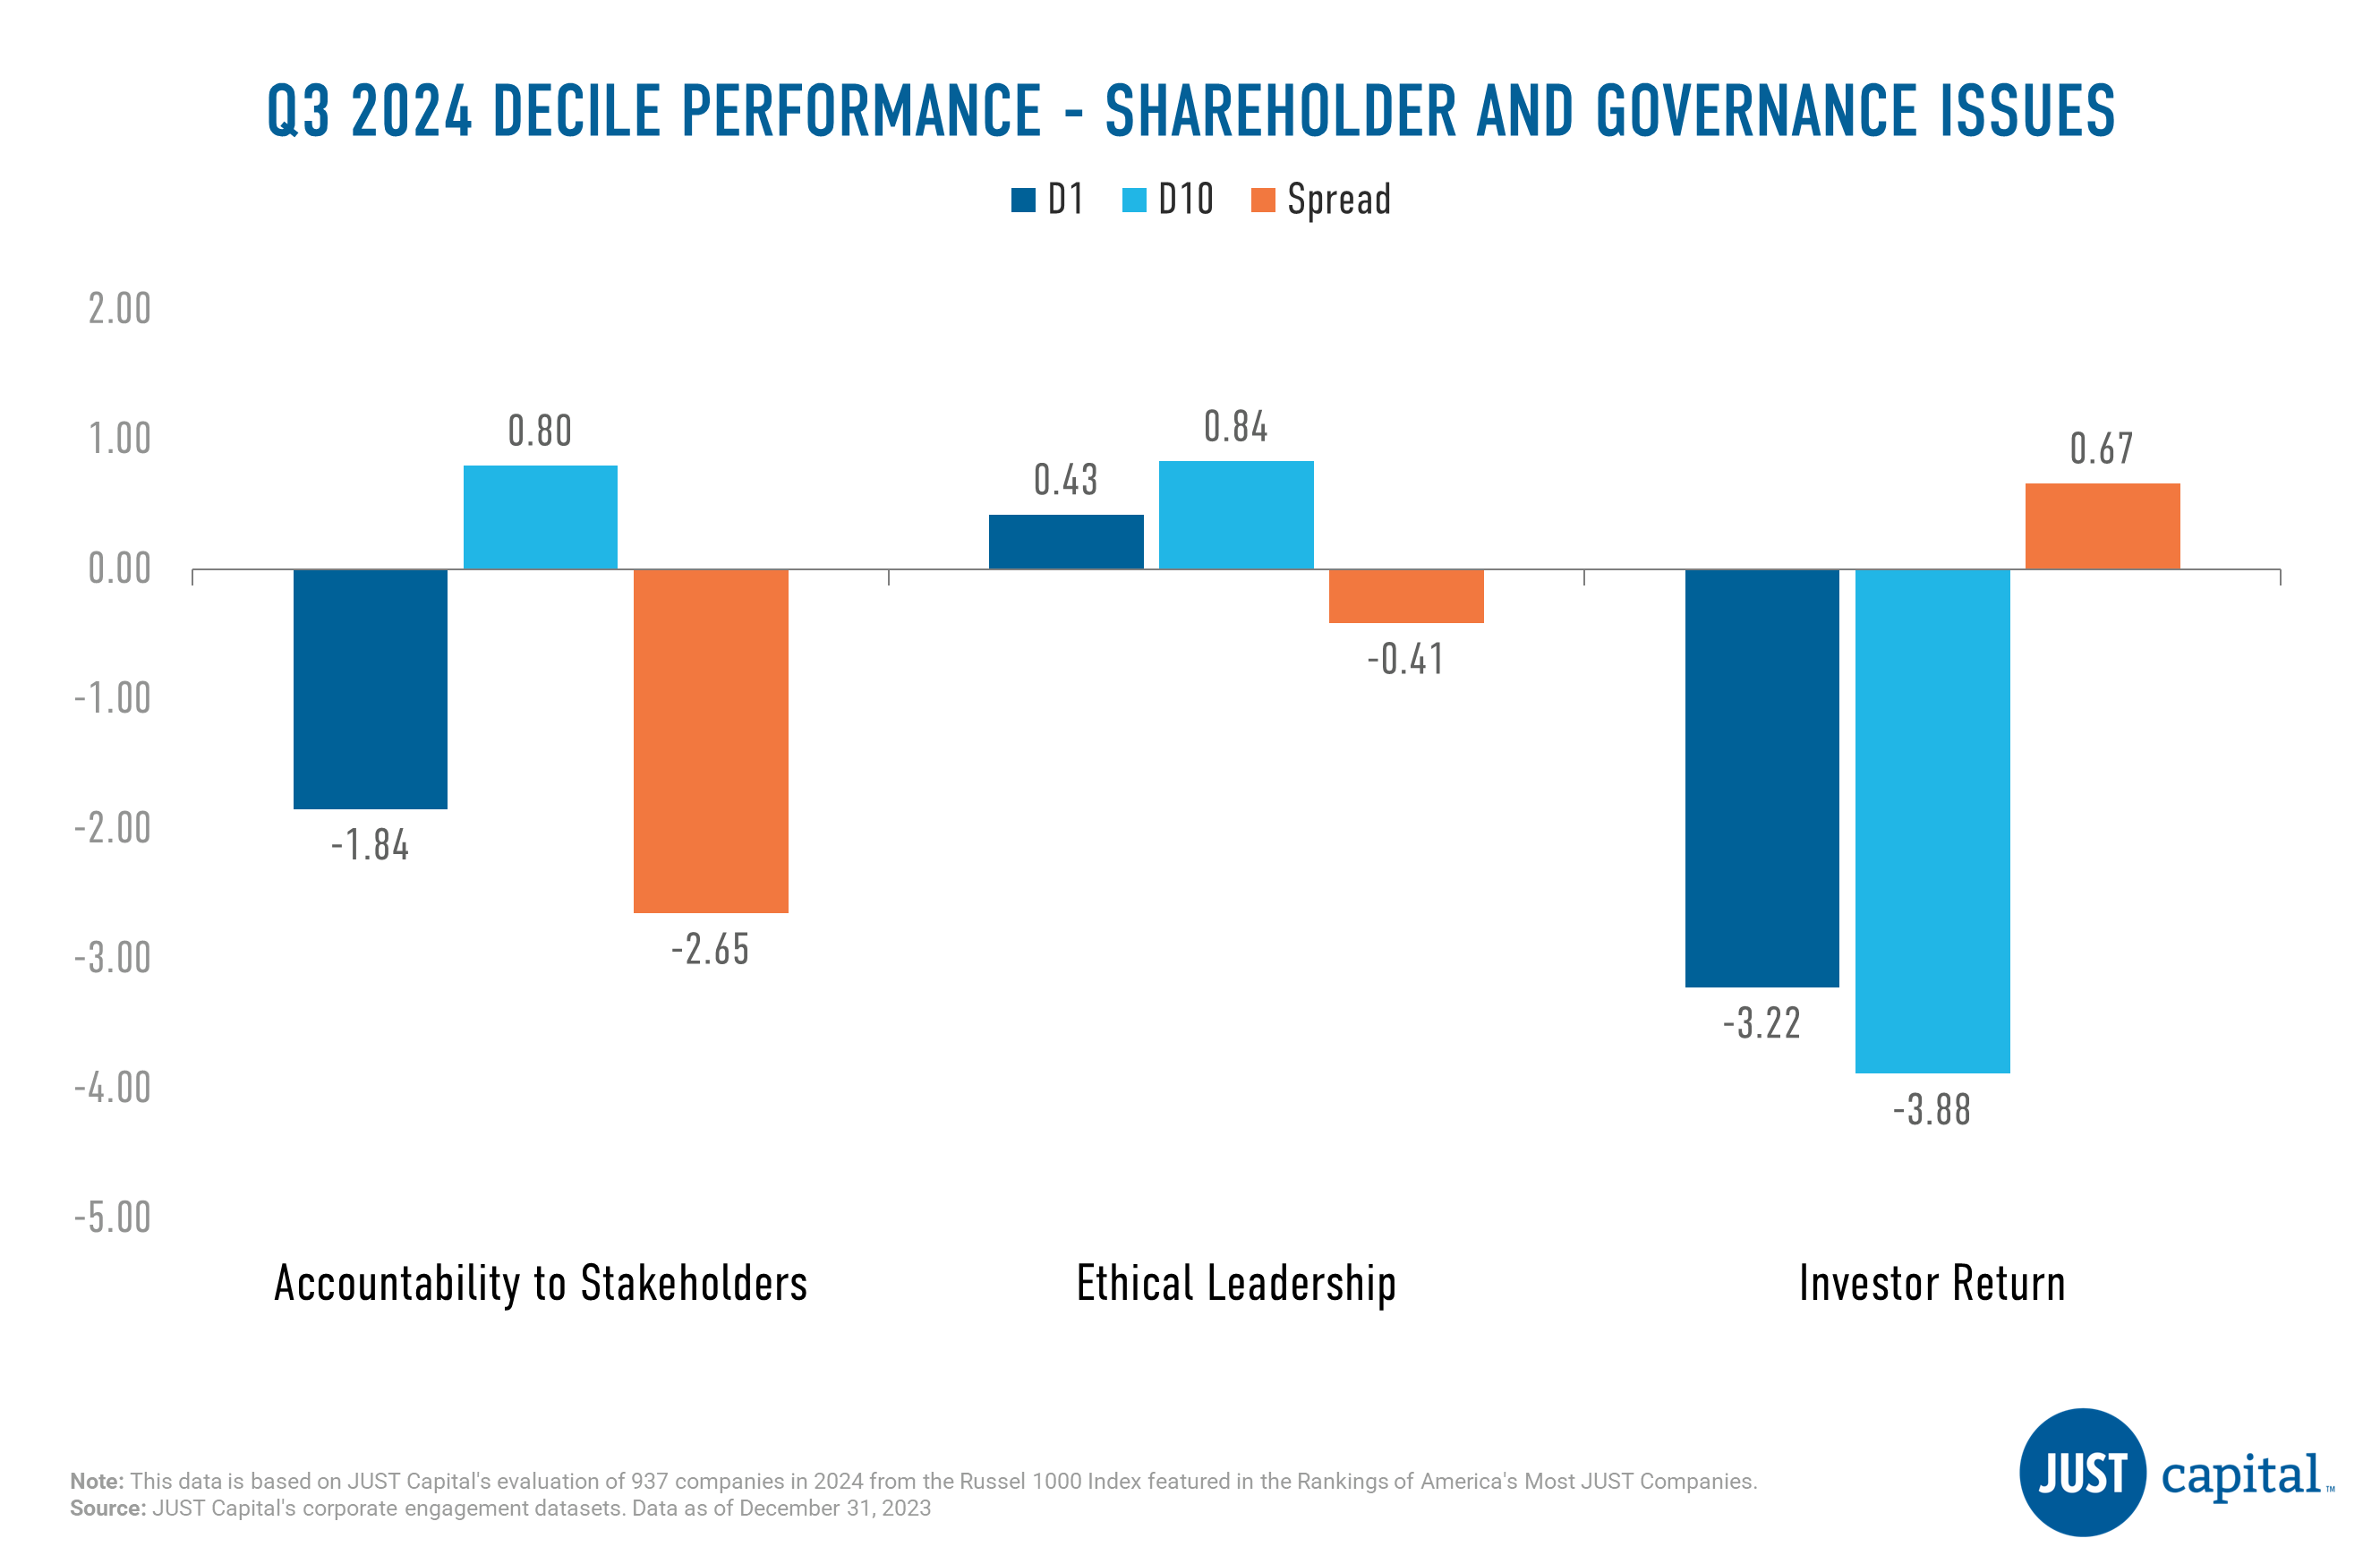
Investor Return Issue was the only positive performer in Q3 with a long-short spread of 0.67%. Remaining issues within the Shareholder stakeholder were negative this quarter.
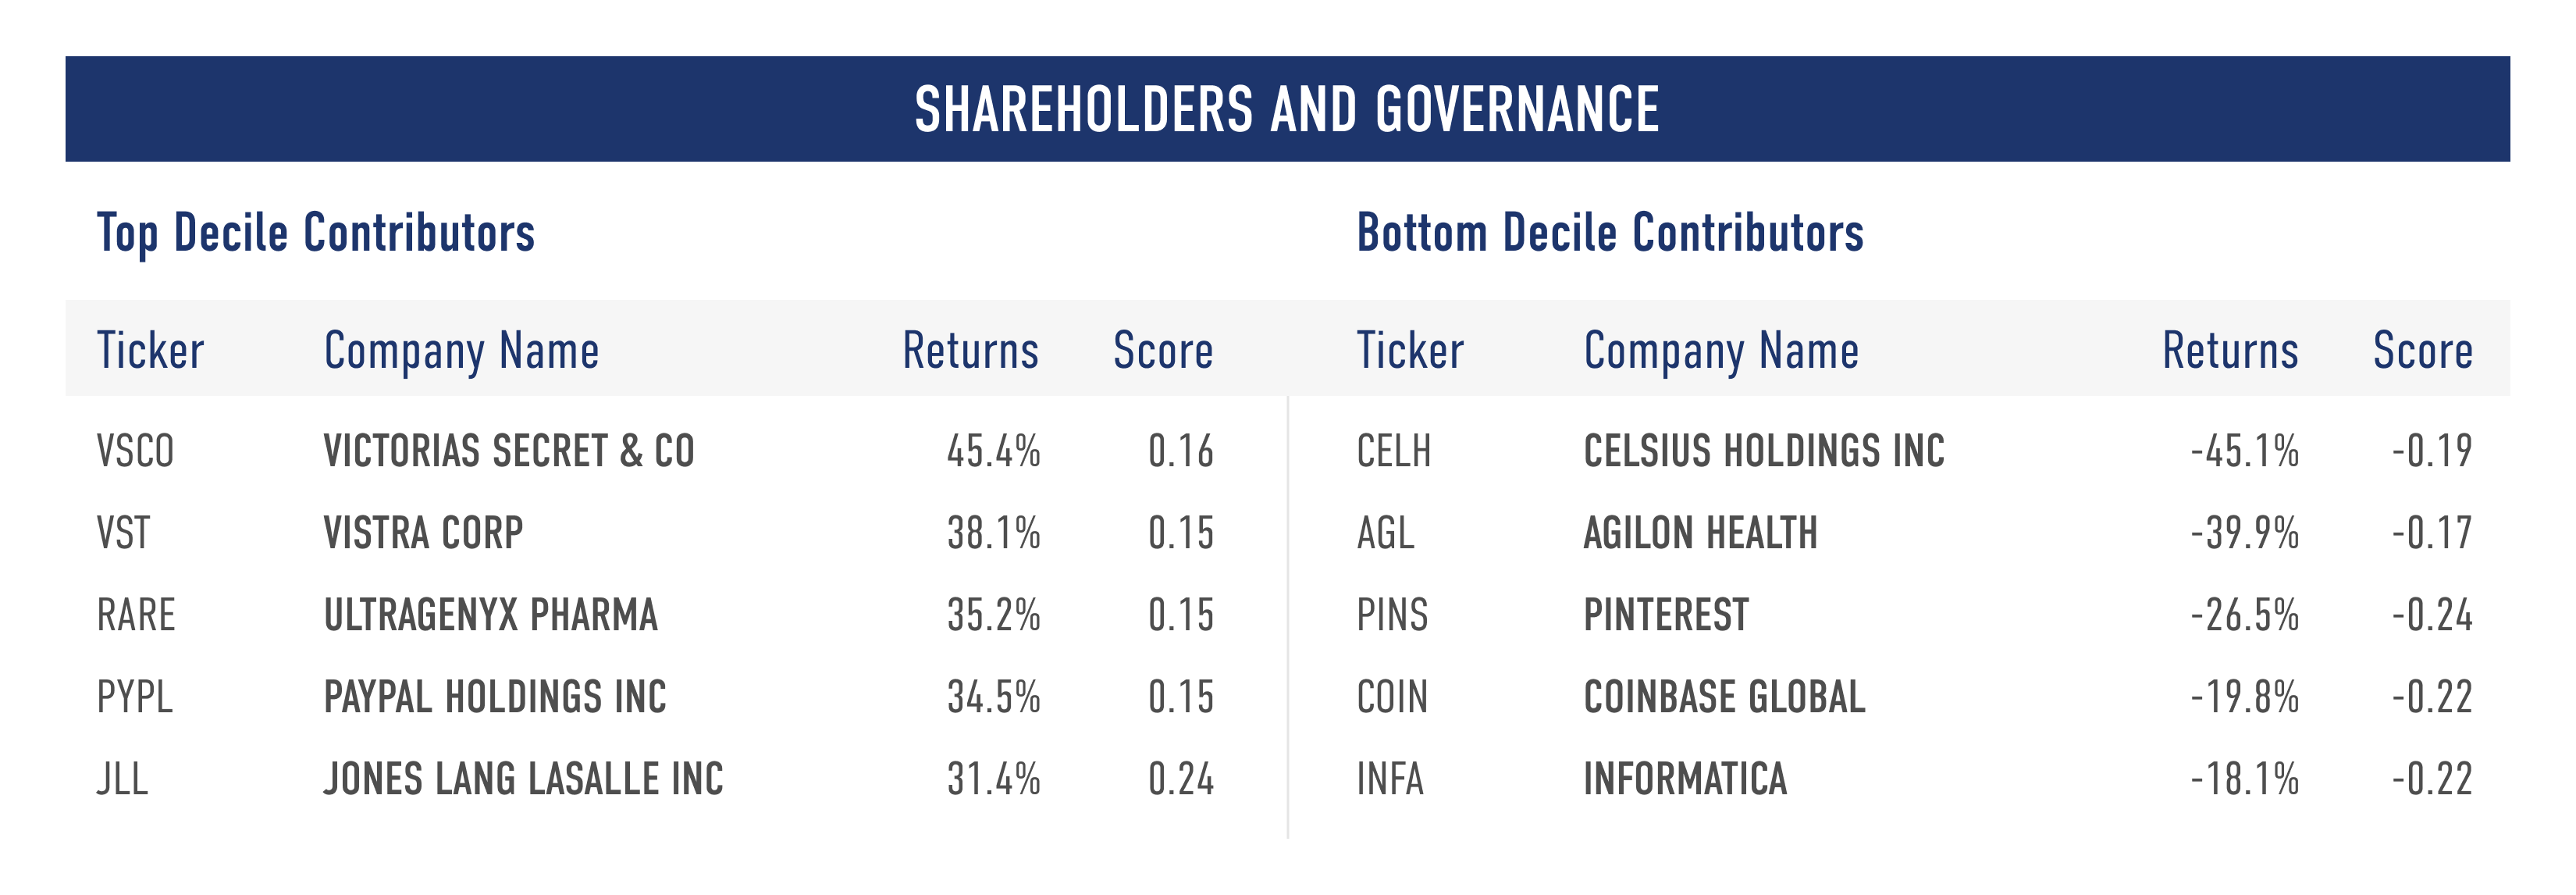
Shown below are the top and bottom five contributors to the top decile (D1), the best-ranked companies as measured by their Shareholders and Governance score, and the bottom decile (D10), the lowest-ranked companies as measured by their Shareholders and Governance score.
Customers
The Customers stakeholder measures a company across four Issues:
- Customer Privacy
- Customer Treatment
- Transparent Communication
- Beneficial Products

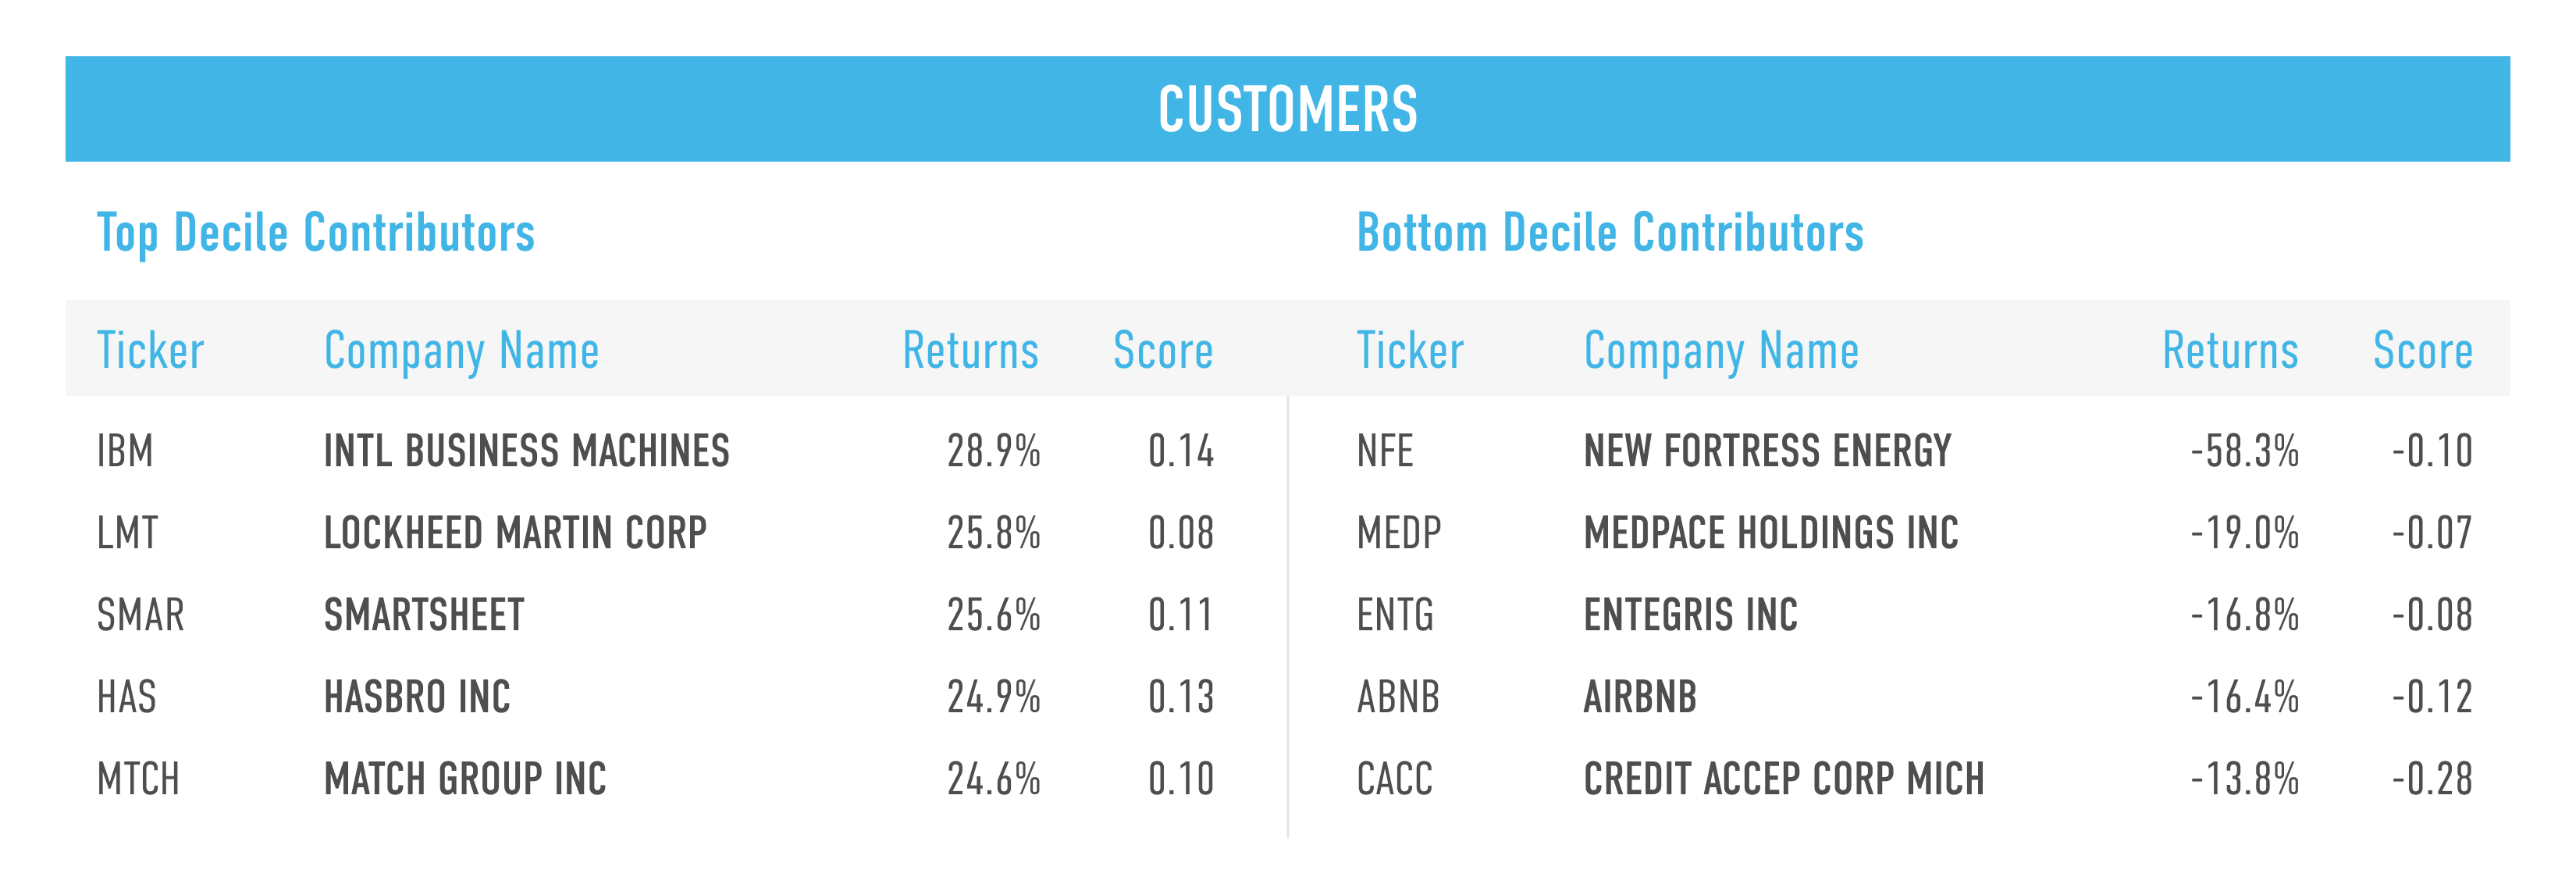
In Q3 2024, all four Customer Issues delivered negative performance. Customer Treatment was the weakest performer followed by Beneficial Products.
Shown below are the top and bottom five contributors to the top decile (D1), the best-ranked companies as measured by their Customers score, and the bottom decile (D10), the lowest-ranked names as measured by their Customers score.
Environment
The Environment stakeholder measures a company across four Issues:
- Sustainable Materials
- Pollution Reduction
- Climate Change
- Resource Efficiency
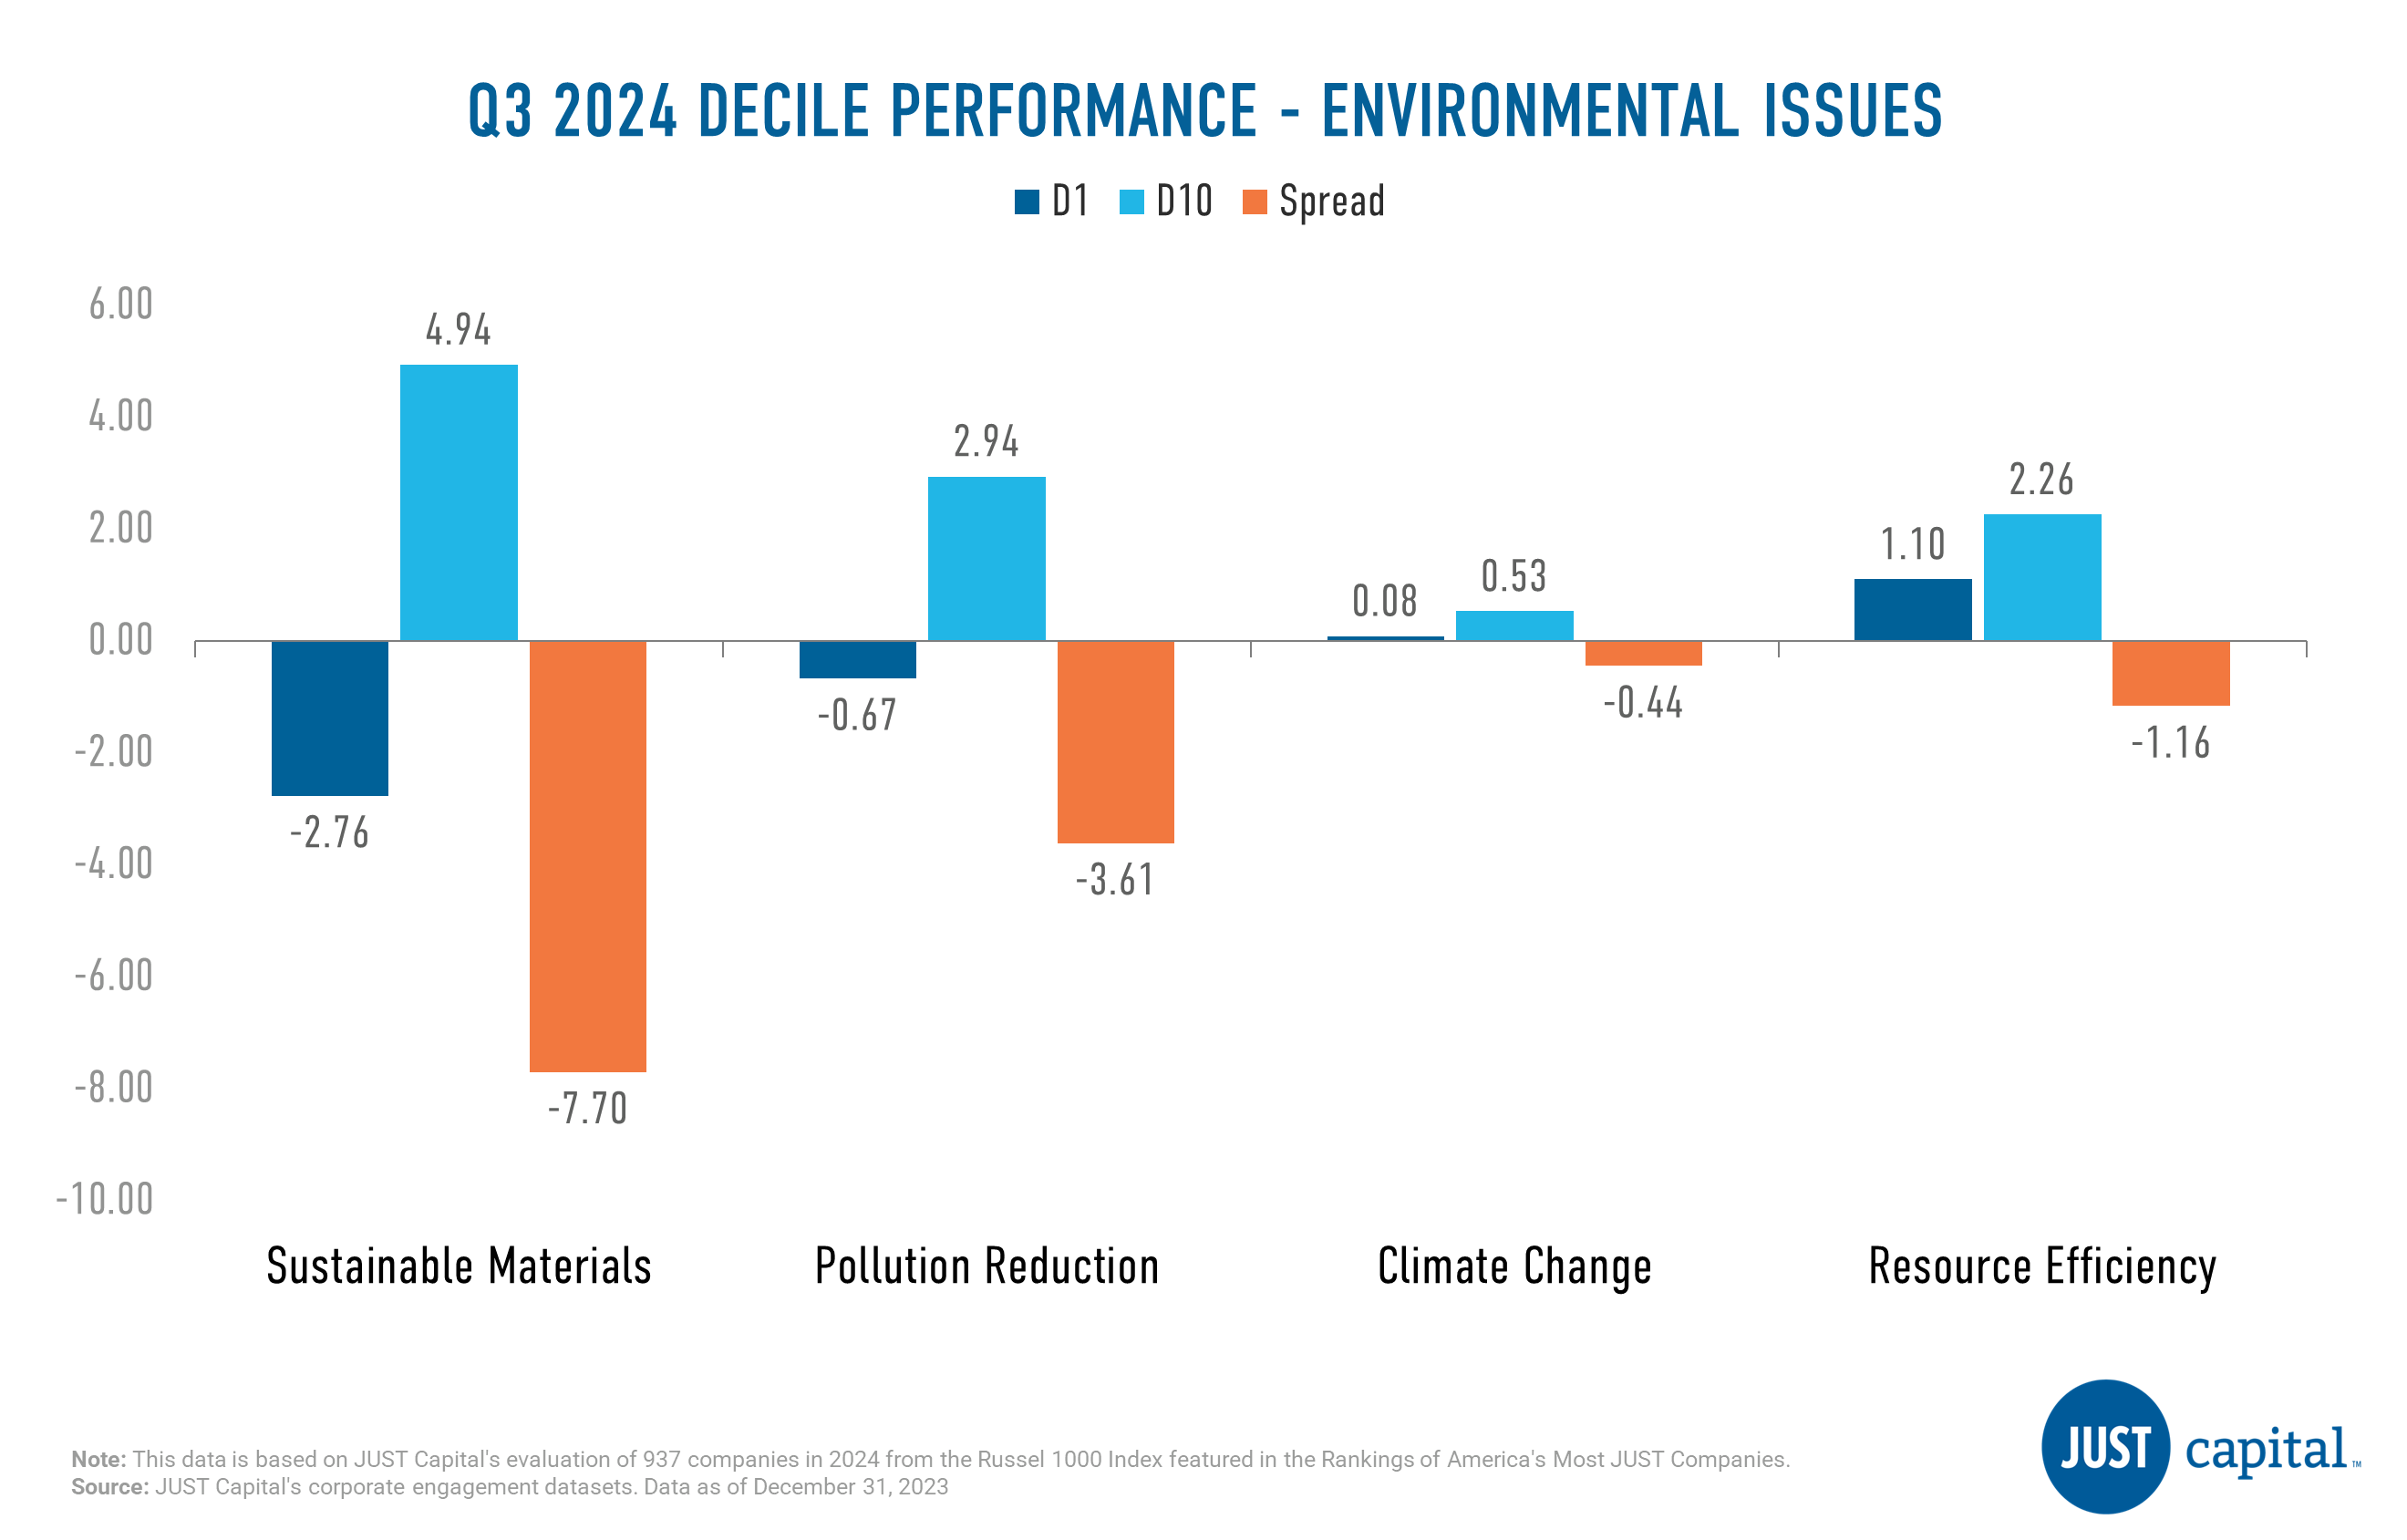
In Q3 2024, we saw all four Environmental issues deliver negative performance. Sustainable Materials was the worst performing issue within Environment stakeholder this quarter.
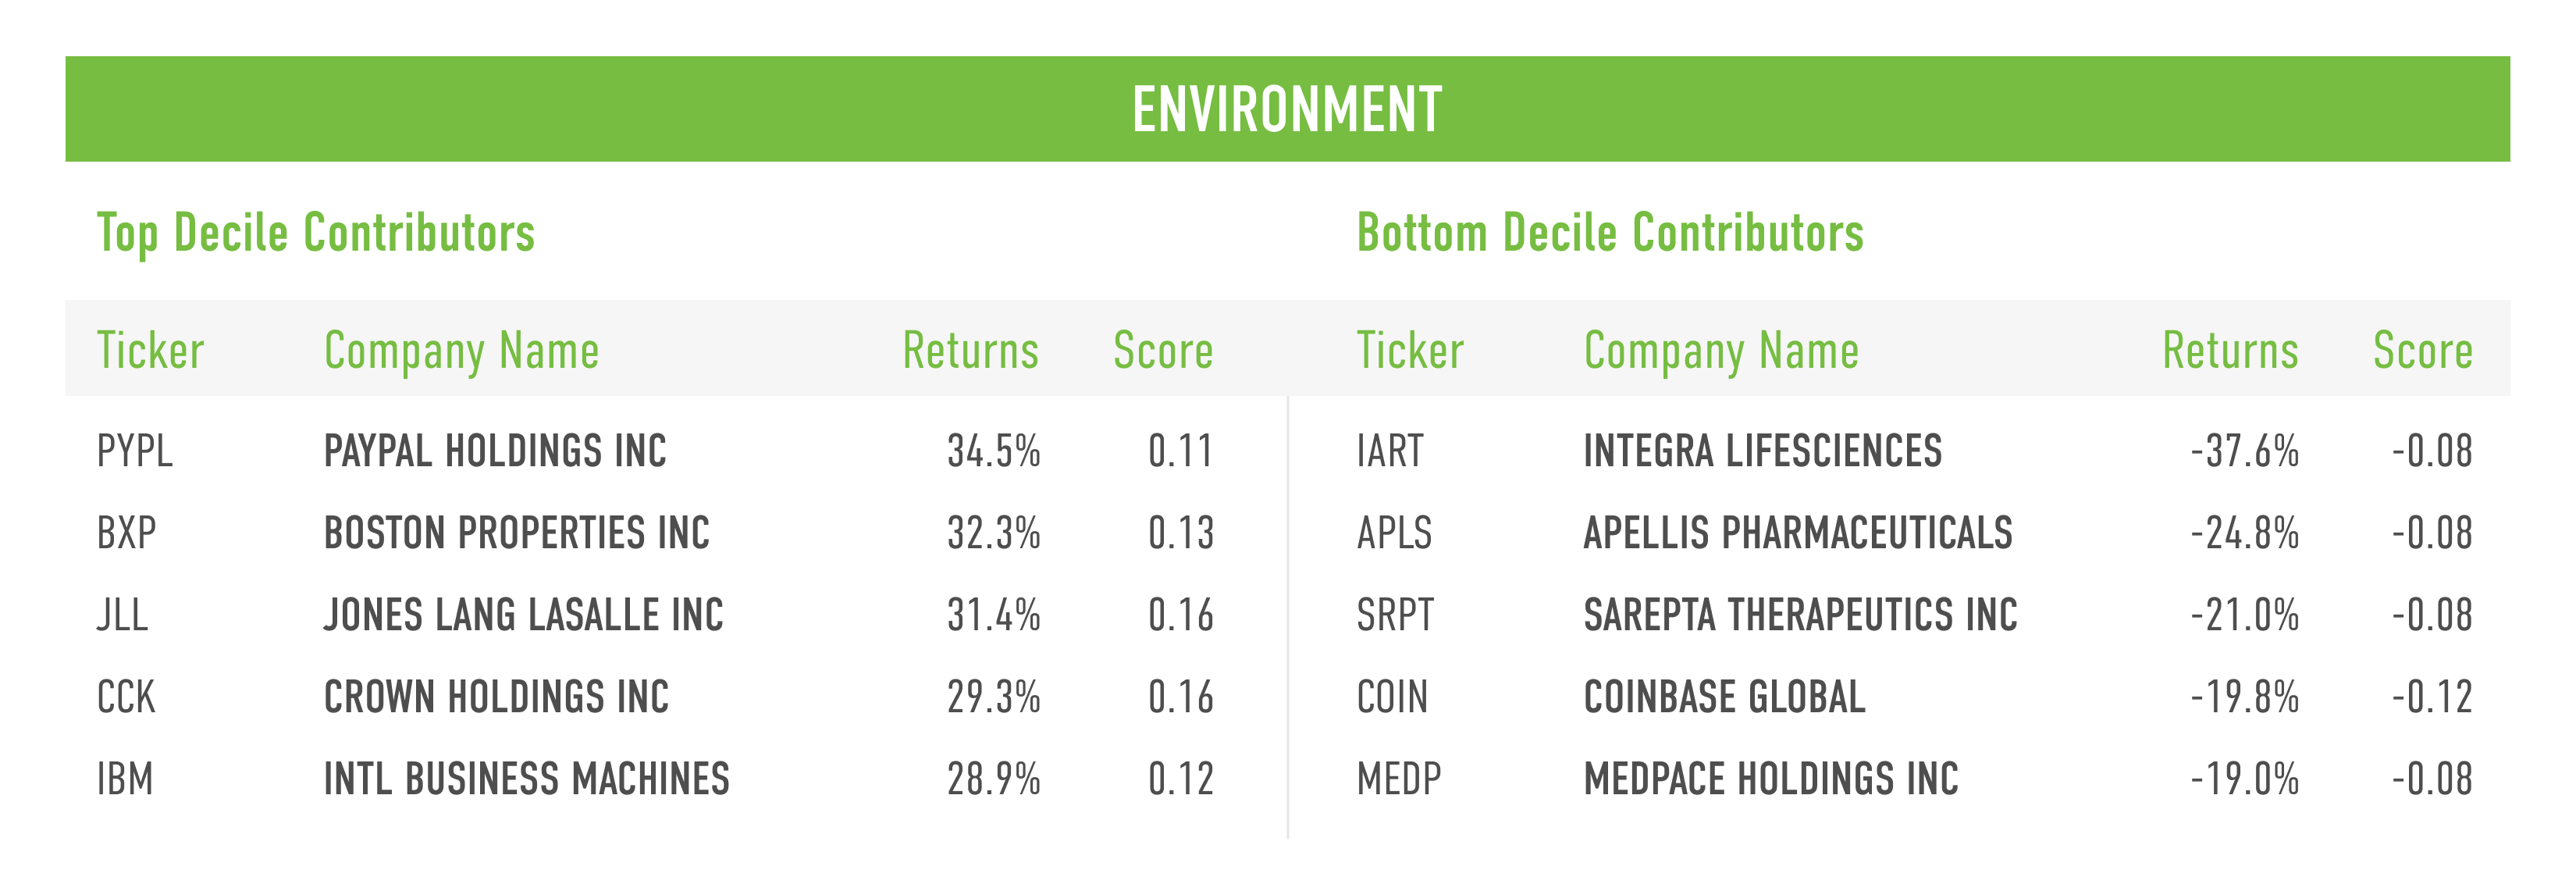
Shown below are the top and bottom five contributors to the top decile (D1), the best-ranked companies as measured by their Environment score, and the bottom decile (D10), the lowest-ranked companies as measured by their Environment score.
Appendix
Computation Methodology
We monitor the performance of these stakeholders and Issues on a long-short basis. The long and short portfolios are selected based on the factor scores as the top and bottom deciles within the universe of companies we track in the Russell 1000. Top decile (D1) companies are those that rank highest based on the factor score, and bottom decile (D10) companies are those that rank lowest based on the factor score.
D1 Performance is computed as
(Equally weighted average of returns of stocks in D1 bucket) – (Equally weighted average of returns of all stocks within the Universe)
D10 Performance is computed as
(Equally weighted average of returns of stocks in D10 bucket) – (Equally weighted average of returns of all stocks within the Universe)
Spread is computed as
D1 Performance – D10 Performance