JUST Report
JUST Capital’s Quarterly Review of Stakeholder Performance – Q2 2024
- More Reports
- View all JUST Reports
In the second quarter of 2024, global equity prices continued their robust performance, contributing to an impressive one-year rebound. The S&P 500 Index rose by 4.3% during this period, though many segments of the domestic stock market, including mid and small-cap indices, lagged behind and declined. Among large-cap stocks, the average stock fell by 2.6%, as indicated by the equal-weighted version of the S&P 500. The quarter experienced fluctuations, with April seeing a downturn that reversed some Q1 gains, but a rebound in May led the S&P 500 to set multiple new all-time highs. The quarter concluded with strong stock market gains, fueled by robust company earnings and easing inflation, elevating the S&P 500’s year-to-date performance to 15.3%.
The strong performance of the S&P 500 was primarily driven by the Information Technology and Communication Services sectors, with ongoing enthusiasm around AI boosting related companies amid strong earnings and optimistic outlook statements. The Information Technology sector alone accounted for 95% of the Index’s gain, with NVIDIA leading the charge and contributing nearly half of the S&P 500’s return. Conversely, cyclical sectors such as Financials, Industrials, Health Care, and Materials were the biggest underperformers.
As of June 30, 2024, our flagship index – the JUST U.S. Large Cap Diversified Index (JULCD) has out-performed the Russell 1000 (Cap-Weighted) benchmark by 1.51% year-to-date and by 13.78% since its inception. Additionally, the JUST 100 (equally weighted index) has outperformed the Russell 1000 (Equally-Weighted) index by 6.65% year-to-date and by 44.77% since its inception.
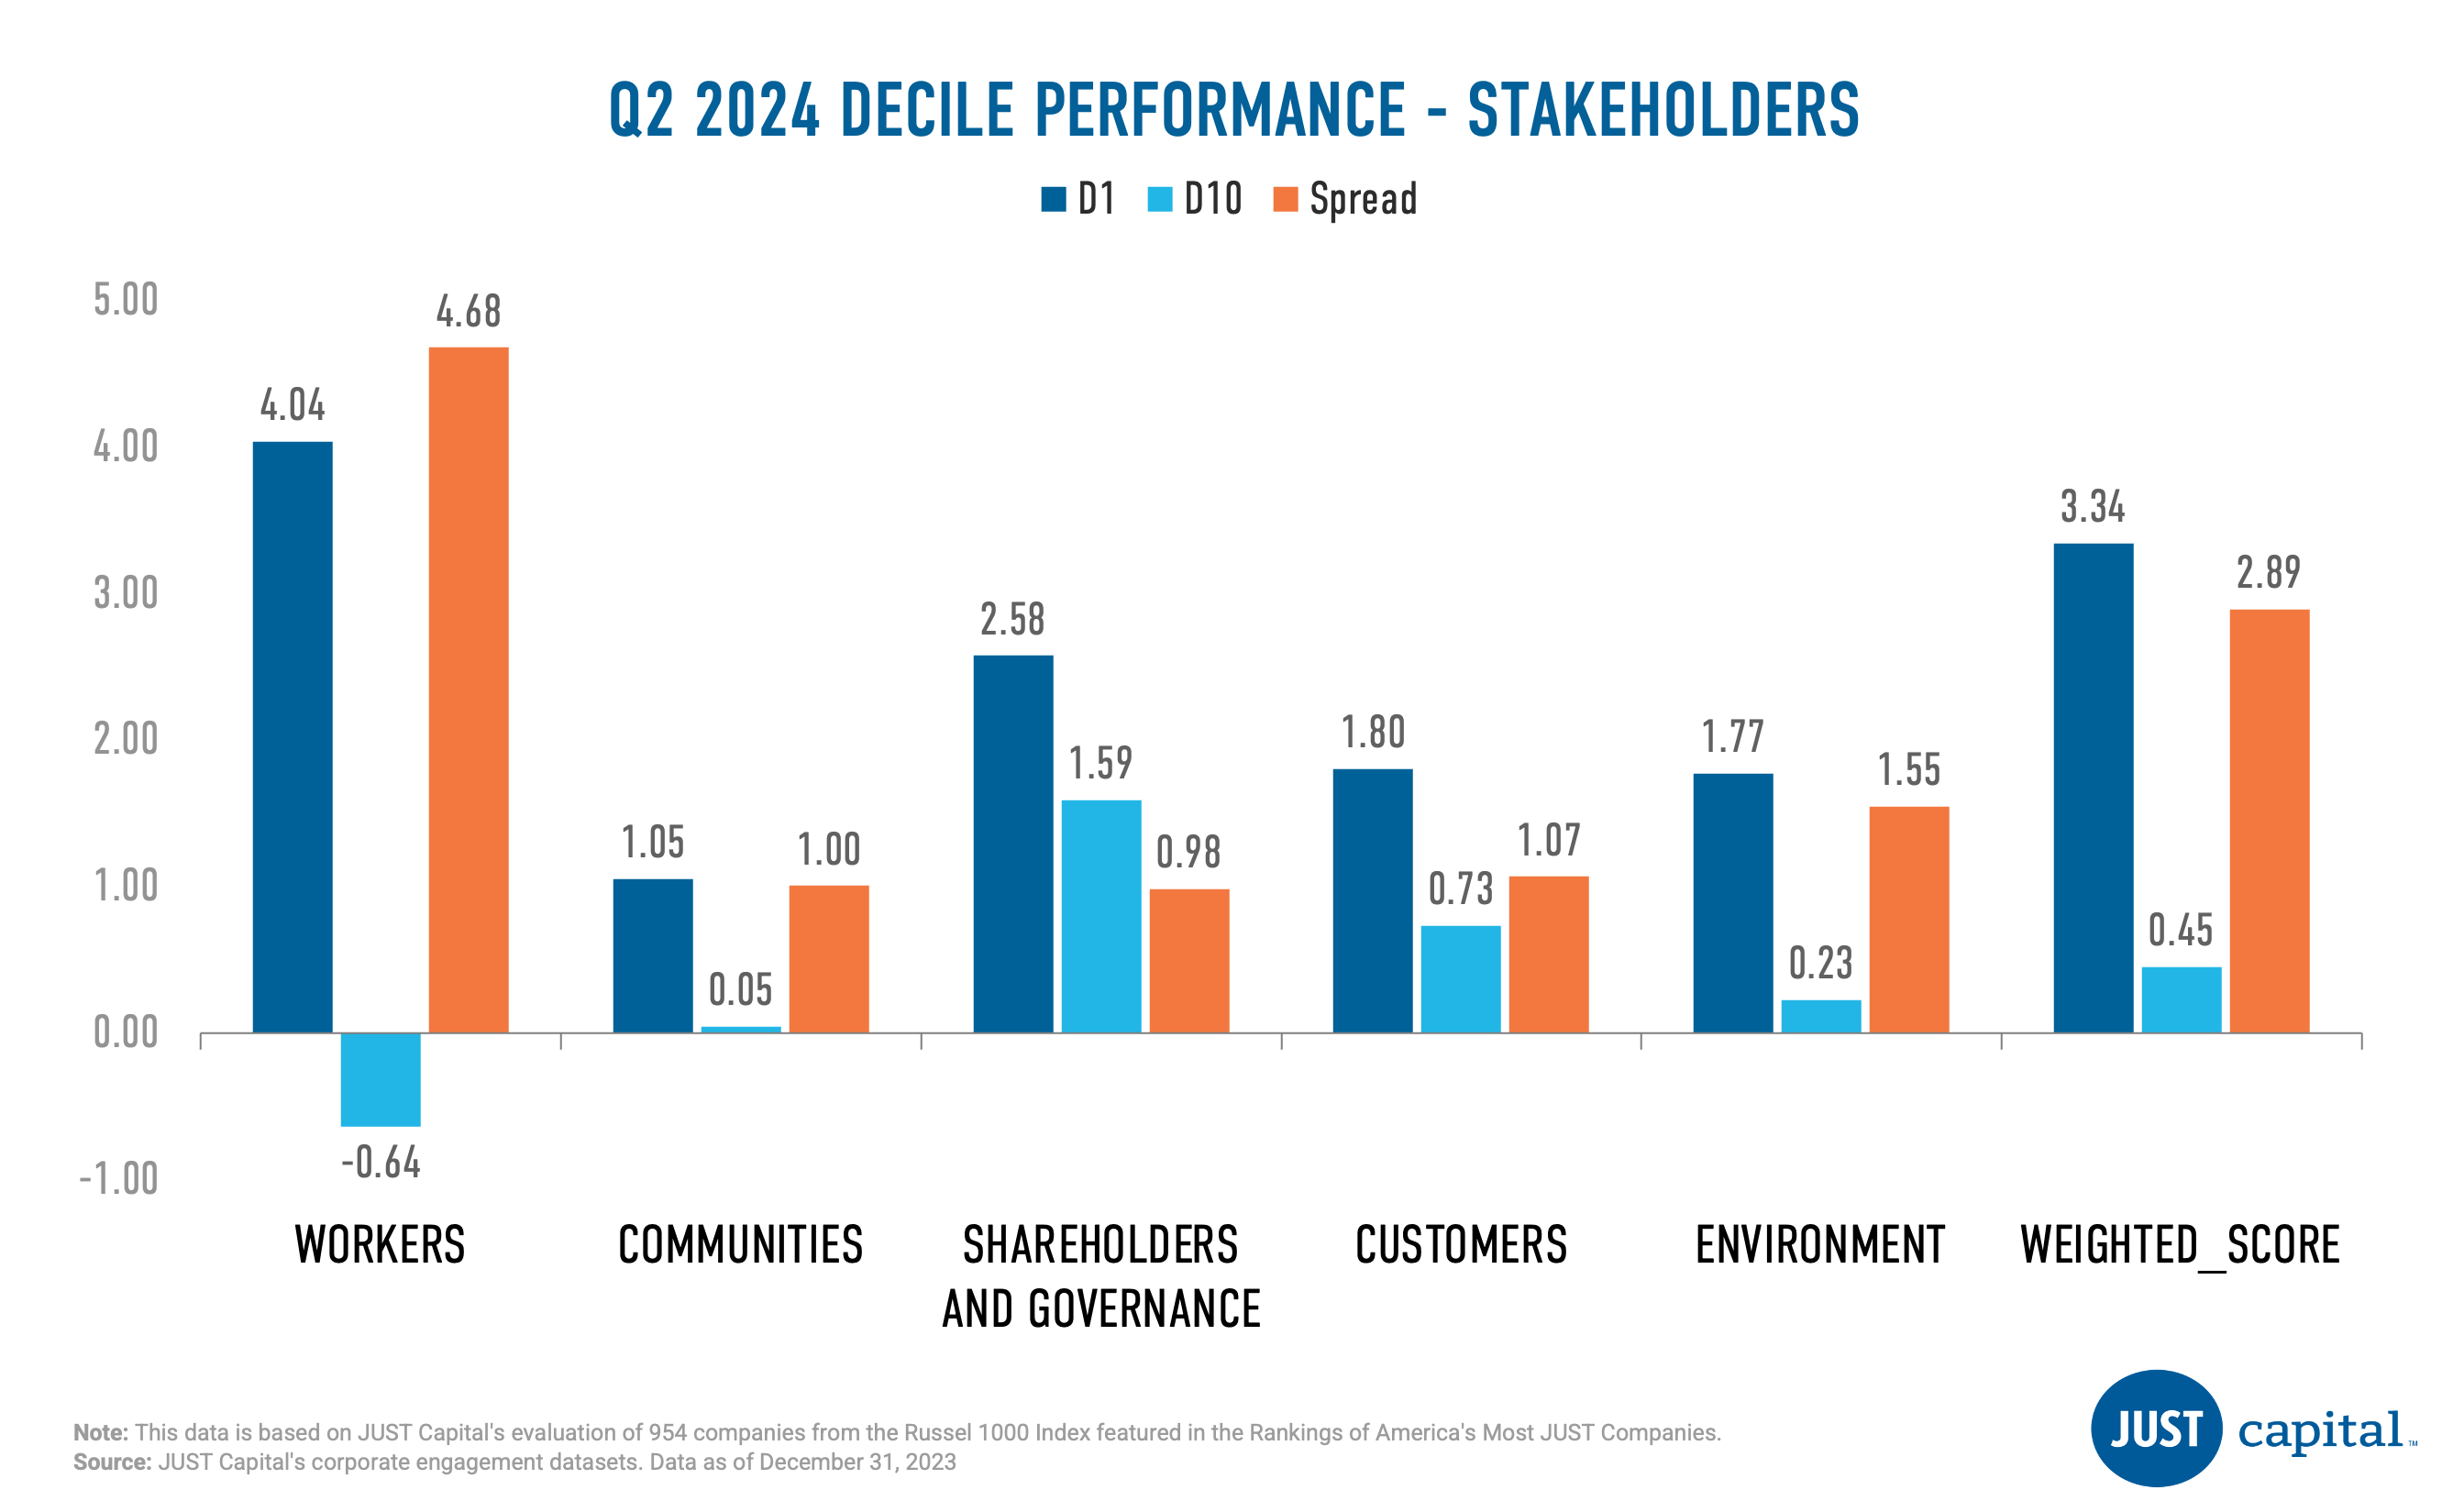
JUST Capital found that all of the five stakeholders we track delivered positive performance in Q2 2024. The Workers stakeholder delivered the strongest performance over this period with a long-short spread of 4.68%. Within the Workers stakeholder, outperformance was driven by both the top and bottom deciles whereas for remaining stakeholders outperformance was driven by top decile.
JUST Capital’s Overall Weighted Score takes into account the 20 core Issues determined through our annual survey research – including paying a living wage, creating a diverse, inclusive workplace, and helping combat climate change – across key business stakeholders: Workers, Communities, Shareholders & Governance, Customers, and Environment. This Overall Weighted Score had a positive long-short spread of 2.89% over the period ending June 28,2024.
Workers
The Workers stakeholder measures a company across five Issues:
- Living Wage
- Health & Safety
- Benefits & Work-Life Balance
- Diversity, Equity, Inclusion
- Workforce Advancement
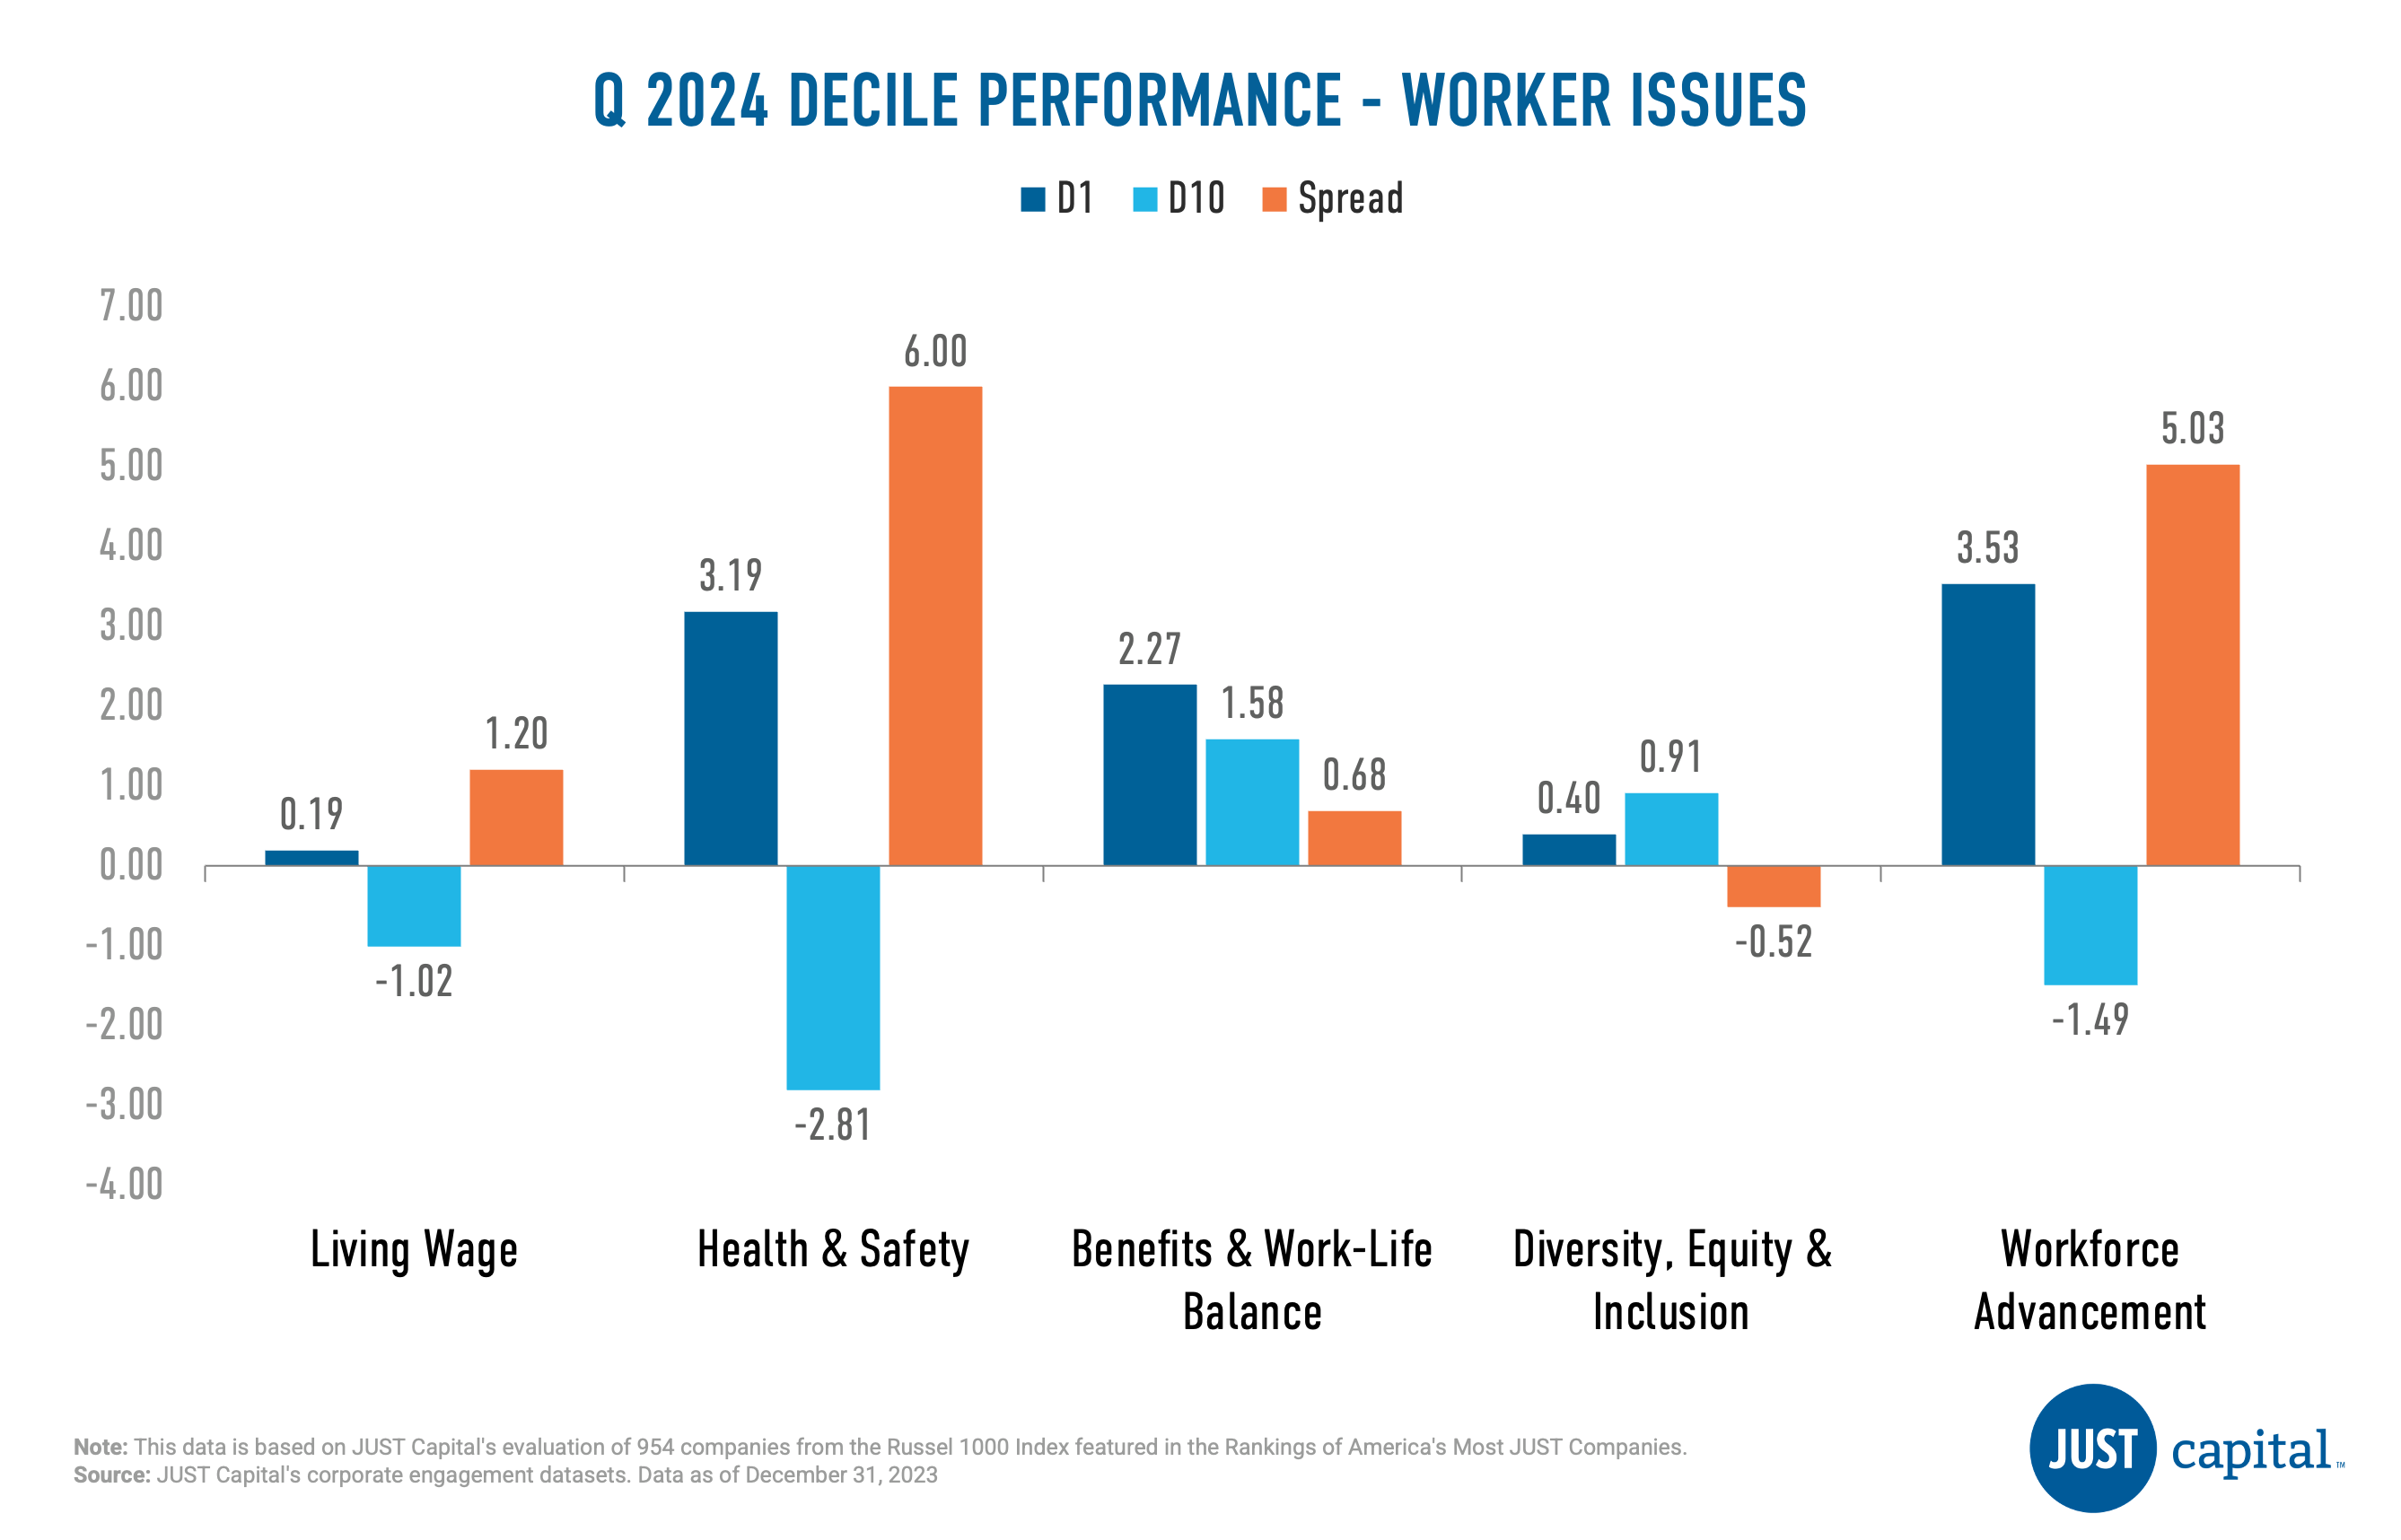
In Q2 2024, we saw four out of five issues deliver positive performance, with the Health & Safety Issue faring the best. Diversity Equity & Inclusion was the weakest performer amongst the Worker issues.
Shown below are the top and bottom five contributors to the top decile (D1), the top-ranked companies as measured by their Workers score, and the bottom decile (D10), the lowest-ranked companies as measured by their Workers score.

Communities
The Communities stakeholder measures a company across four Issues:
- Local Job Creation
- Human Rights
- Community Development
- Community Support
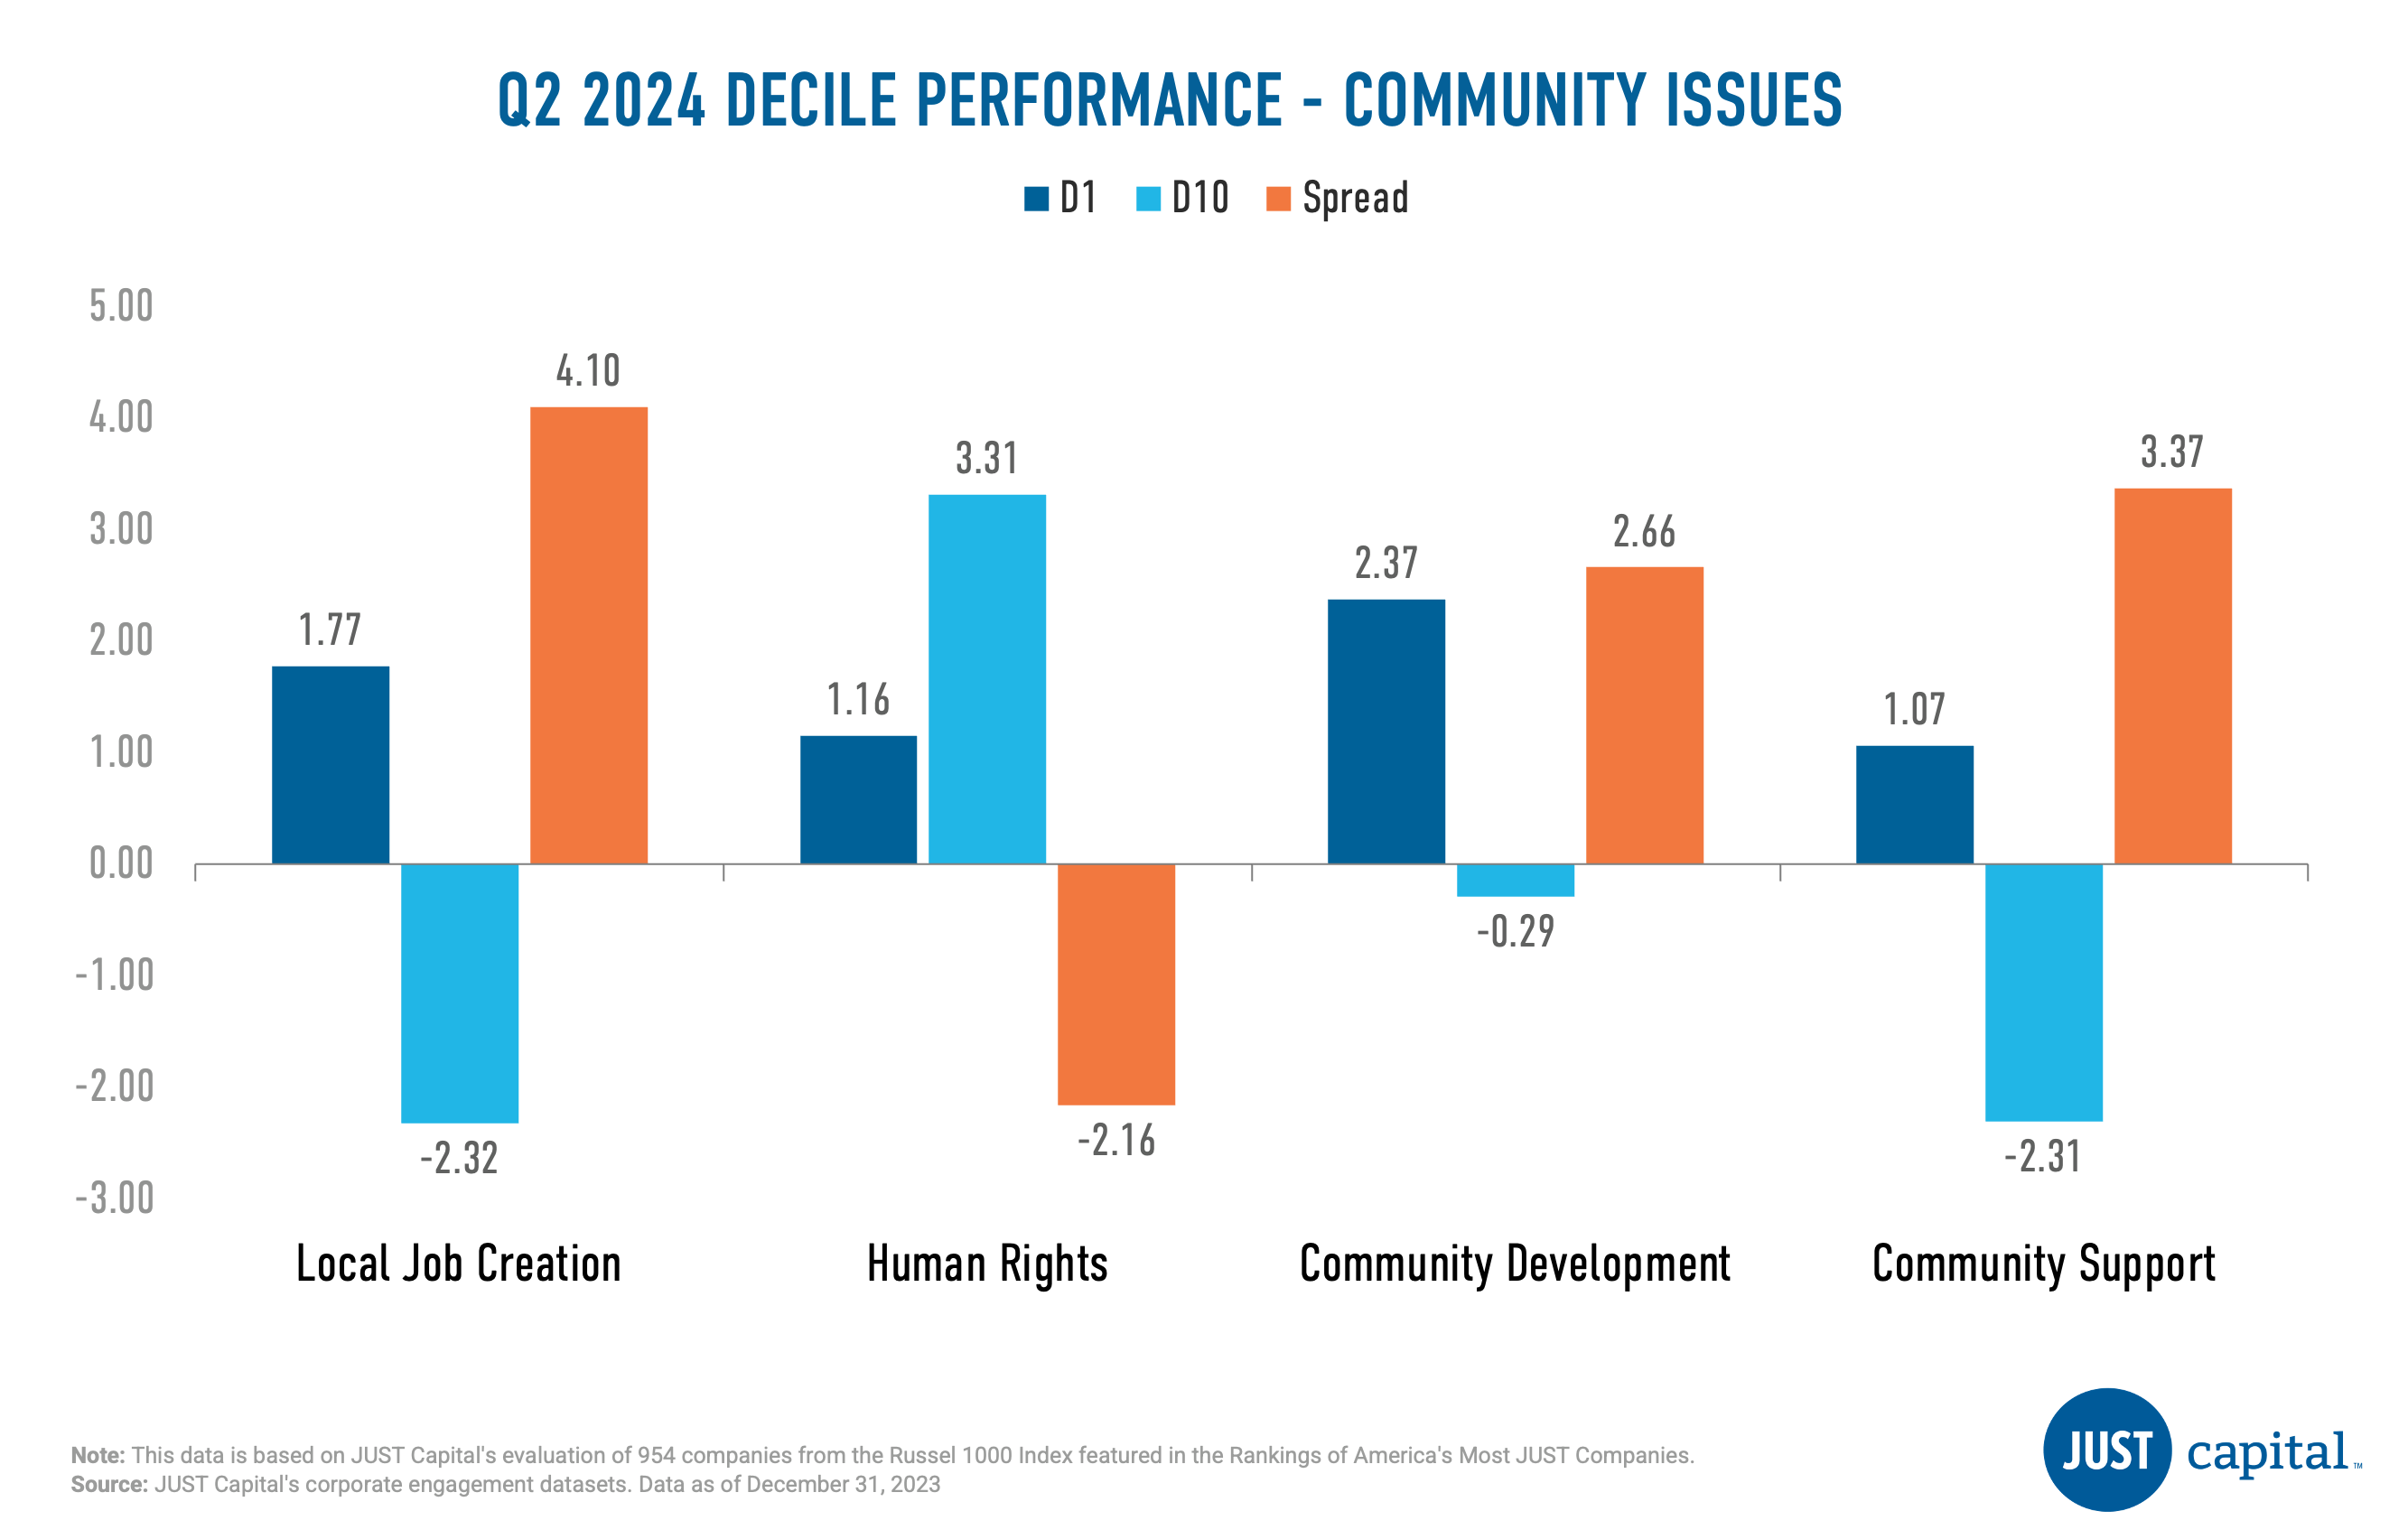
Local Job Creation was the strongest performer followed by Community Support. Human Rights was a negative contributor this quarter.
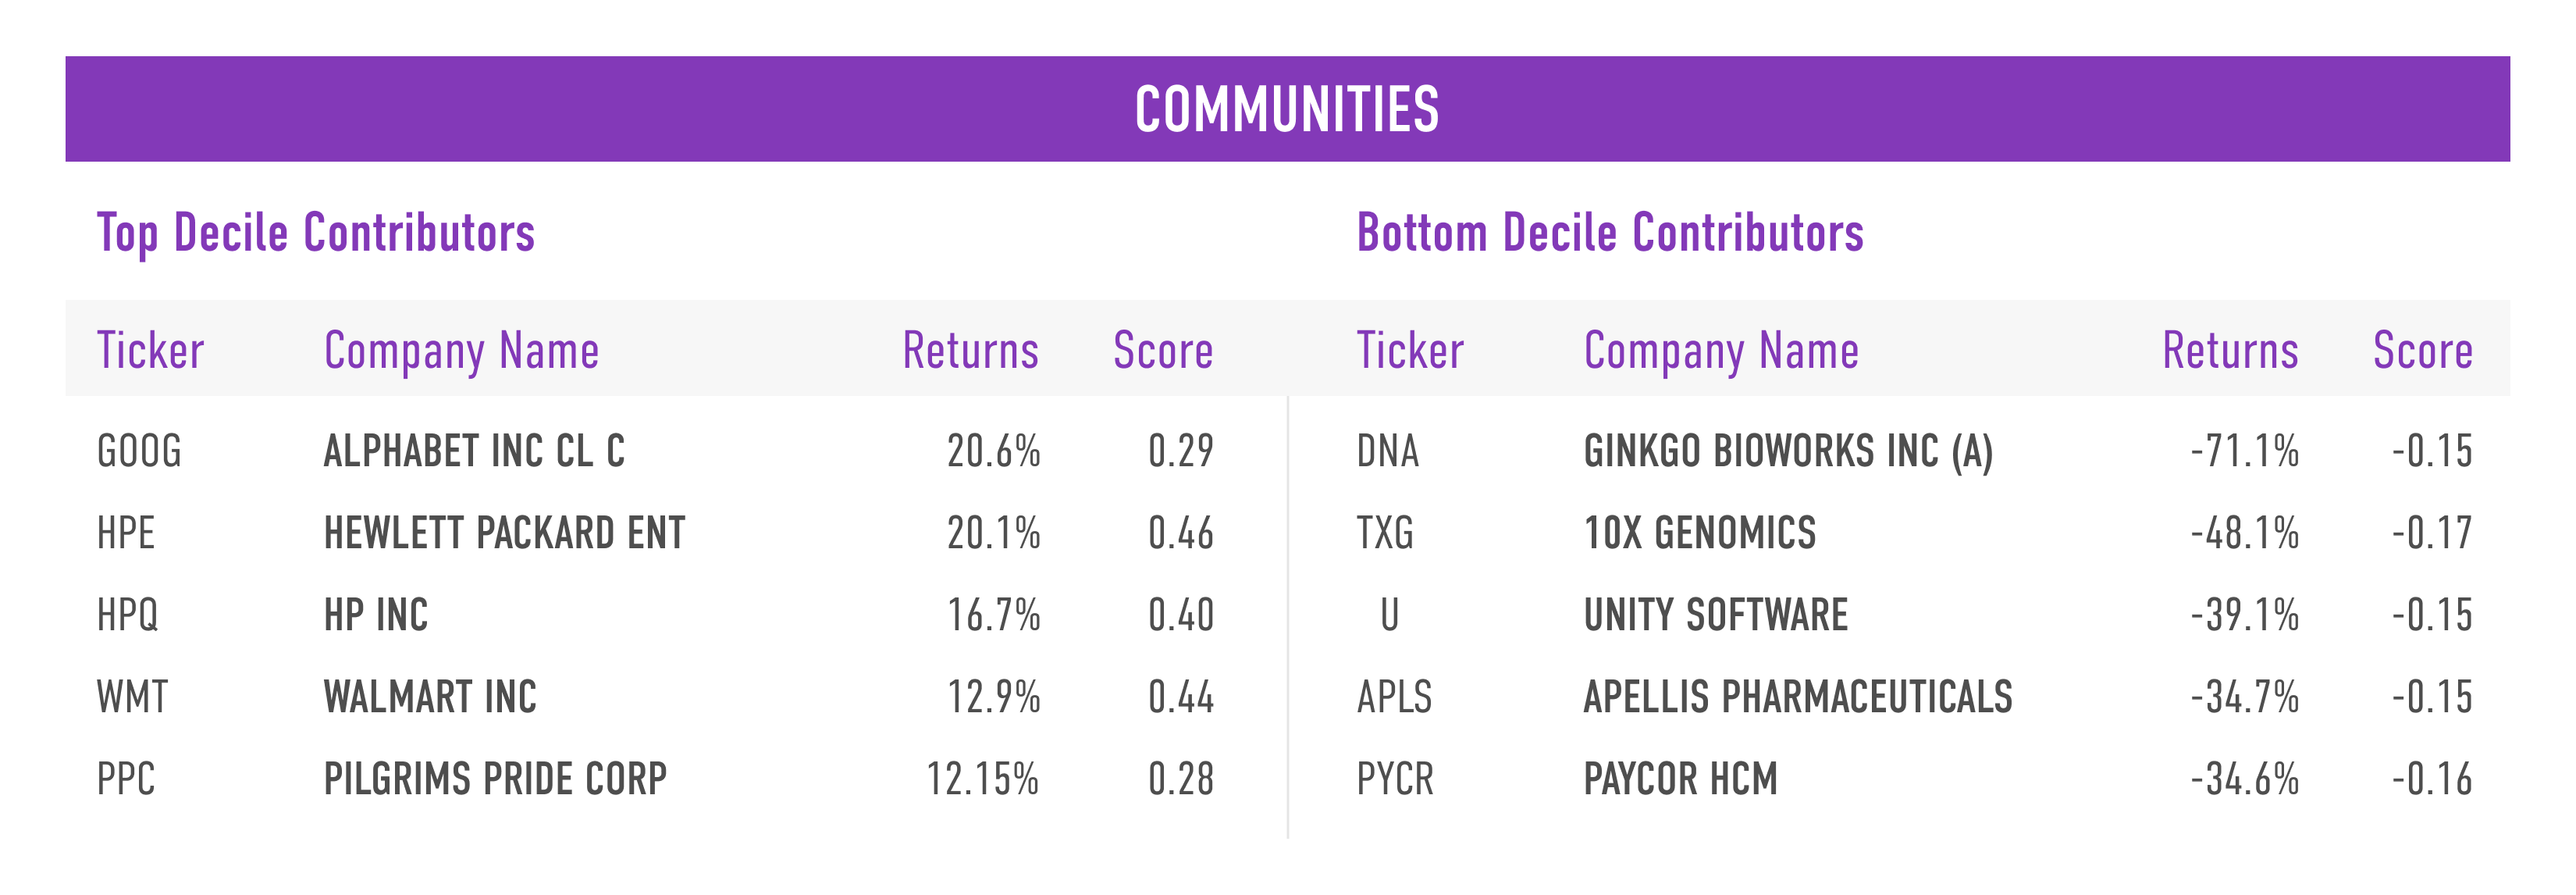
Shown below are the top and bottom five contributors to the top decile (D1), the best-ranked companies as measured by their Communities score, and the bottom decile (D10), the lowest-ranked companies as measured by their Communities score.
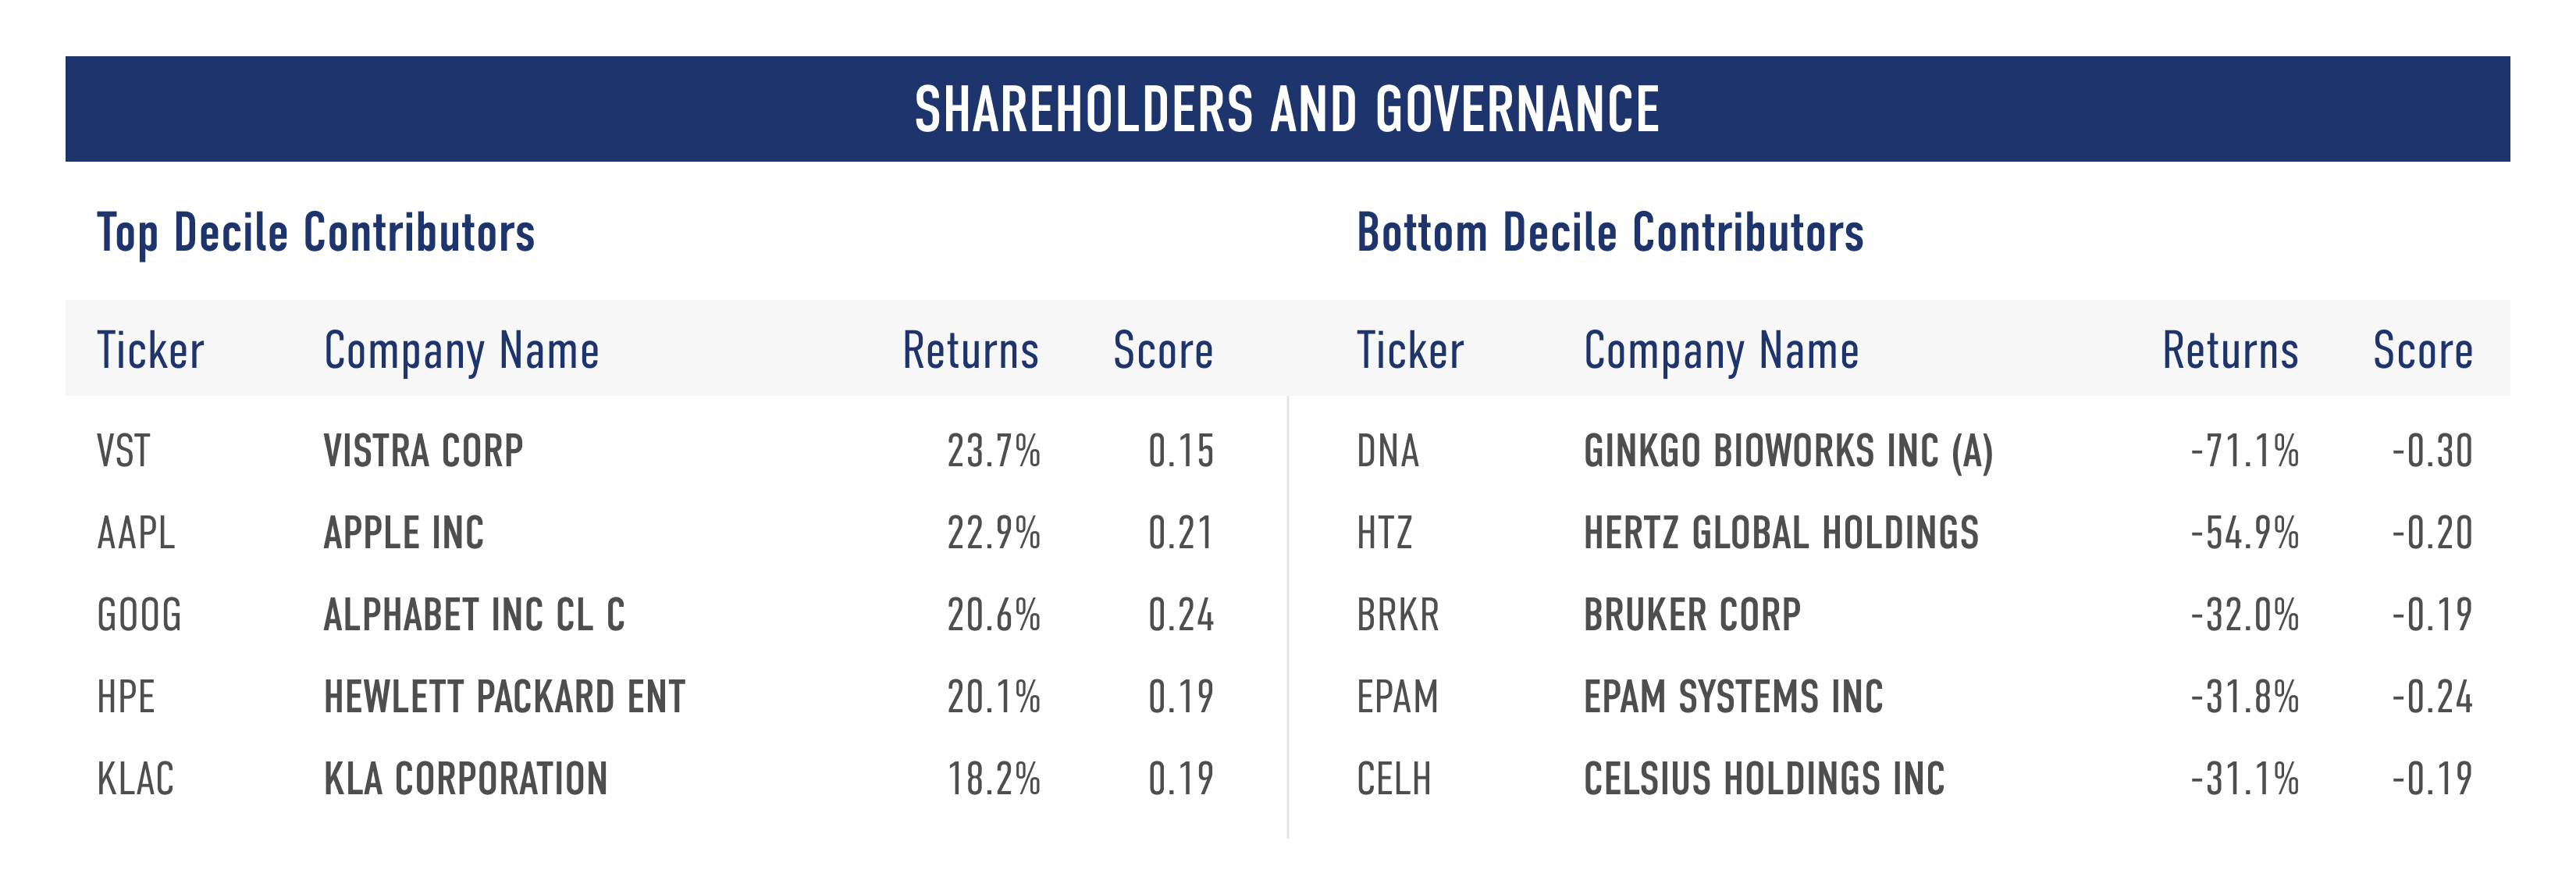
Shareholders and Governance
The Shareholders and Governance stakeholder measures a company across three Issues:
- Accountability to Stakeholders
- Ethical Leadership
- Investor Return
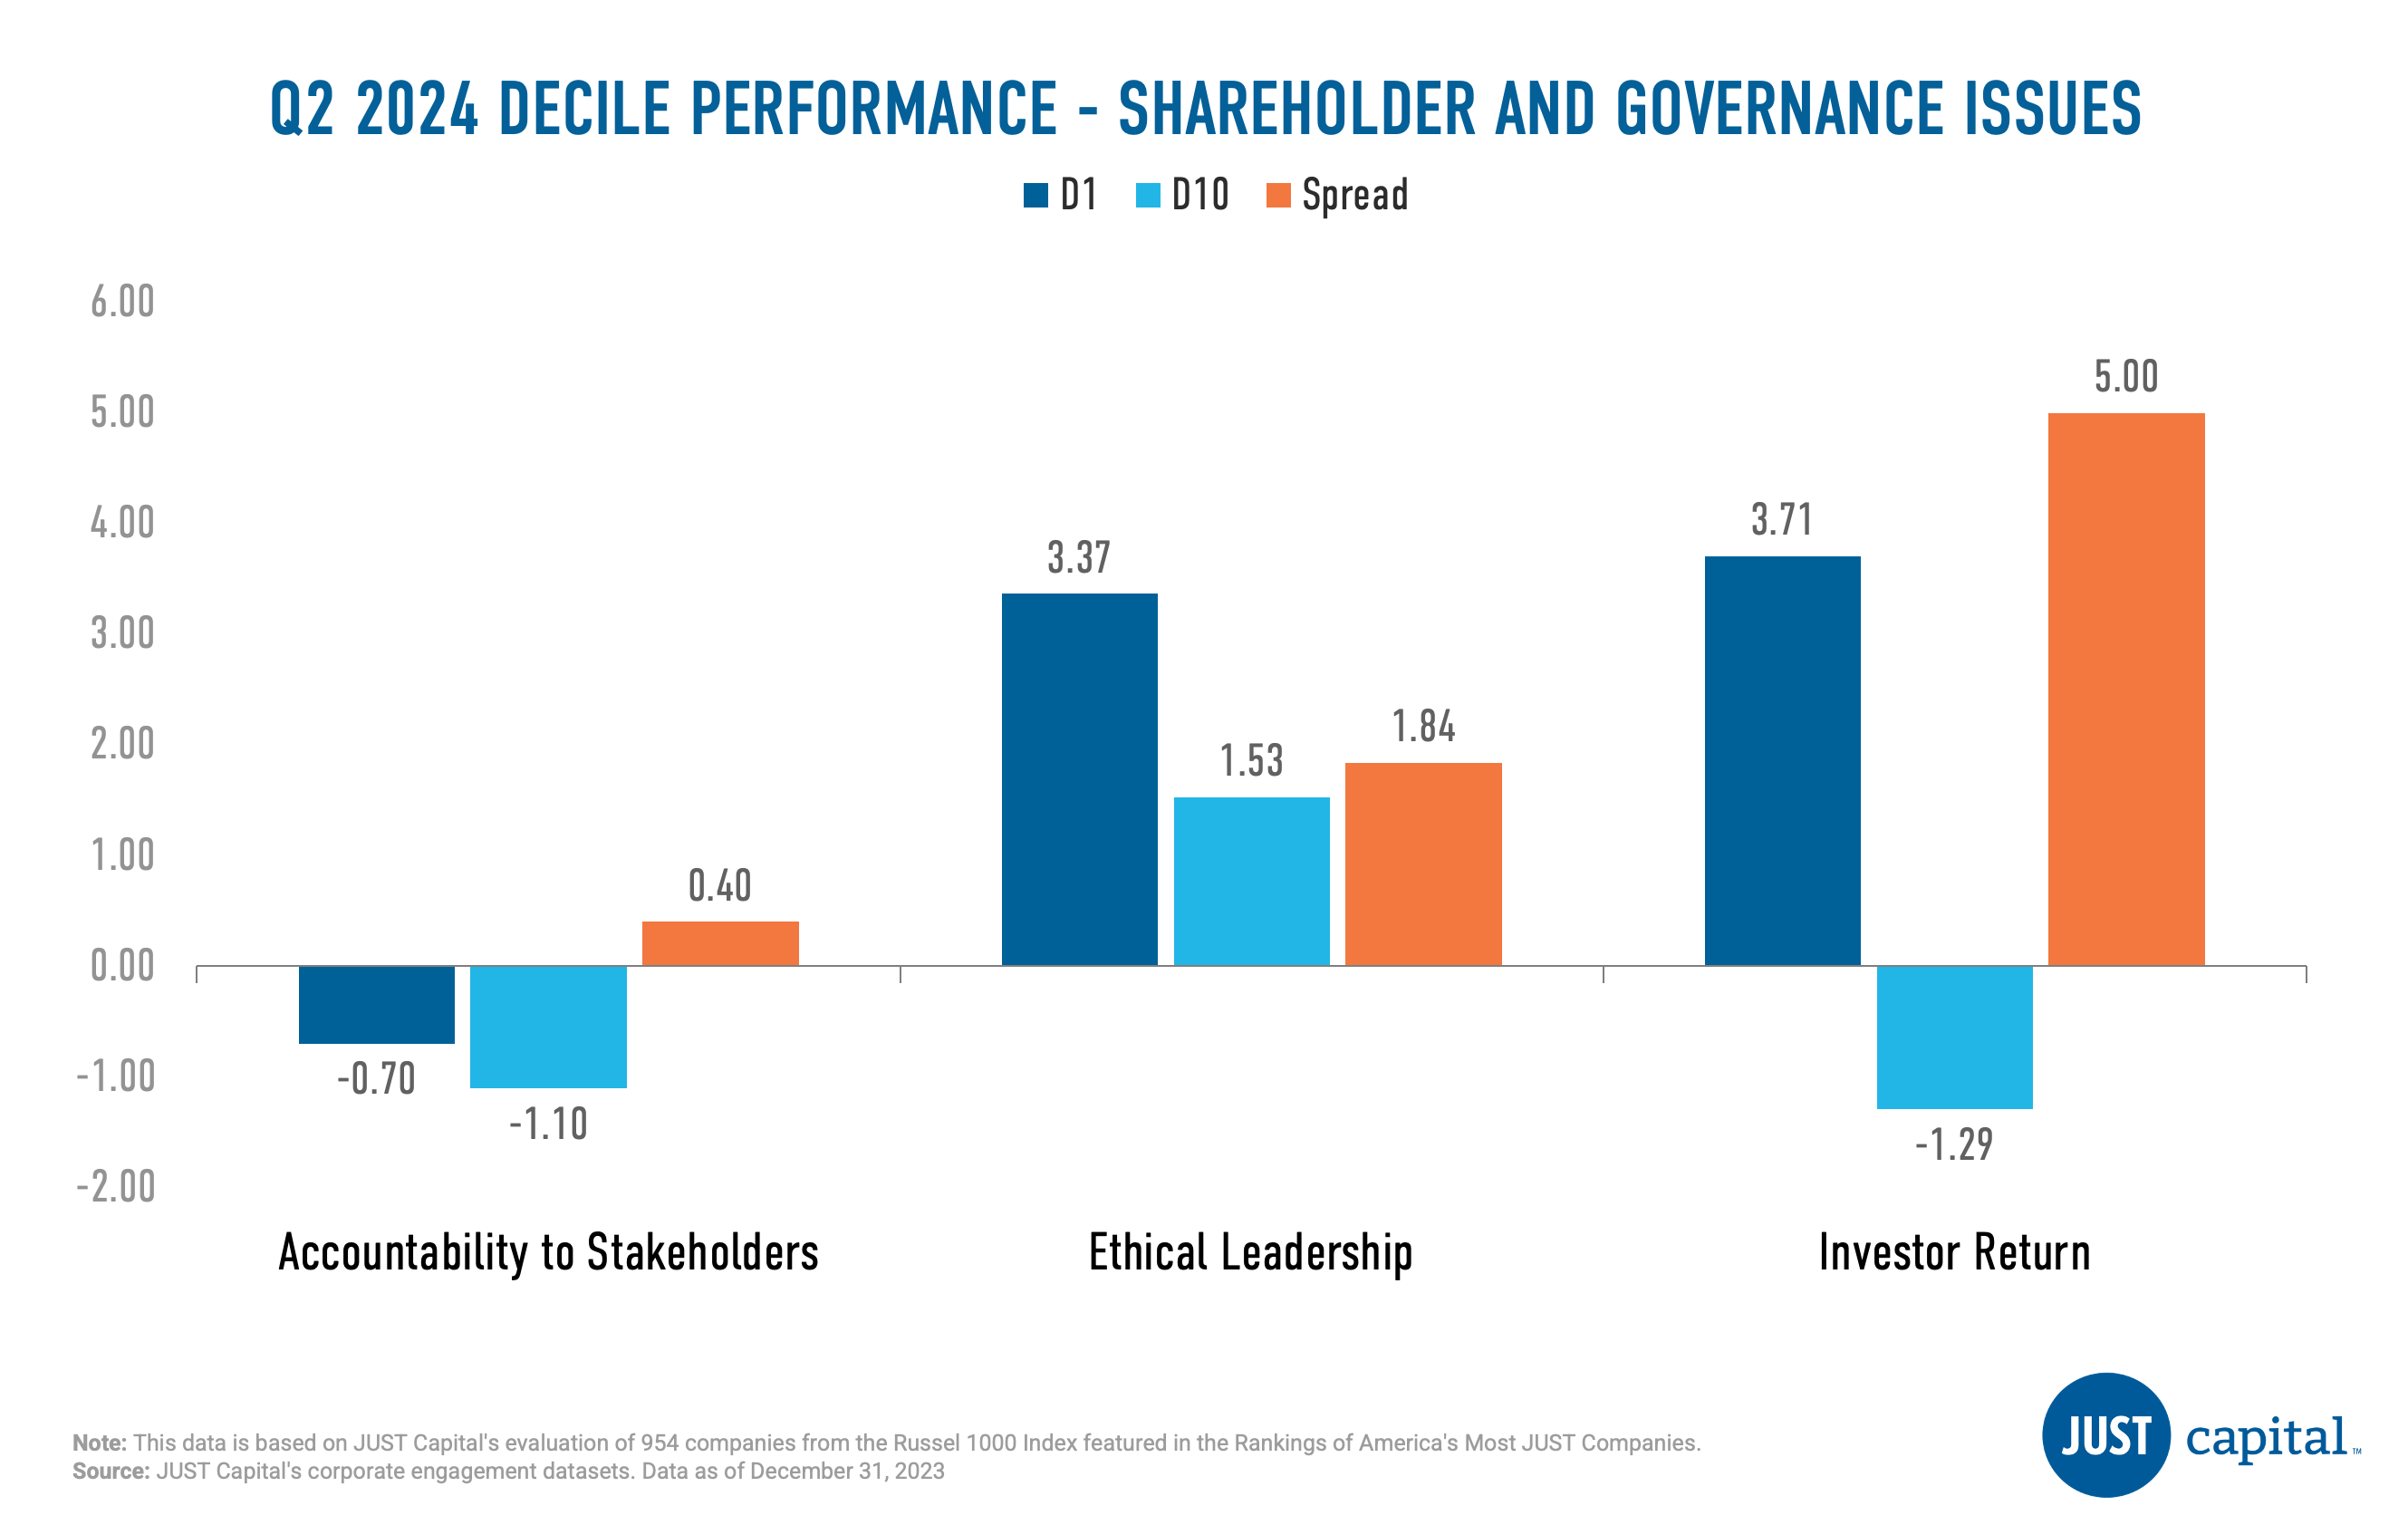
Investor Return Issue was the strongest performer in Q2 with a long-short spread of 5% followed by Ethical Leadership. All issues delivered positive performance in Q2 2024.
Shown below are the top and bottom five contributors to the top decile (D1), the best-ranked companies as measured by their Shareholders and Governance score, and the bottom decile (D10), the lowest-ranked companies as measured by their Shareholders and Governance score.
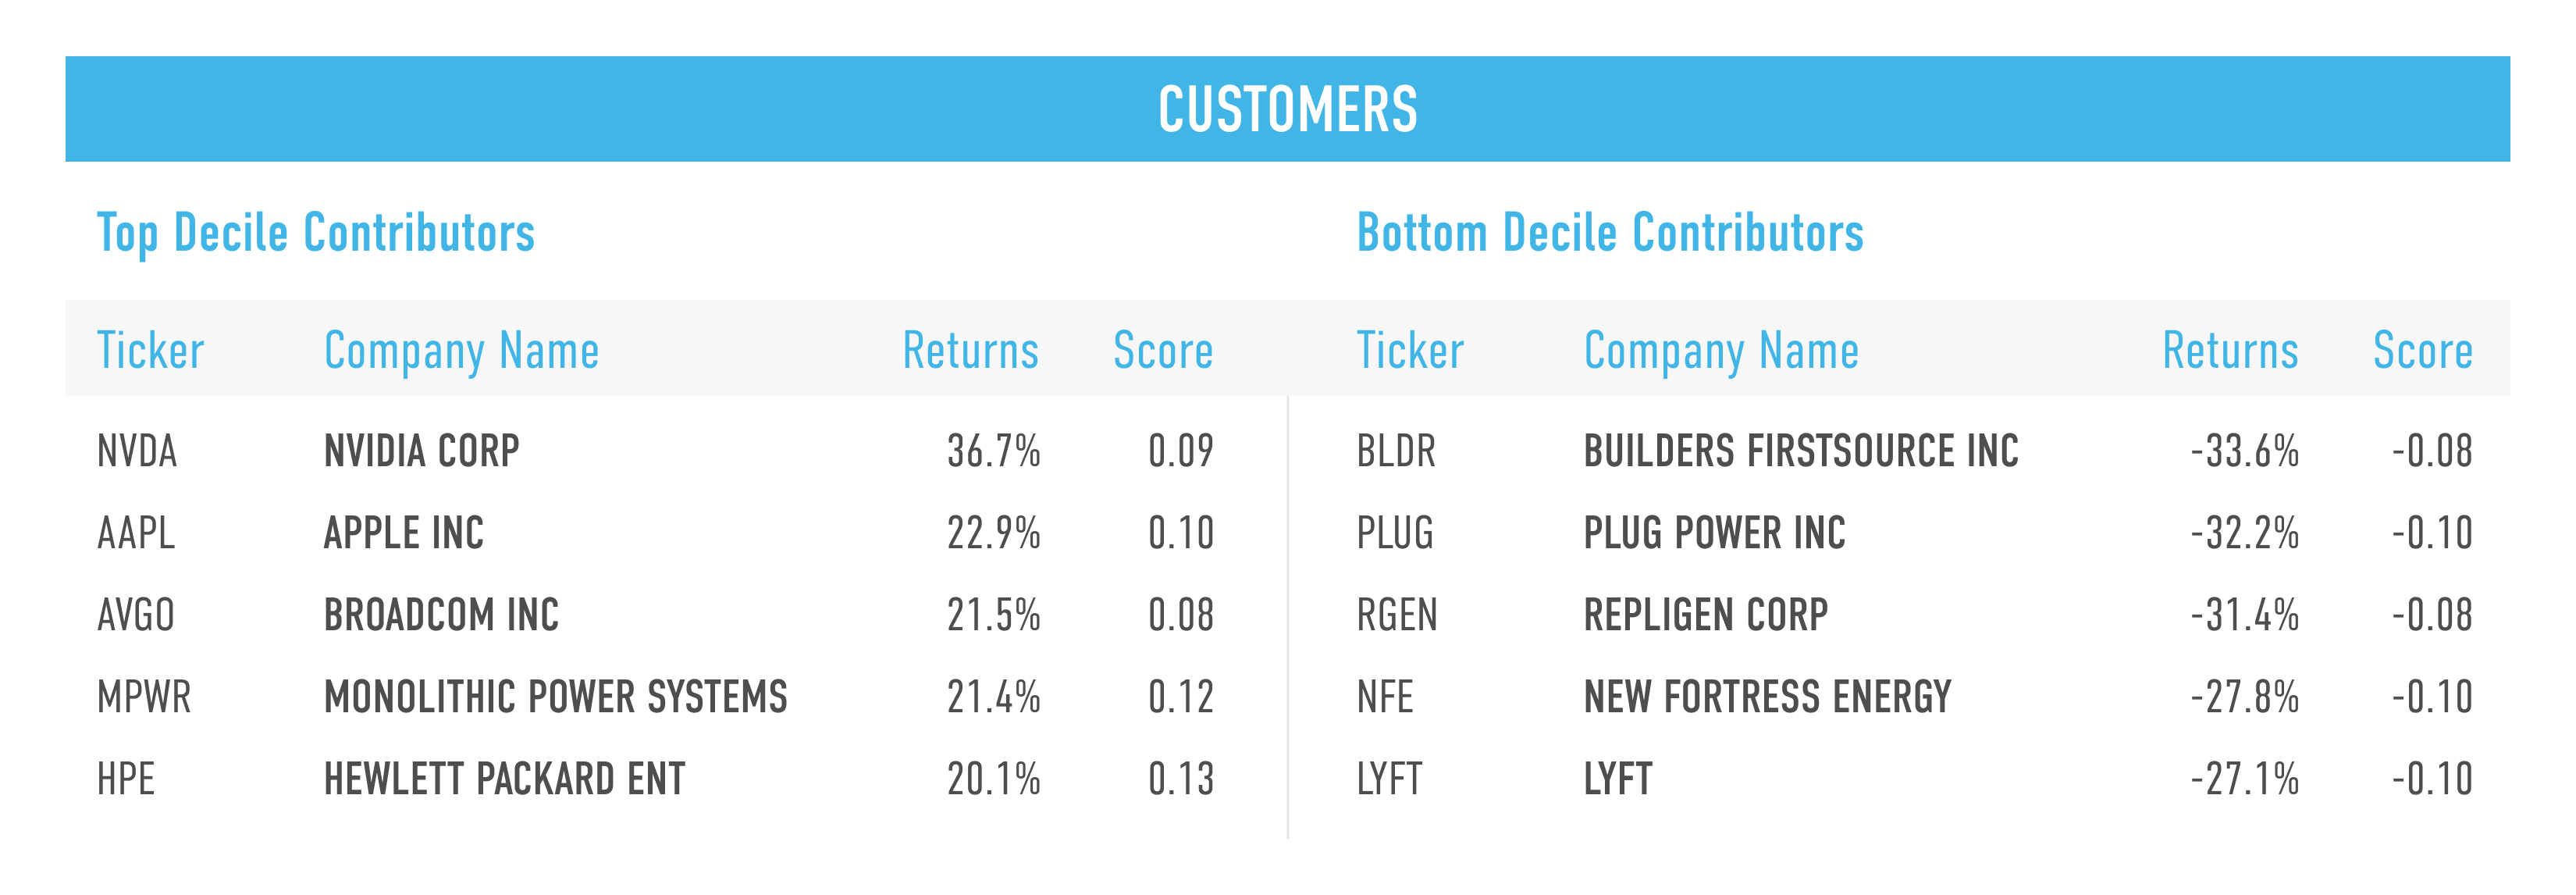
Customers
The Customers stakeholder measures a company across four Issues:
- Customer Privacy
- Customer Treatment
- Transparent Communication
- Beneficial Products
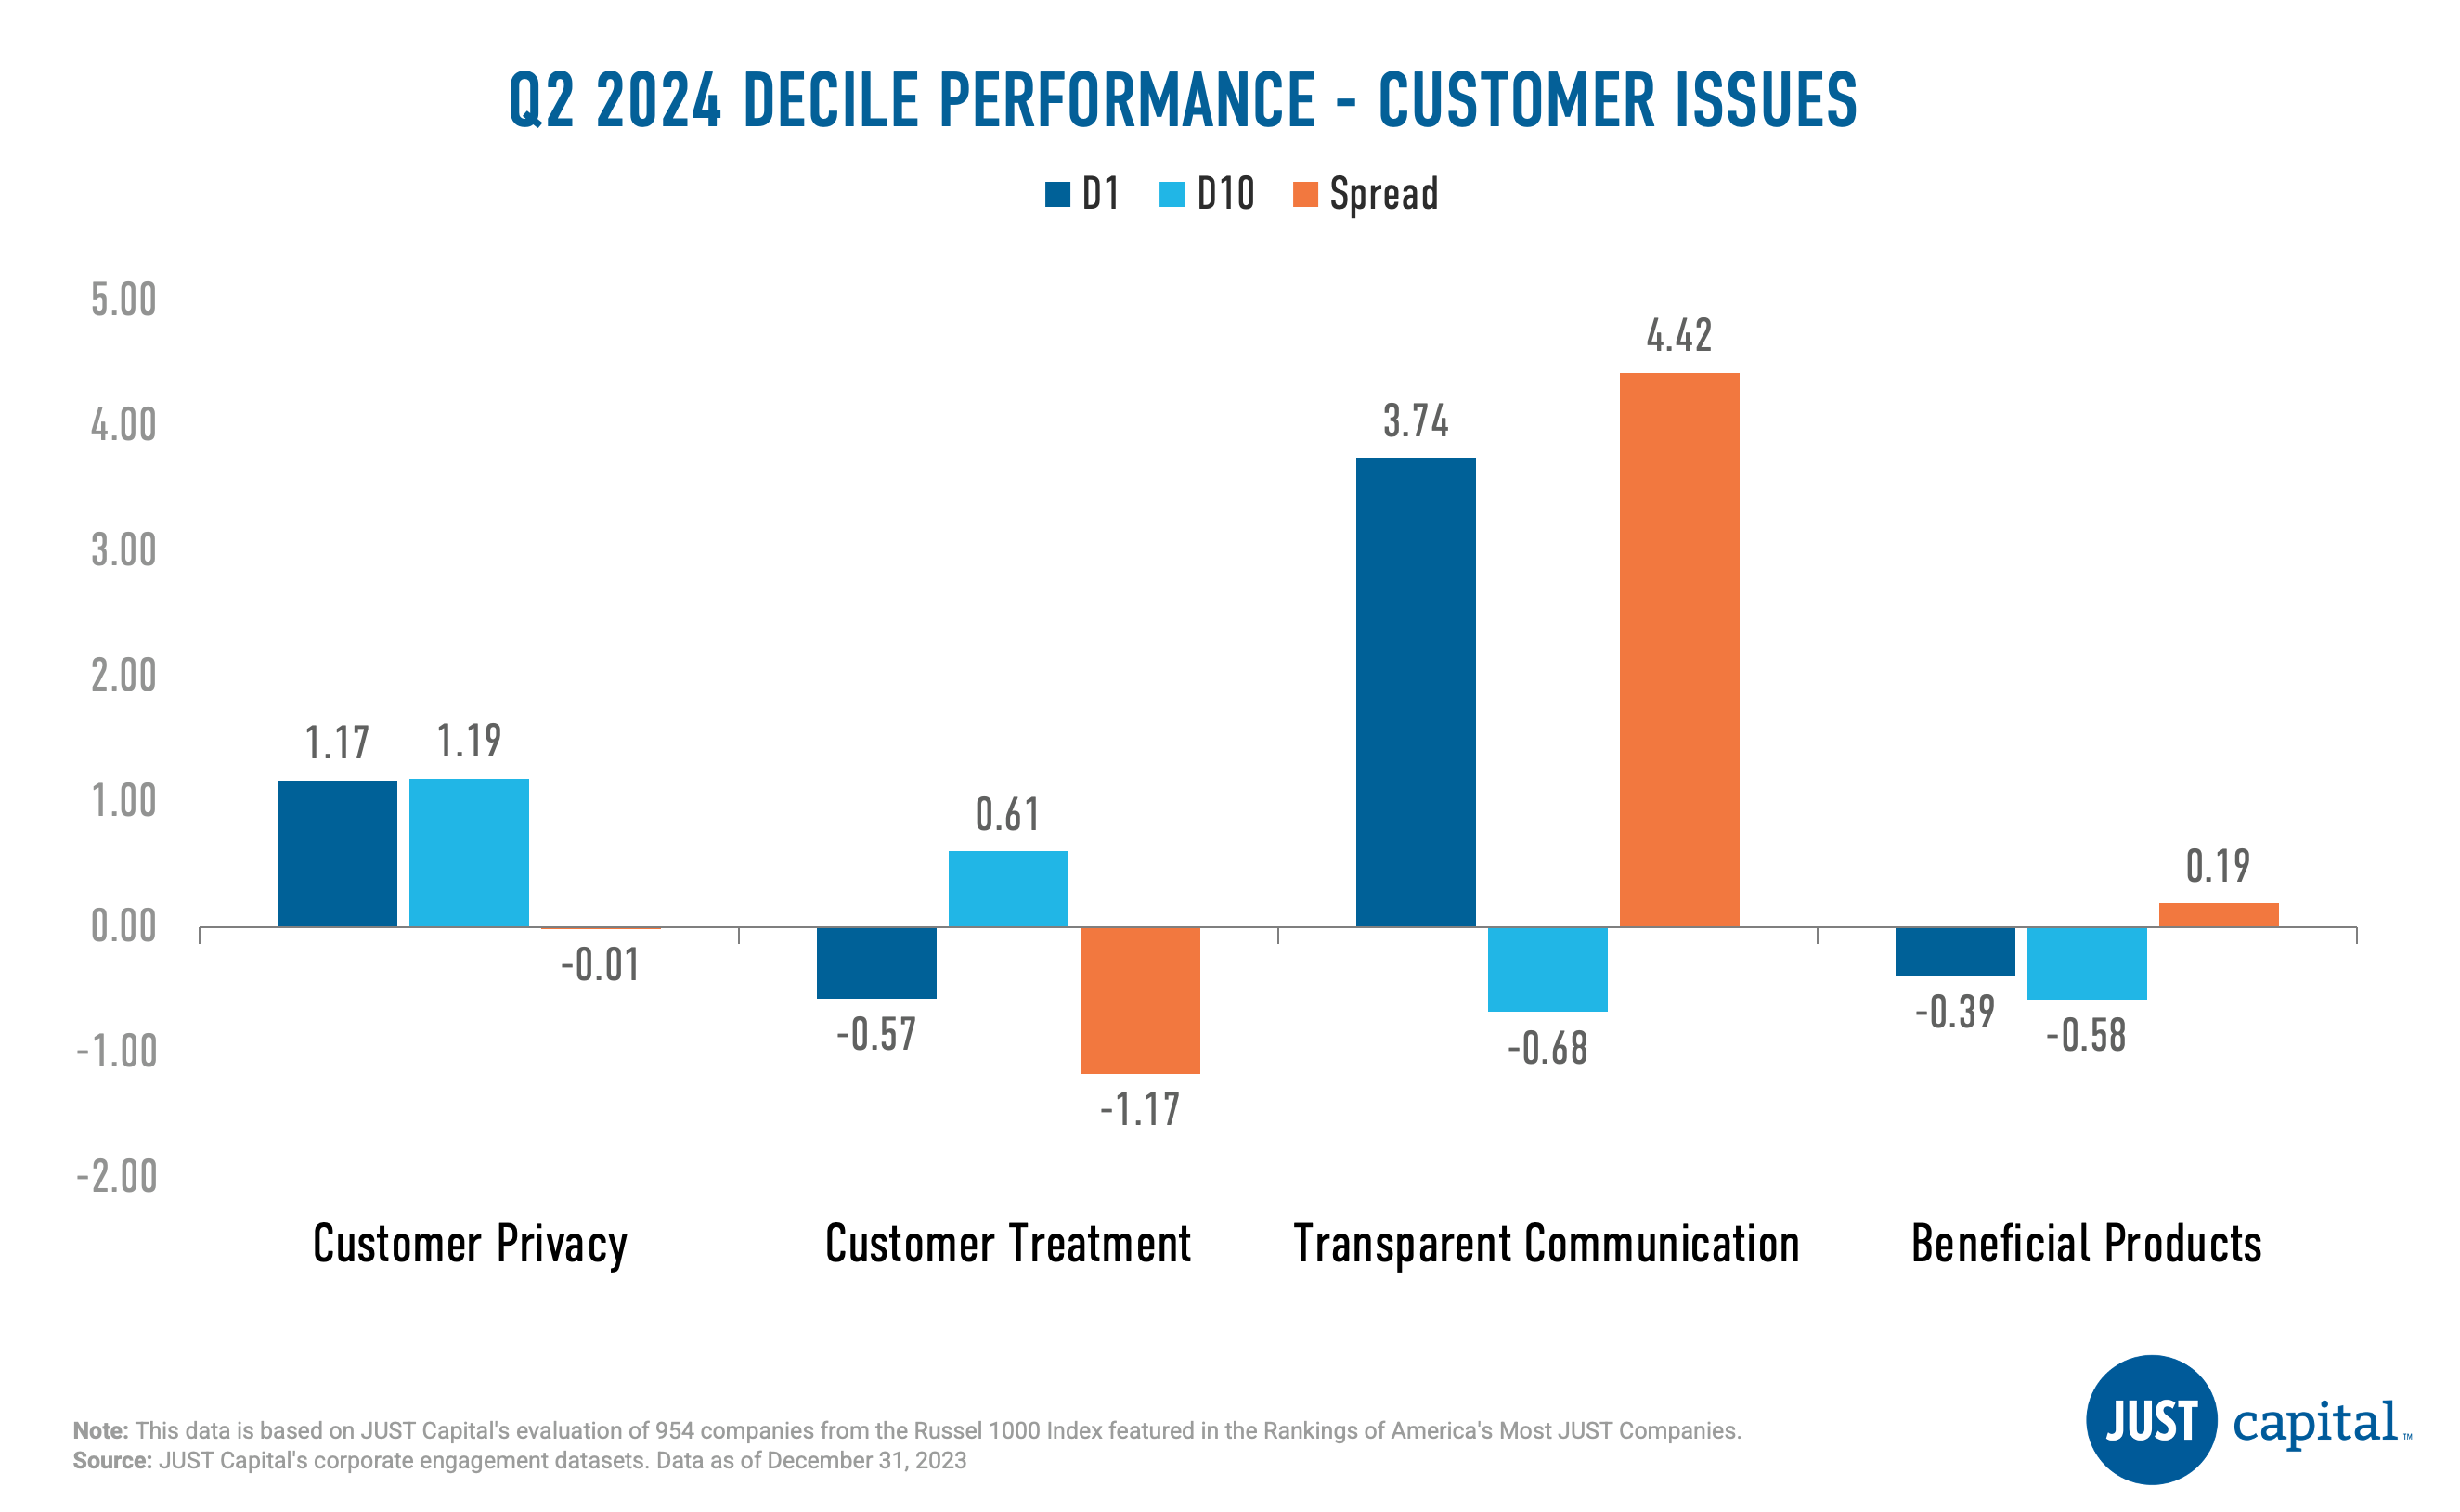
In Q2 2024, two out of 4 Customer Issues delivered negative performance. Transparent Communication was the best performer followed by Beneficial Products.
Shown below are the top and bottom five contributors to the top decile (D1), the best-ranked companies as measured by their Customers score, and the bottom decile (D10), the lowest-ranked names as measured by their Customers score.
Environment
The Environment stakeholder measures a company across four Issues:
- Sustainable Materials
- Pollution Reduction
- Climate Change
- Resource Efficiency
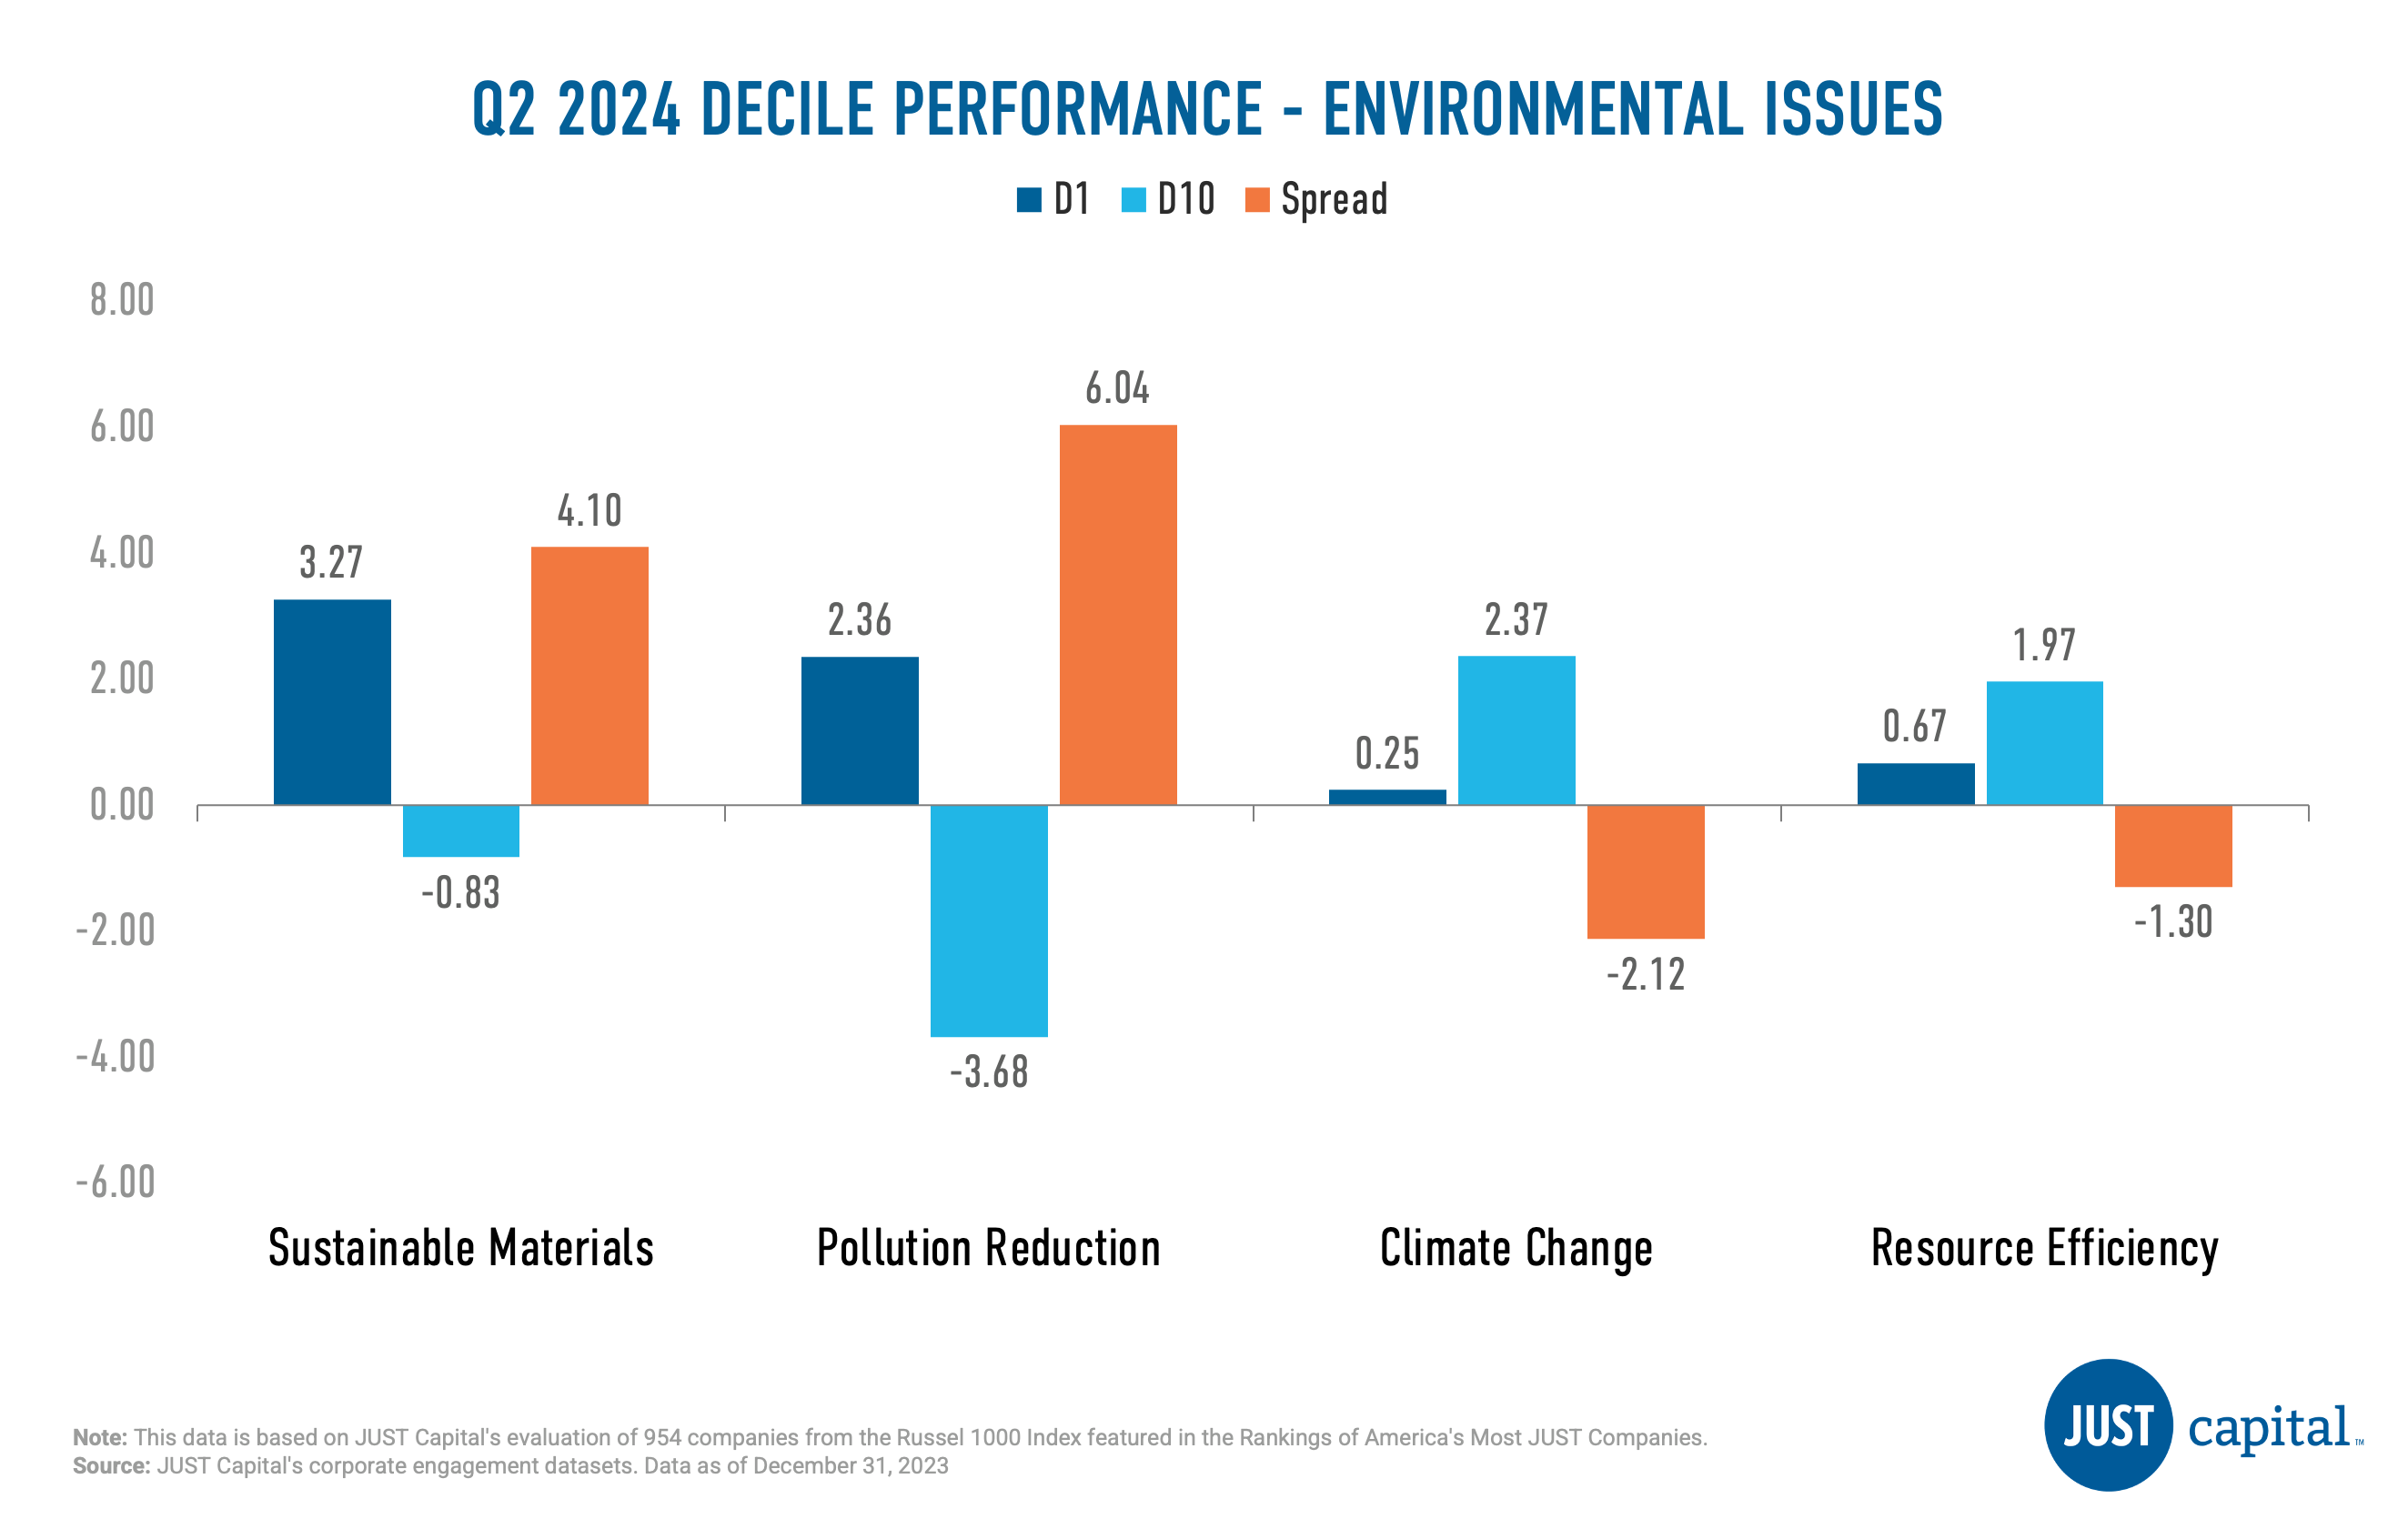
In Q2 2024, we saw two of four Environment Issues deliver positive performance. Pollution Reduction was the top contributor followed by Sustainable Materials in Q2. Climate Change and Resource Efficiency delivered negative performance this quarter.
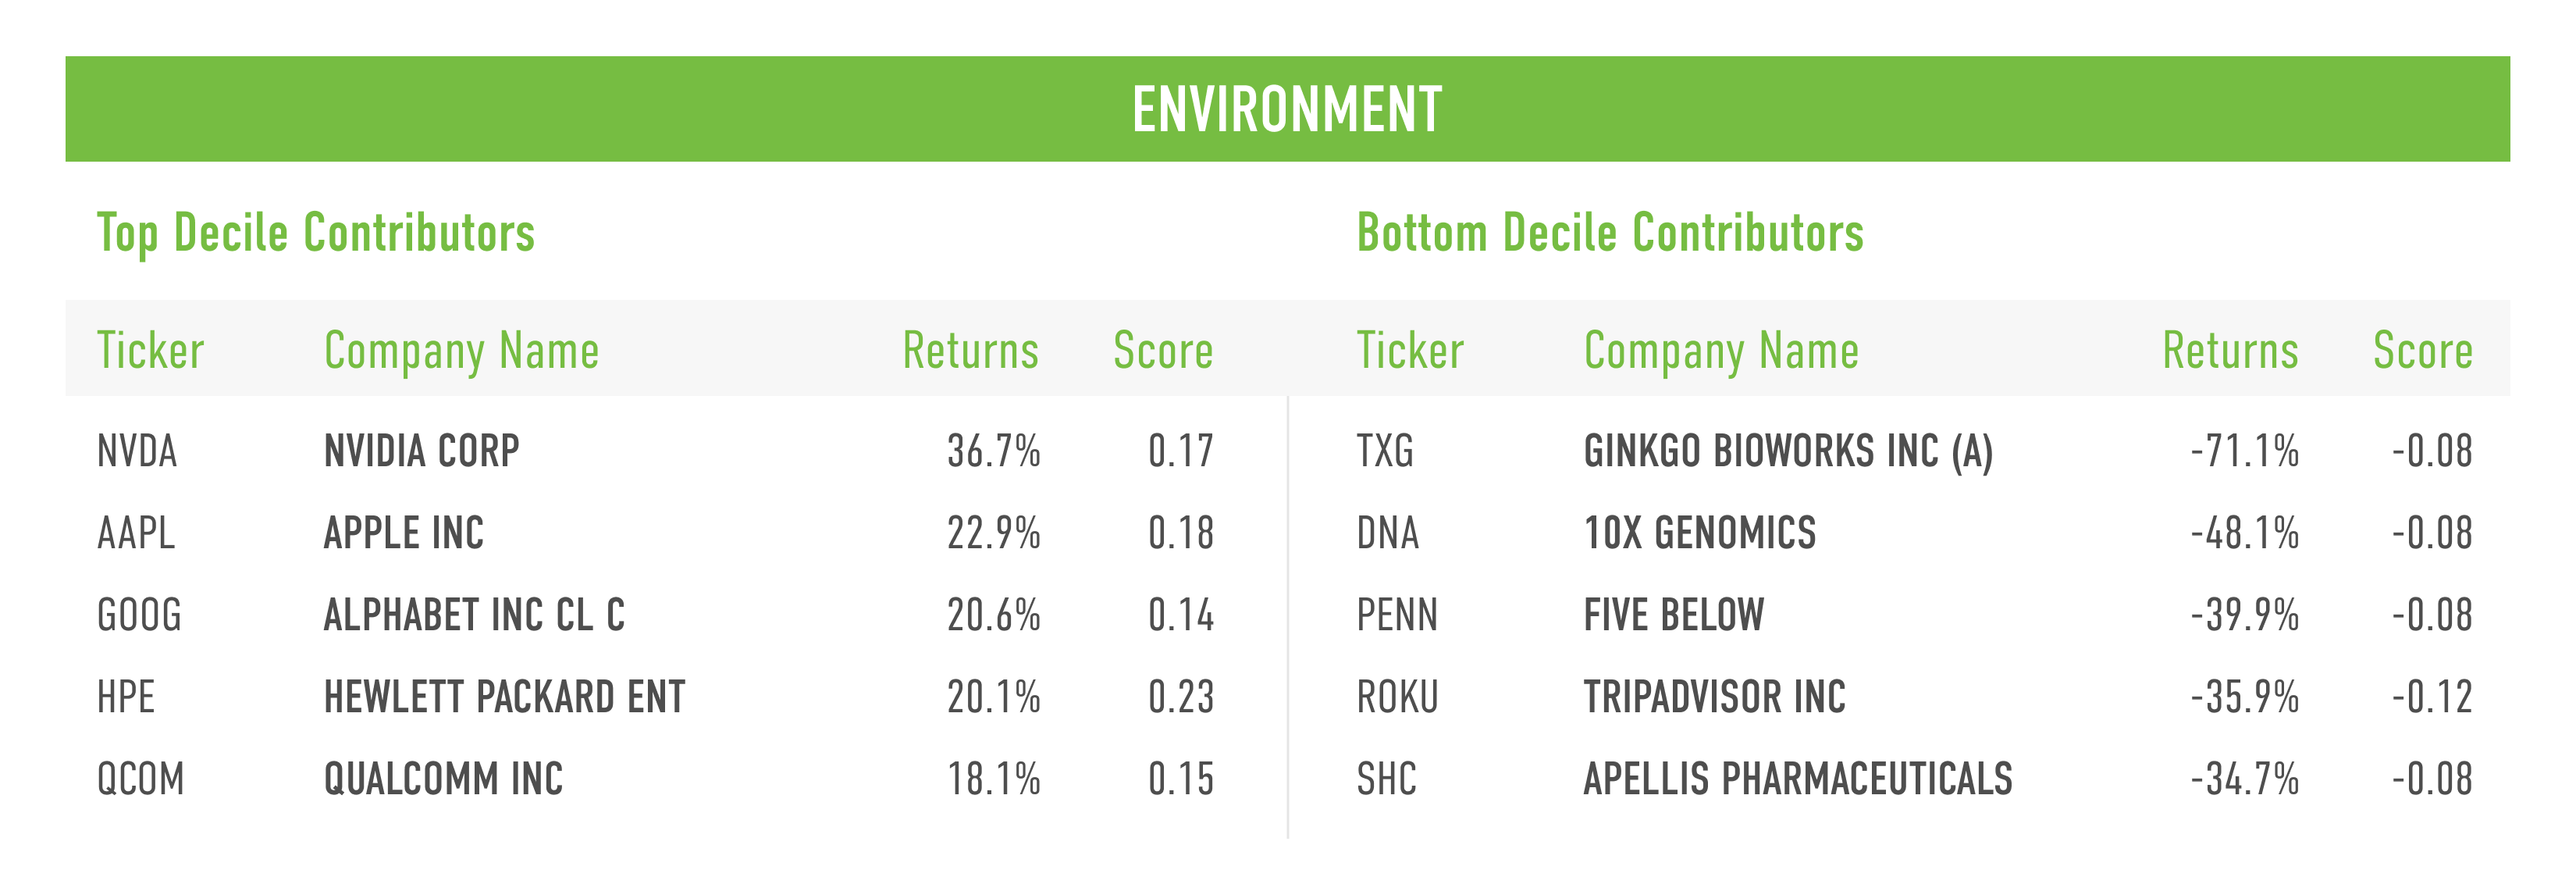
Shown below are the top and bottom five contributors to the top decile (D1), the best-ranked companies as measured by their Environment score, and the bottom decile (D10), the lowest-ranked companies as measured by their Environment score.
Appendix
Computation Methodology
We monitor the performance of these stakeholders and Issues on a long-short basis. The long and short portfolios are selected based on the factor scores as the top and bottom deciles within the universe of companies we track in the Russell 1000. Top decile (D1) companies are those that rank highest based on the factor score, and bottom decile (D10) companies are those that rank lowest based on the factor score.
D1 Performance is computed as
(Equally weighted average of returns of stocks in D1 bucket) – (Equally weighted average of returns of all stocks within the Universe)
D10 Performance is computed as
(Equally weighted average of returns of stocks in D10 bucket) – (Equally weighted average of returns of all stocks within the Universe)
Spread is computed as
D1 Performance – D10 Performance