JUST Report
JUST Capital’s Quarterly Review of Stakeholder Performance – Q2 2023
This report was written by Mona Patni, Director of Quantitative Research & Analytics.
Stocks extended their rally in the second quarter, boosted by cooling inflation, the prospect of a shift in monetary policy, and enthusiasm over artificial intelligence, with the bulk of the gains made in June. The Russell 1000 Index was up 8.6% in Q2 2023, bringing its YTD return to 16.67%. With respect to sector performance, IT companies led the stock market advance in the quarter, while the consumer discretionary and communication services sectors also performed strongly. Underperforming sectors included energy and utilities.
JUST Capital found that all five stakeholders we track delivered negative performance in Q2 2023. However, over the longer term from Jan 2018 to June 2023, the leaders have outperformed the laggards by 52.13% as measured by JUST Overall Score. In Q2 2023, the Customers stakeholder delivered the strongest performance over this period with a long-short spread of -1.12%, while the Environment stakeholder fared most poorly at -9.11%. Within the Customers and Environment stakeholders, underperformance was driven by both deciles, with the top decile underperforming and bottom decile outperforming. For the Workers and Communities stakeholders, underperformance was driven by the top decile, whereas for the Shareholders & Governance stakeholder underperformance was driven by the bottom decile.
JUST Capital’s Overall Weighted Score takes into account the 20 core Issues determined through our survey research – including paying a living wage, creating a diverse, inclusive workplace, and helping combat climate change – across key business stakeholders: Workers, Communities, Shareholders & Governance, Customers, and Environment. This Overall Weighted Score had a negative long-short spread of -1.43% over the period ending June 30, 2023 which was an improvement from Q1 2023 at -7.14%, but still not positive.
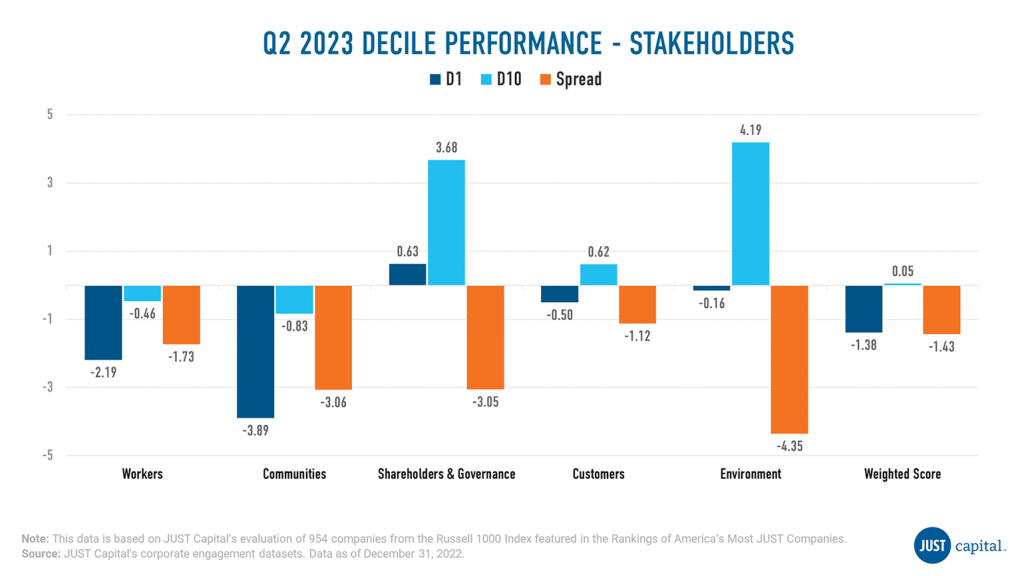
Negative contribution to the top decile of the Overall Weighted Score was driven primarily by the Industrials and Consumer discretionary sectors. Basic Materials, Real Estate, and Technology companies were positive contributors to the top decile. Overweight stocks like Illumina (-19.38%) and Target (-19.82%), and underweight companies like Carvana (164.76%), didn’t help the performance of the top decile of the Overall Weighted Score. On the other hand, the bottom decile, which consists of low performers as measured by stakeholder performance, delivered close to neutral performance. Negative contributions largely came from Financials and Health Care names, while bottom decile companies like Carnival Corp (Consumer Discretionary) and Builders FirstSource Inc (Industrials) rallied during this quarter.
Workers
The Workers stakeholder measures a company across five Issues:
- Living Wage
- Health & Safety
- Benefits & Work-Life Balance
- Diversity, Equity, and Inclusion
- Workforce Advancement
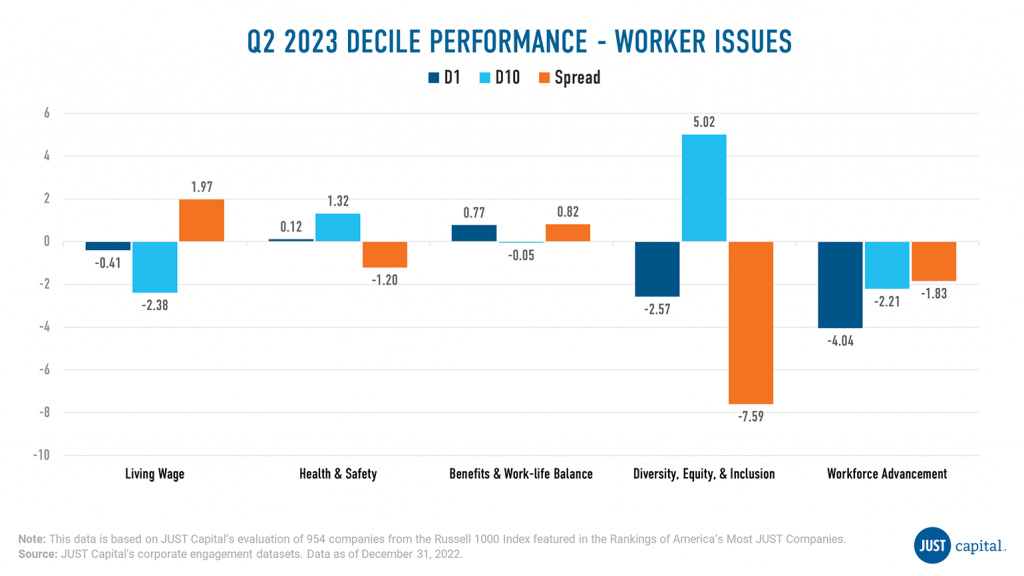
In Q2 2023, we saw Living Wage and Benefits Issues deliver positive performance whereas DEI fared most poorly. Underperformance in DEI & Workforce Advancement was driven by negative performance from both top and bottom decile companies, whereas negative performance in Health & Safety came from bottom decile names.
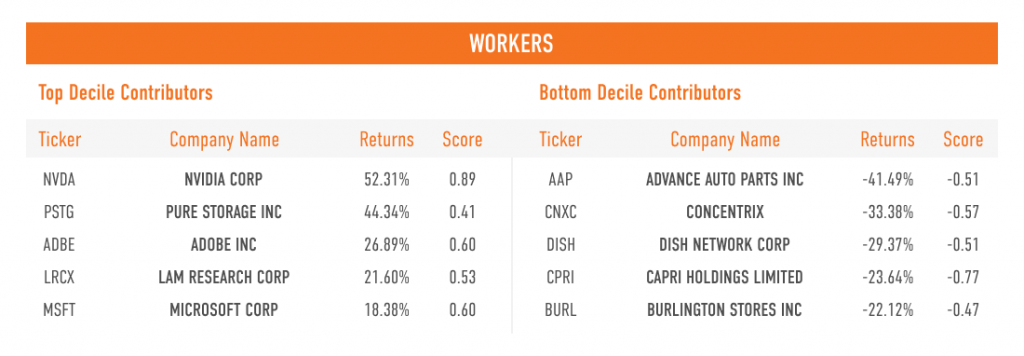
Shown below are the top and bottom five contributors to the top decile (D1), the top-ranked companies as measured by their Workers score, and the bottom decile (D10), the lowest-ranked companies as measured by their Workers score.
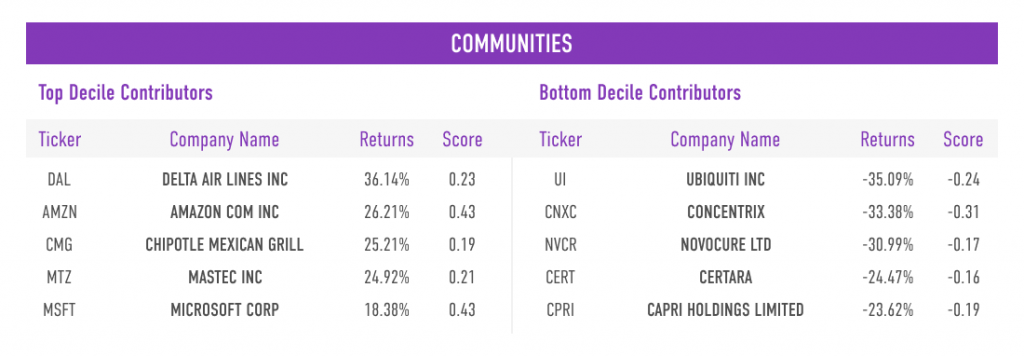
Communities
The Communities stakeholder measures a company across four Issues:
- Local Job Creation
- Human Rights
- Community Development
- Community Support
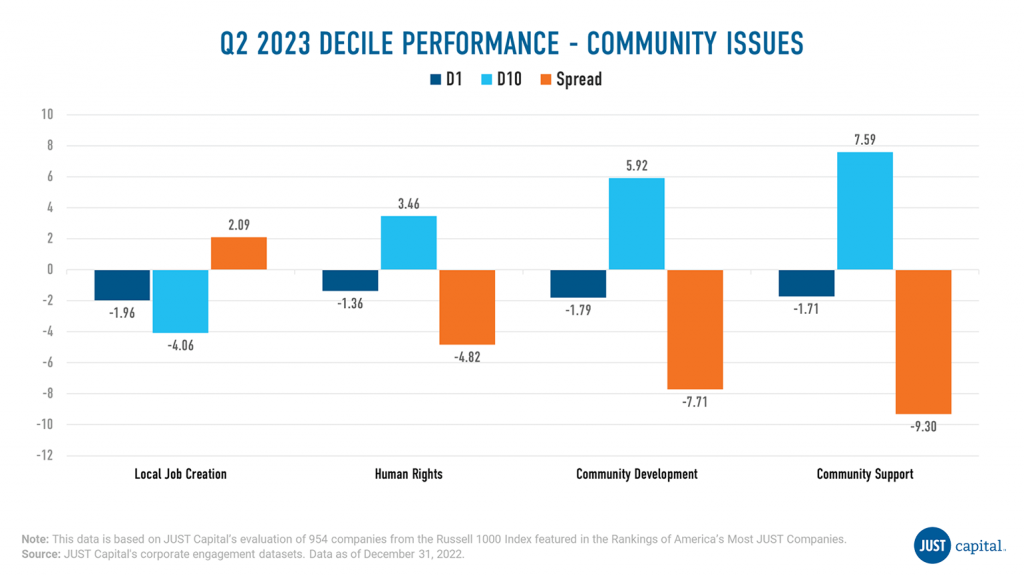
Community Support was the weakest performer followed by Community Development and Supply Chain, with negative contributions coming from both top and bottom decile companies.
Shown below are the both top and bottom five contributors to the top decile (D1), the best-ranked companies as measured by their Communities score, and the bottom decile (D10), the lowest-ranked companies as measured by their Communities score.
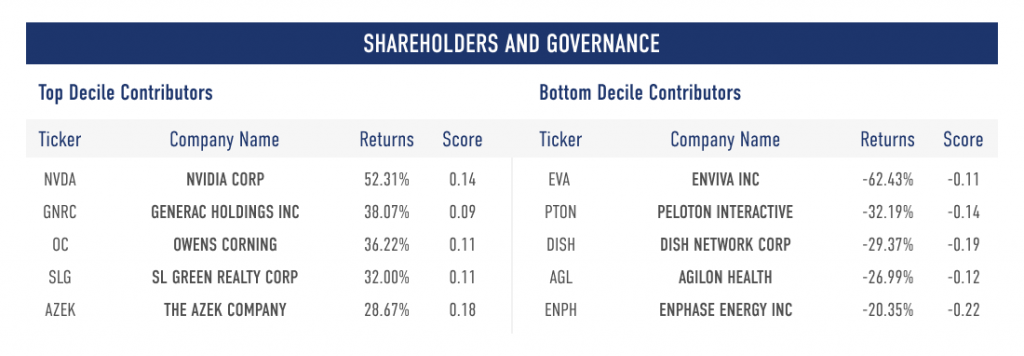
Shareholders and Governance
The Shareholders and Governance stakeholder measures a company across three Issues:
- Accountability to Stakeholders
- Ethical Leadership
- Investor Return
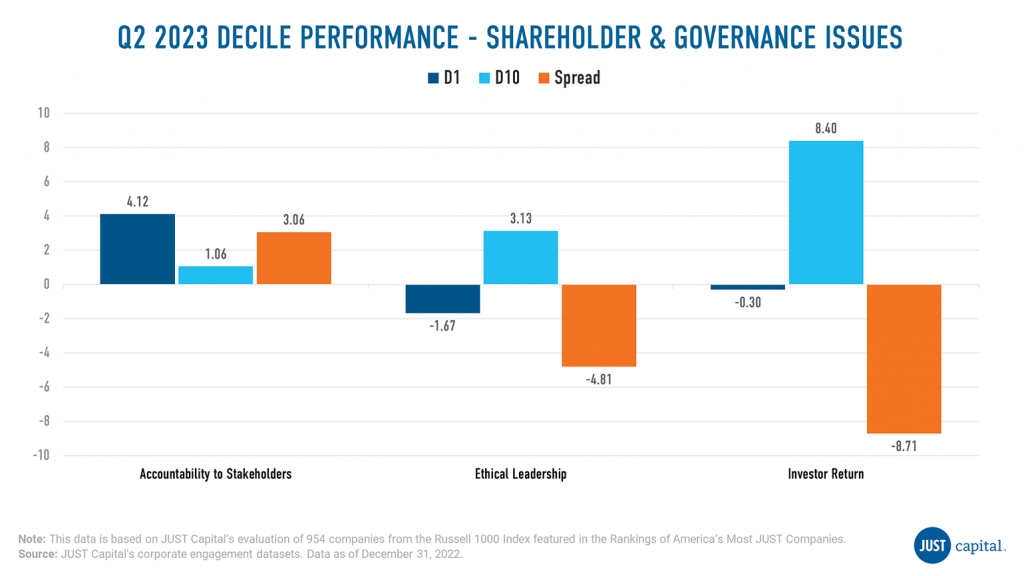
In Q2 we saw the Accountability to Stakeholders Issue deliver positive performance, with a long-short spread of 3.1%, whereas Ethical Leadership and Investor Return performance was negative.
Shown below are both the top and bottom five contributors to the top decile (D1), the best-ranked companies as measured by their Shareholders and Governance score, and the bottom decile (D10), the lowest-ranked companies as measured by their Shareholders and Governance score.
Customers
The Customers stakeholder measures a company across four Issues:
- Customer Privacy
- Customer Treatment
- Transparent Communication
- Beneficial Products
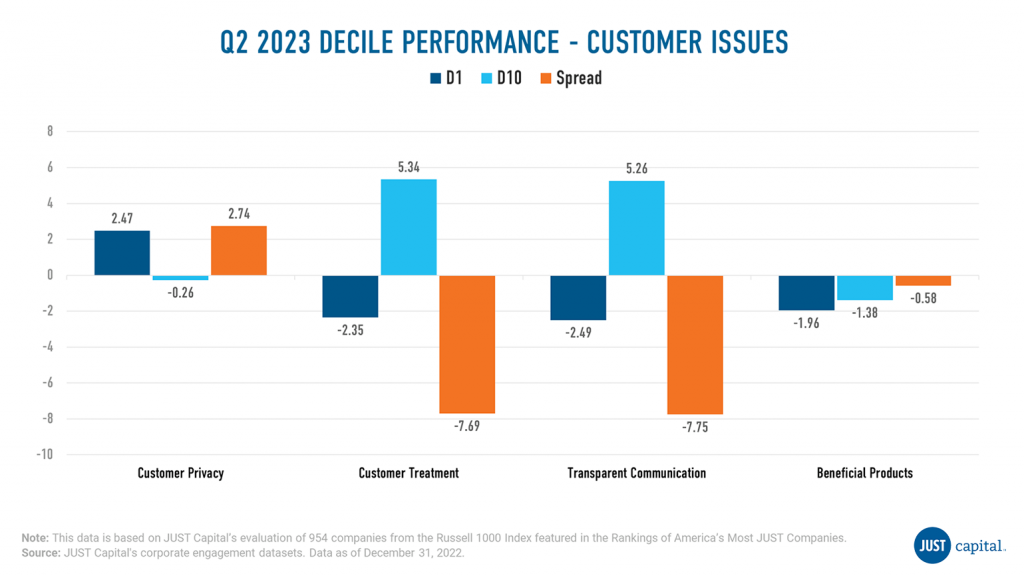
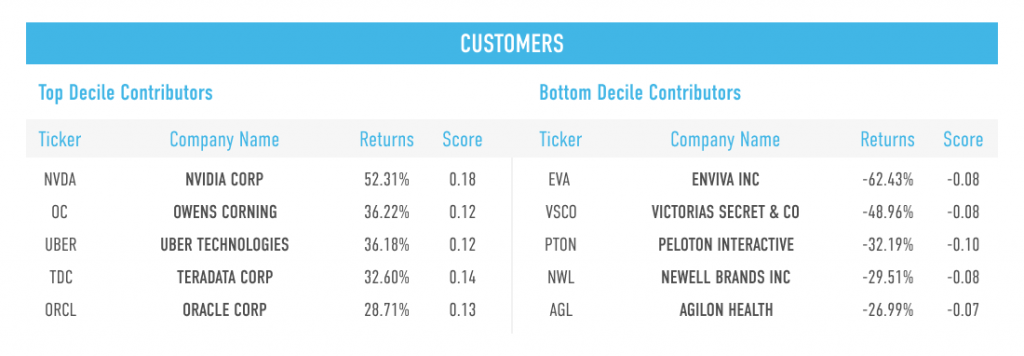
In Q2 2023, we saw Customer Privacy outperform the other Customer Issues, with a long-short spread of 2.7%. Beneficial Products, Customer Treatment, and Transparent Communication were negative contributors to Customers performance.
Shown below are both the top and bottom five contributors to the top decile (D1), the best-ranked companies as measured by their Customers score, and the bottom decile (D10), the lowest-ranked names as measured by their Customers score.
Environment
The Environment stakeholder measures a company across four Issues:
- Sustainable Materials
- Pollution Reduction
- Climate Change
- Resource Efficiency
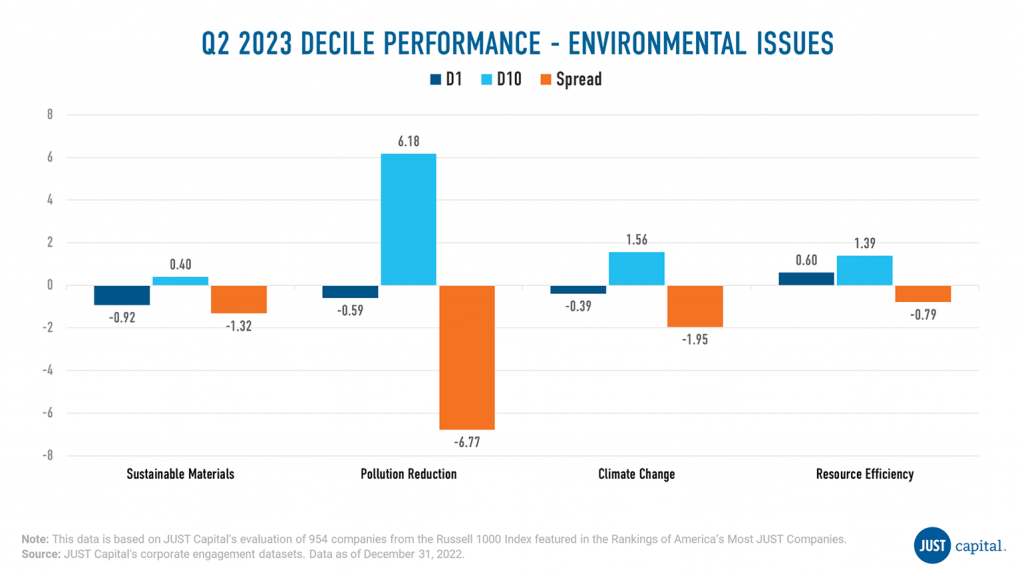
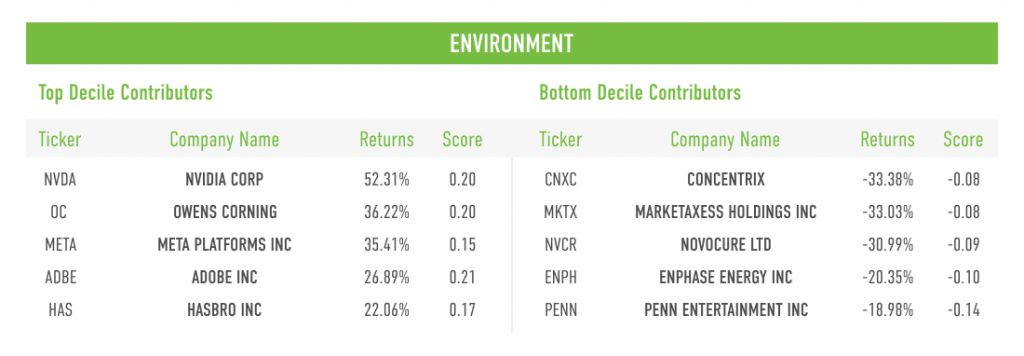
In Q2 2023, we saw all Environment Issues deliver negative performance, with Pollution Reduction being the weakest.
Shown below are both the top and bottom five contributors to the top decile (D1), the best-ranked companies as measured by their Environment score, and the bottom decile (D10), the lowest-ranked companies as measured by their Environment score.
Appendix
Computation Methodology
We monitor the performance of these stakeholders and Issues on a long-short basis. The long and short portfolios are selected based on the factor scores as the top and bottom deciles within the universe of companies we track in the Russell 1000. Top decile (D1) companies are those that rank highest based on the factor score, and bottom decile (D10) companies are those that rank lowest based on the factor score.
D1 Performance is computed as:
(Equally weighted average of returns of stocks in D1 bucket) – (Equally weighted average of returns of all stocks within the Universe)
D10 Performance is computed as:
(Equally weighted average of returns of stocks in D10 bucket) – (Equally weighted average of returns of all stocks within the Universe)
Spread is computed as:
D1 Performance – D10 Performance