JUST Report
The Environmental Explorer
As part of our mission to create a more just marketplace that better reflects the priorities of the American people, JUST Capital has created the Environmental Explorer – a new, interactive tool that helps people quickly and easily understand how different companies are acting on a range of environmental issues. Through the Explorer, we aim to shed light on what corporate leadership looks like, and who the leaders are, on the environmental performance factors deemed most important to the American public.
Voice of the American People: The Planet is a Stakeholder
Since 2014, JUST Capital has conducted some of the most exhaustive polling ever done to identify what issues are most important to Americans when it comes to just business behavior.
Americans see the planet as a key stakeholder, and in 2017, 75 percent of survey respondents agreed that corporations should be responsible for taking action to combat pollution (vs. 71 and 65 percent that saw the government and individuals, respectively, as responsible). Americans believe that just companies should minimize pollution, use environmental resources efficiently, and institute environmentally responsible management – prioritized in that order. These key issues, taken together, form the basis for how we evaluate companies’ environmental performance in our rankings:
Visualizing Air Pollution: Exploring Regional Impacts
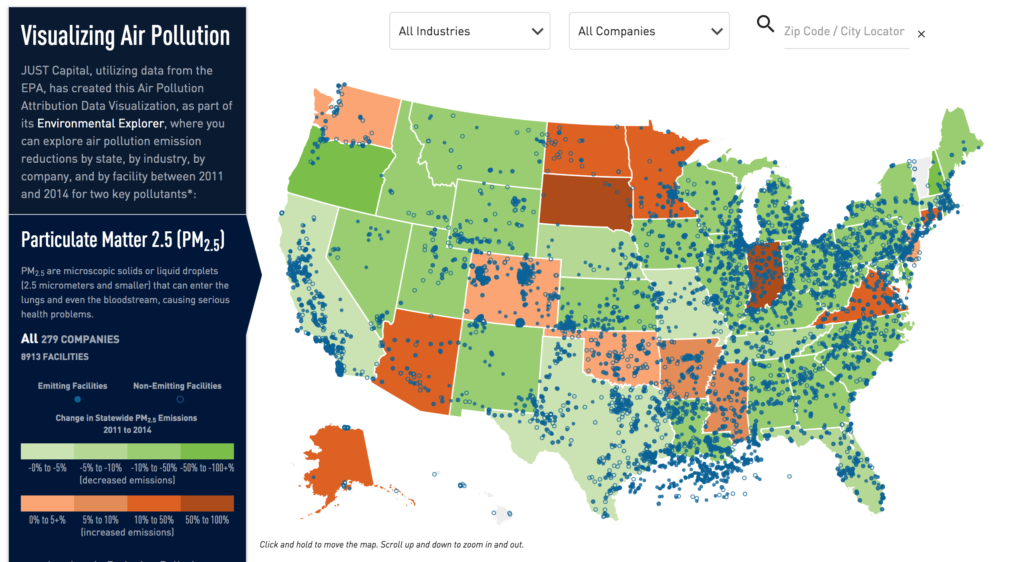
In our polling, 80 percent of Americans agreed that air quality was an important factor to consider in evaluating environmental impact, with 79 percent aligning on human health as another key measure of those impacts. To help connect these dots, we’re introducing a new series of interactive data visualizations that enable users to explore state-by-state, company-by-company, and facility-by-facility, how corporations are doing when it comes to air pollution emission reductions.
The data featured in the Environmental Explorer originates in part from JUST Capital’s rankings data, as well as from company emissions and national air pollution data collected from EPA reports. Specifically, JUST Capital has utilized the EPA’s Greenhouse Gas (GHG) Emissions data and the EPA’s National Inventory Emissions data, looking primarily at PM2.5 (Particulate Matter 2.5) and CO2 (Carbon Dioxide). Most people are familiar with CO2 as the largest and most common contributor to greenhouse gas emissions and therefore, climate change. Particulate matter 2.5 (also called particle pollution) are fine inhalable particles with diameters that are generally 2.5 micrometers and smaller. For comparison, the average human hair is about 70 micrometers in diameter – making it 30 times larger than the largest fine particle. While lesser known than CO2, PM2.5 is composed of microscopic solids or liquid droplets so small that they can enter deep into the lungs and even the bloodstream, causing serious health problems. PM2.5 are also the main cause of reduced visibility (haze) in parts of the United States.
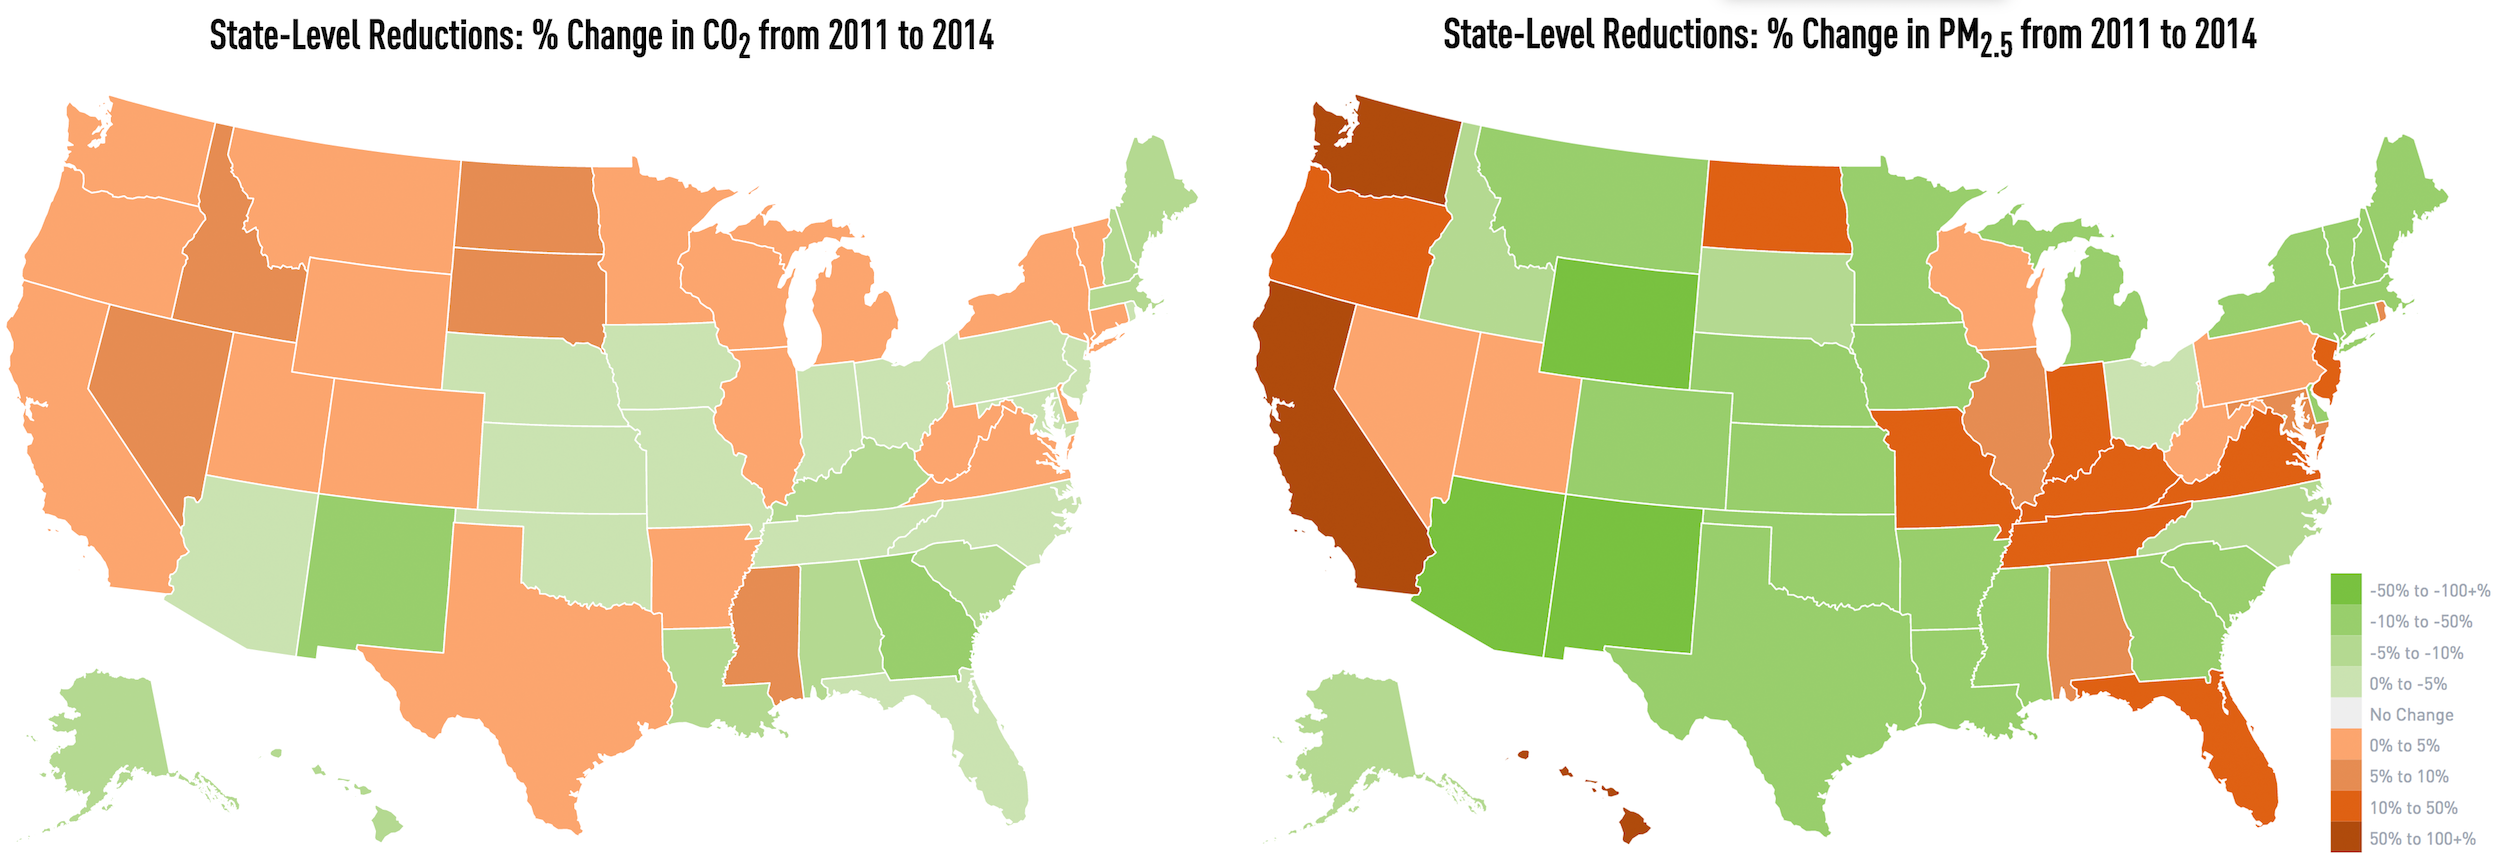
First, we looked at all large U.S. companies with stationary sources of pollution (e.g. facilities with smokestacks), and mapped them to showcase state-level reductions over time. For example – states like New Mexico, Arizona, and Colorado have considerably reduced emissions between 2011 and 2014, while the PM2.5 emissions in California and Washington have increased. It is important to note that all the data herein represents only stationary facilities, and does not incorporate the effects of emissions from transportation – like trucks, planes, or ships – or commercial and residential buildings. Facility-level sources of PM2.5 comprise about 20% of all U.S. emissions and facility-level sources of CO2 contribute a little more than 50% of all U.S. emissions.
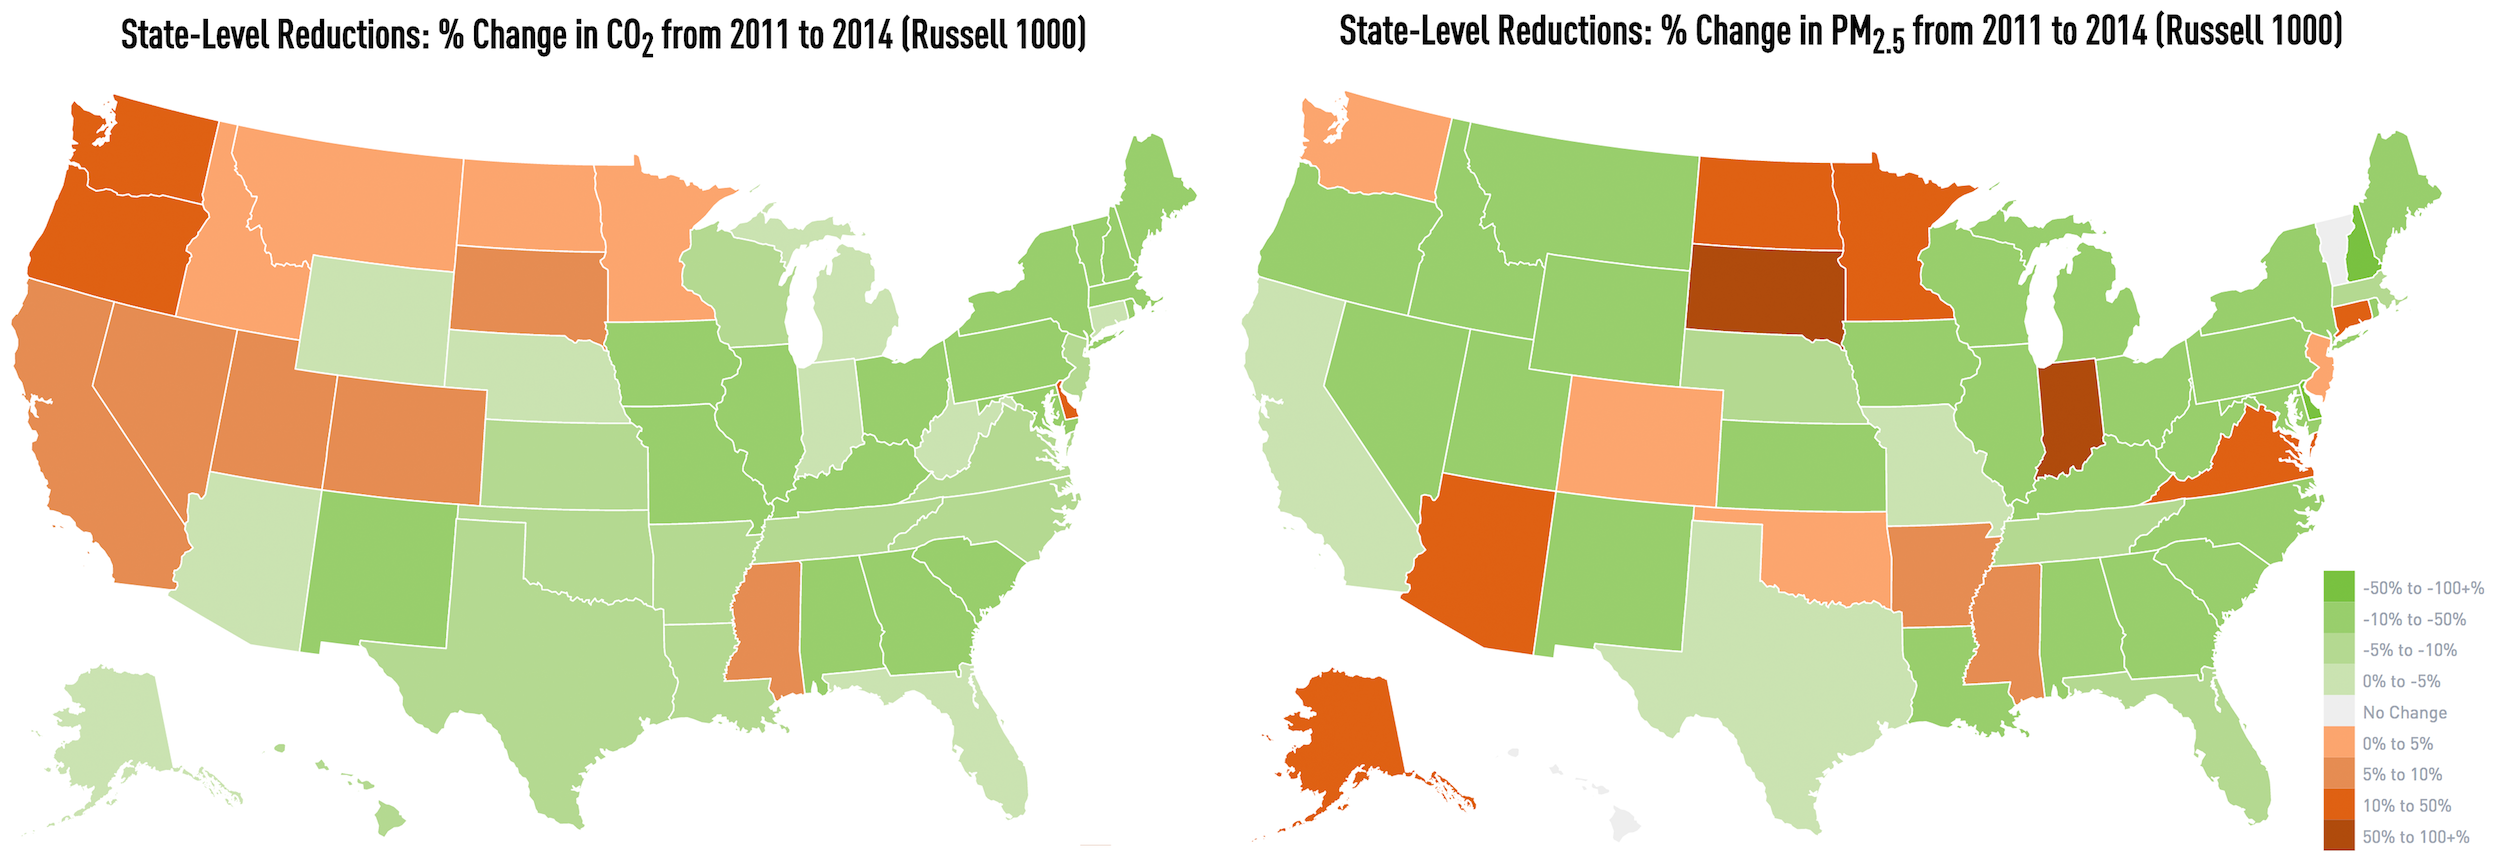
Next, we limited the scope to only look at the large, publicly-traded corporations that JUST Capital analyzes and ranks – at the facility level, providing an interactive tool that enables anyone to explore which companies have been leading the way in reducing air pollution emissions between 2011 and 2014. Nearly 9,000 facilities from 279 companies are represented.
Click below to explore the interactive Air Pollution Attribution Data Visualization by state, by industry, by company, and by facility.
Overall, the data shows that both PM2.5 and CO2 emissions have decreased over this timeframe – suggesting that companies across America, supported by state and national regulations, are taking responsibility and working to minimize both air pollutants. Please note that the EPA data is released every three years, and 2017 data will be available in 2019.
Working Together
JUST Capital’s Environmental Explorer represents a key step in our ongoing effort to provide access to transparent, unbiased data illustrating how companies perform on the issues that matter most to Americans. We will continue to develop the Explorer with additional tools and visualizations that dig into the other key issues identified through our polling.
Through this work, we aim to enable business leaders, policymakers, advocacy groups, investors, and the general public to custom-rank companies, benchmark performance, and better understand the local impact of environmental performance issues. In making this critical data easily available and meaningfully visualized, we hope to drive change in the private sector and beyond, encouraging all stakeholders to work together to protect the environment and nurture healthy communities.