JUST Report
JUST Capital’s Quarterly Review of Stakeholder Performance – Q1 2022
- More Reports
- View all JUST Reports
Report by Director of Quantitative Research & Analytics Mona Patni.
Stakeholder Performance
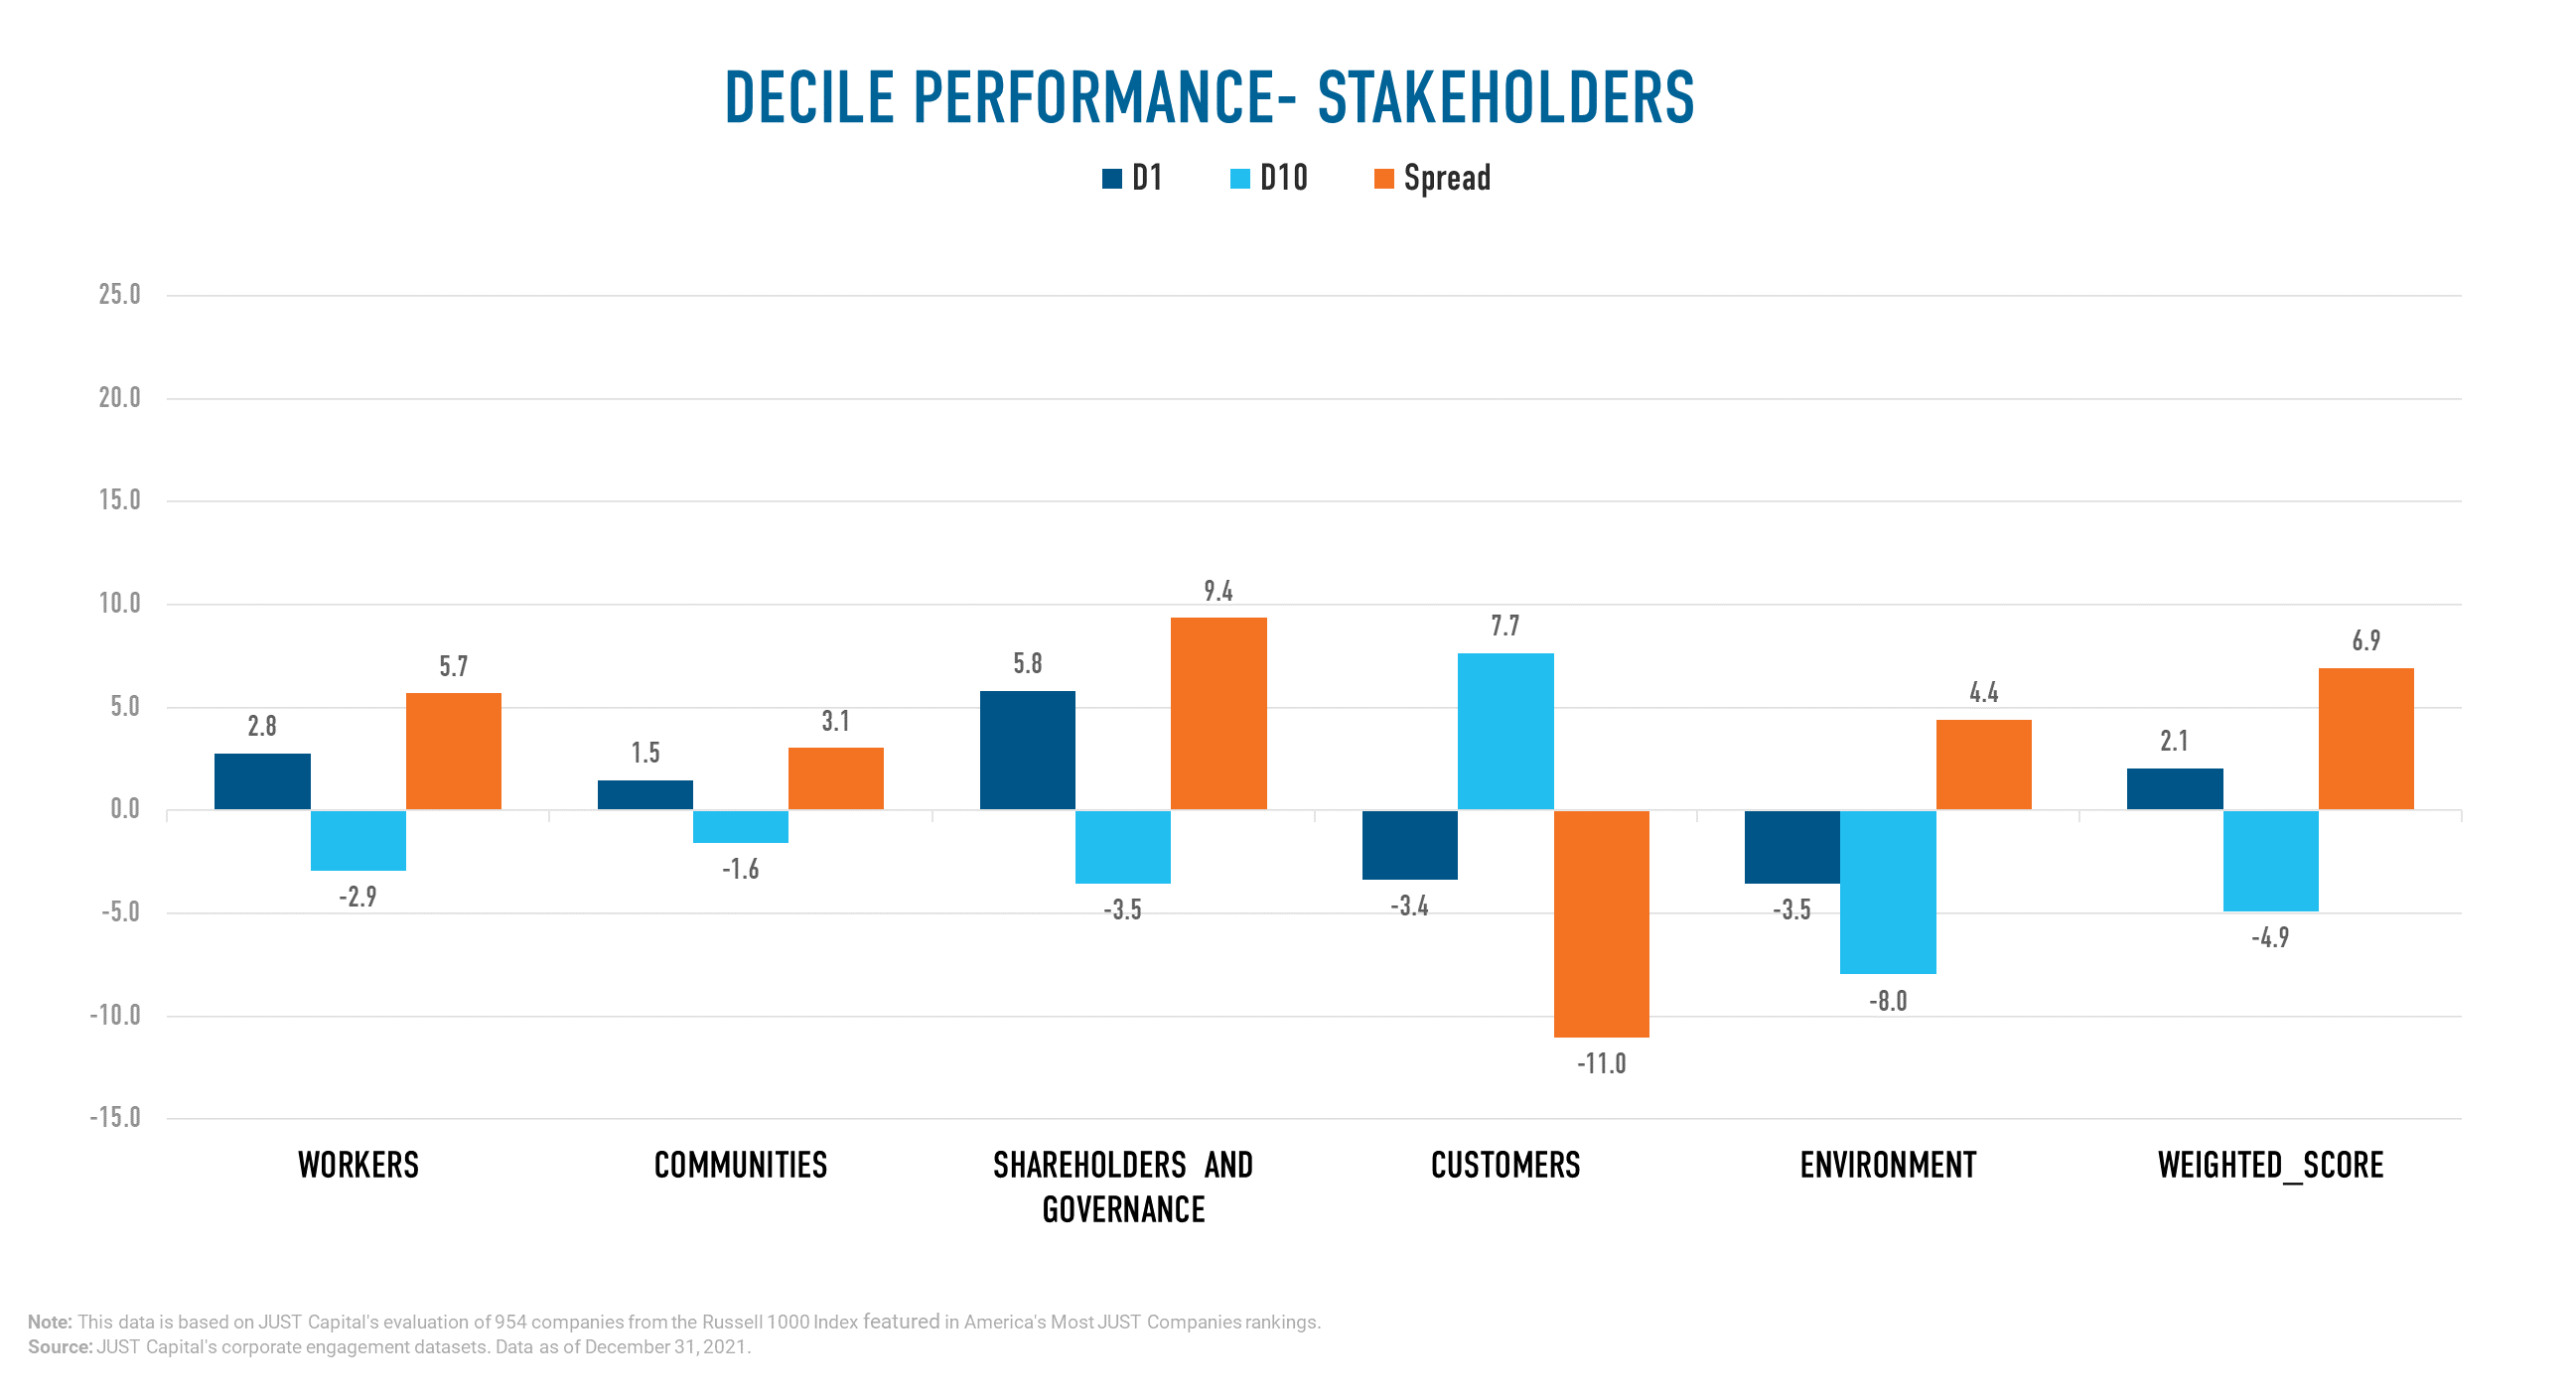
In quant investing, factors form the basis of performance. Here, we evaluate the stakeholder and issue scores that JUST Capital computes for Russell 1000 companies as factors and see if the signal based on the score can translate into alpha over the period being considered. We use the scores to form D1 (best ranked companies) and D10 (worst ranked companies) portfolios and see if these signals are useful in separating one group of stocks from another by sharing the quarterly performance of the portfolios.
In Q1 2022 JUST Capital found that four of the five stakeholders we track delivered positive performance, excluding Customers. The Shareholders and Governance stakeholder delivered the best performance over this period with a long-short spread of 9.36%. Within the Customers stakeholder, underperformance was driven by both deciles, with the top decile underperforming and bottom decile outperforming.
JUST Capital’s Overall Weighted Score takes into account the 20 core Issues determined through our survey research – including paying a living wage, creating a diverse, inclusive workplace, and helping combat climate change – across key business stakeholders: Workers, Communities, Shareholders and Governance, Customers, and Environment. This Overall Weighted Score had the second highest long-short spread over the period ending March 31, 2022.
Workers Performance
The Workers stakeholder measures a company across five Issues:
- Wages – Pays a fair, living wage.
- Health – Protects worker health and safety.
- Benefits – Provides benefits and work-life balance.
- Diversity, Equity, and Inclusion (DEI) – Cultivates a diverse, inclusive workplace.
- Career – Invests in workforce training.
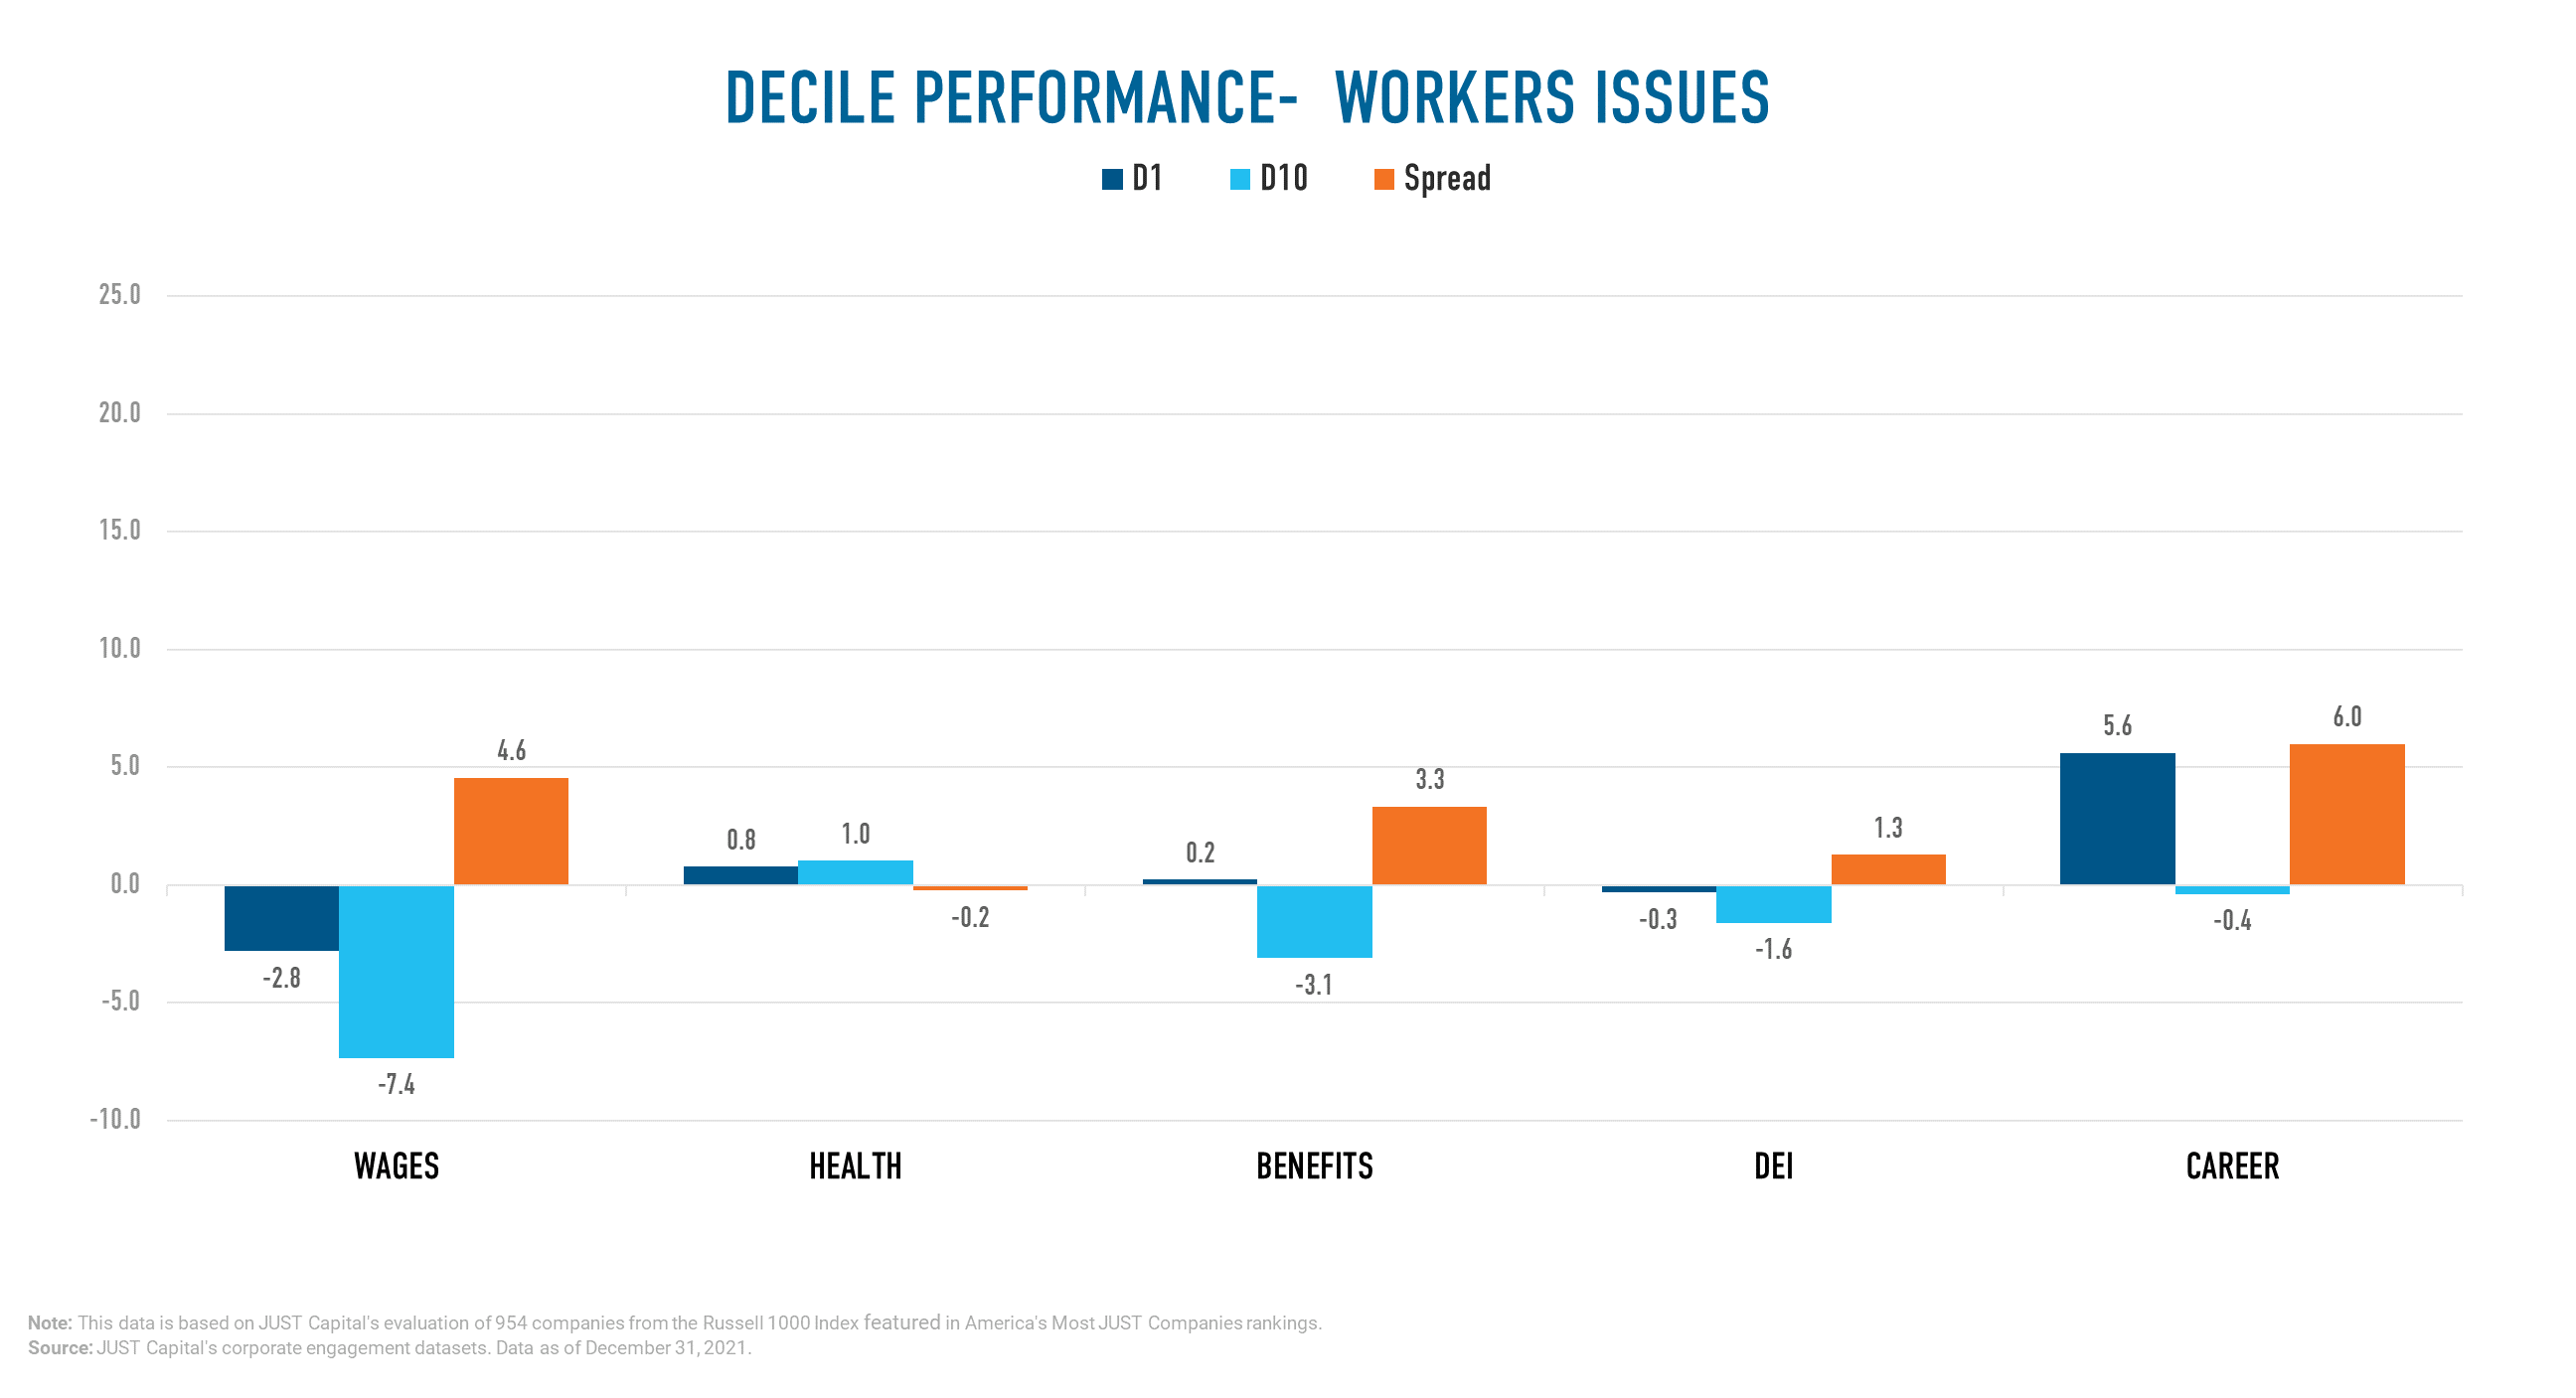
Year to date (YTD), we saw every Worker Issue besides Health outperform. Underperformance in Health was driven by negative performance from the bottom decile companies.
Shown below are the both top and bottom five contributors to the top decile (D1), the best-ranked companies as measured by their Workers score, and the bottom decile (D10), the worst-ranked companies as measured by their Worker score.
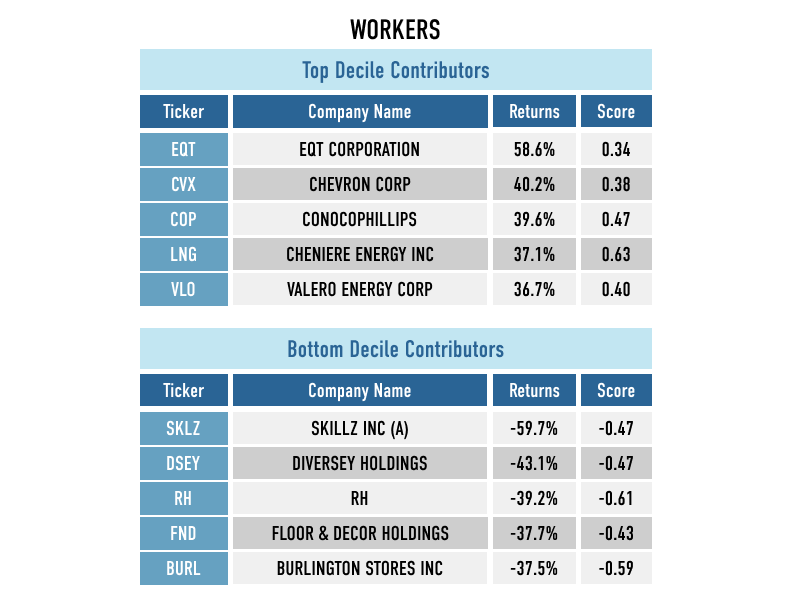
Interestingly, four out of top five contributors to D1 worker performance were all in the energy sector. We have seen energy names do well YTD, driven by improving demand and the Russia-Ukraine war’s curtailing supply and drawdown in inventories.
Among the top detractors, the mobile gaming platform Skillz was the biggest negative contributor.
Communities Performance
The Communities stakeholder measures a company across four Issues:
- Jobs – Creates jobs in the U.S.
- Supply Chain – Respects human rights in the supply chain.
- Community Development – Contributes to community development.
- Philanthropy – Gives back to local communities.
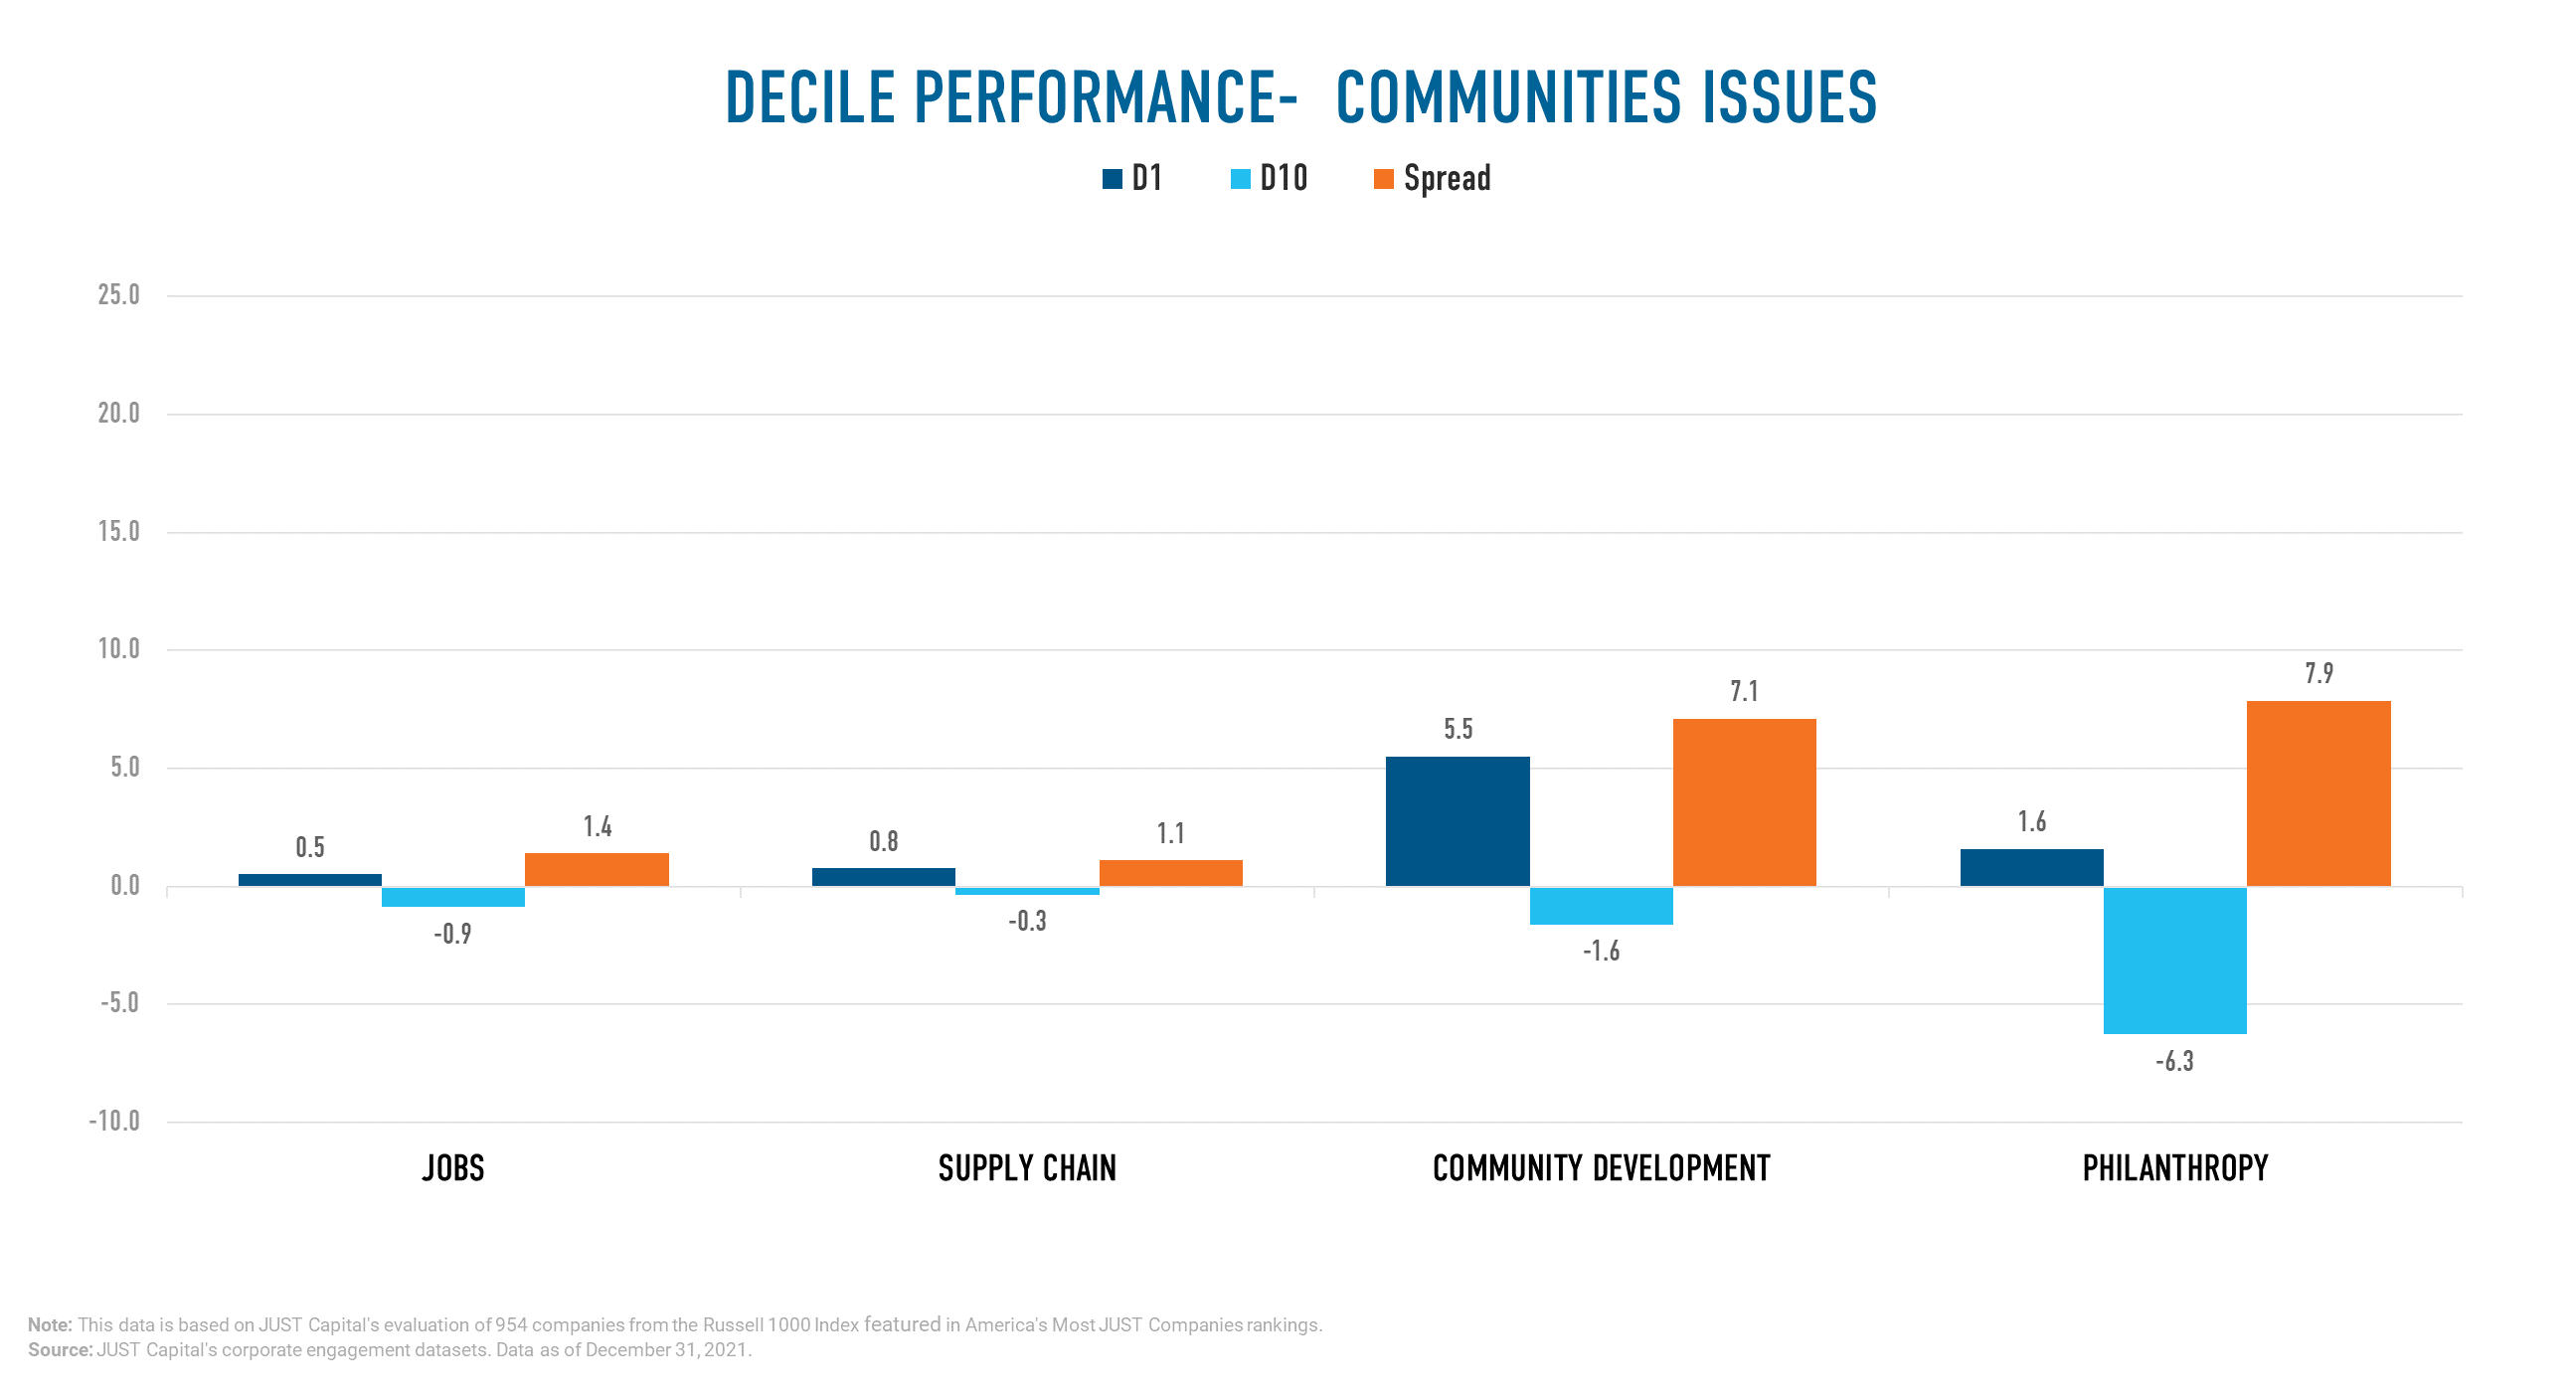
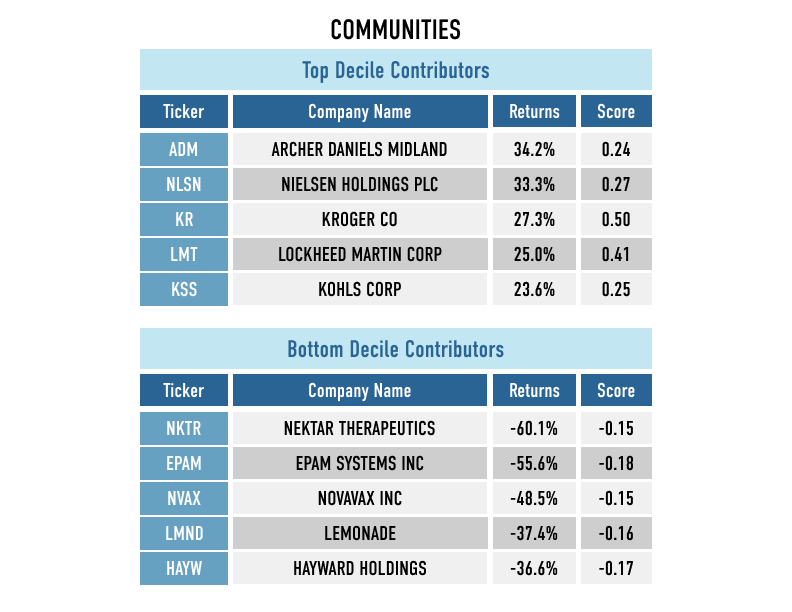
All issues within Communities were positive contributors to the stakeholder’s performance.
YTD we saw Philanthropy outperform other Issues within Communities. Shown below are the both top and bottom five contributors to the top decile (D1), the best-ranked companies as measured by their Communities score, and the bottom decile (D10), the worst-ranked companies as measured by their Communities score.
Shareholders and Governance Performance
The Shareholders and Governance stakeholder measures a company across three Issues:
- Accountability – Prioritizes accountability to all stakeholders.
- Ethics – Acts ethically at the leadership level.
- Returns – Generates returns for investors.
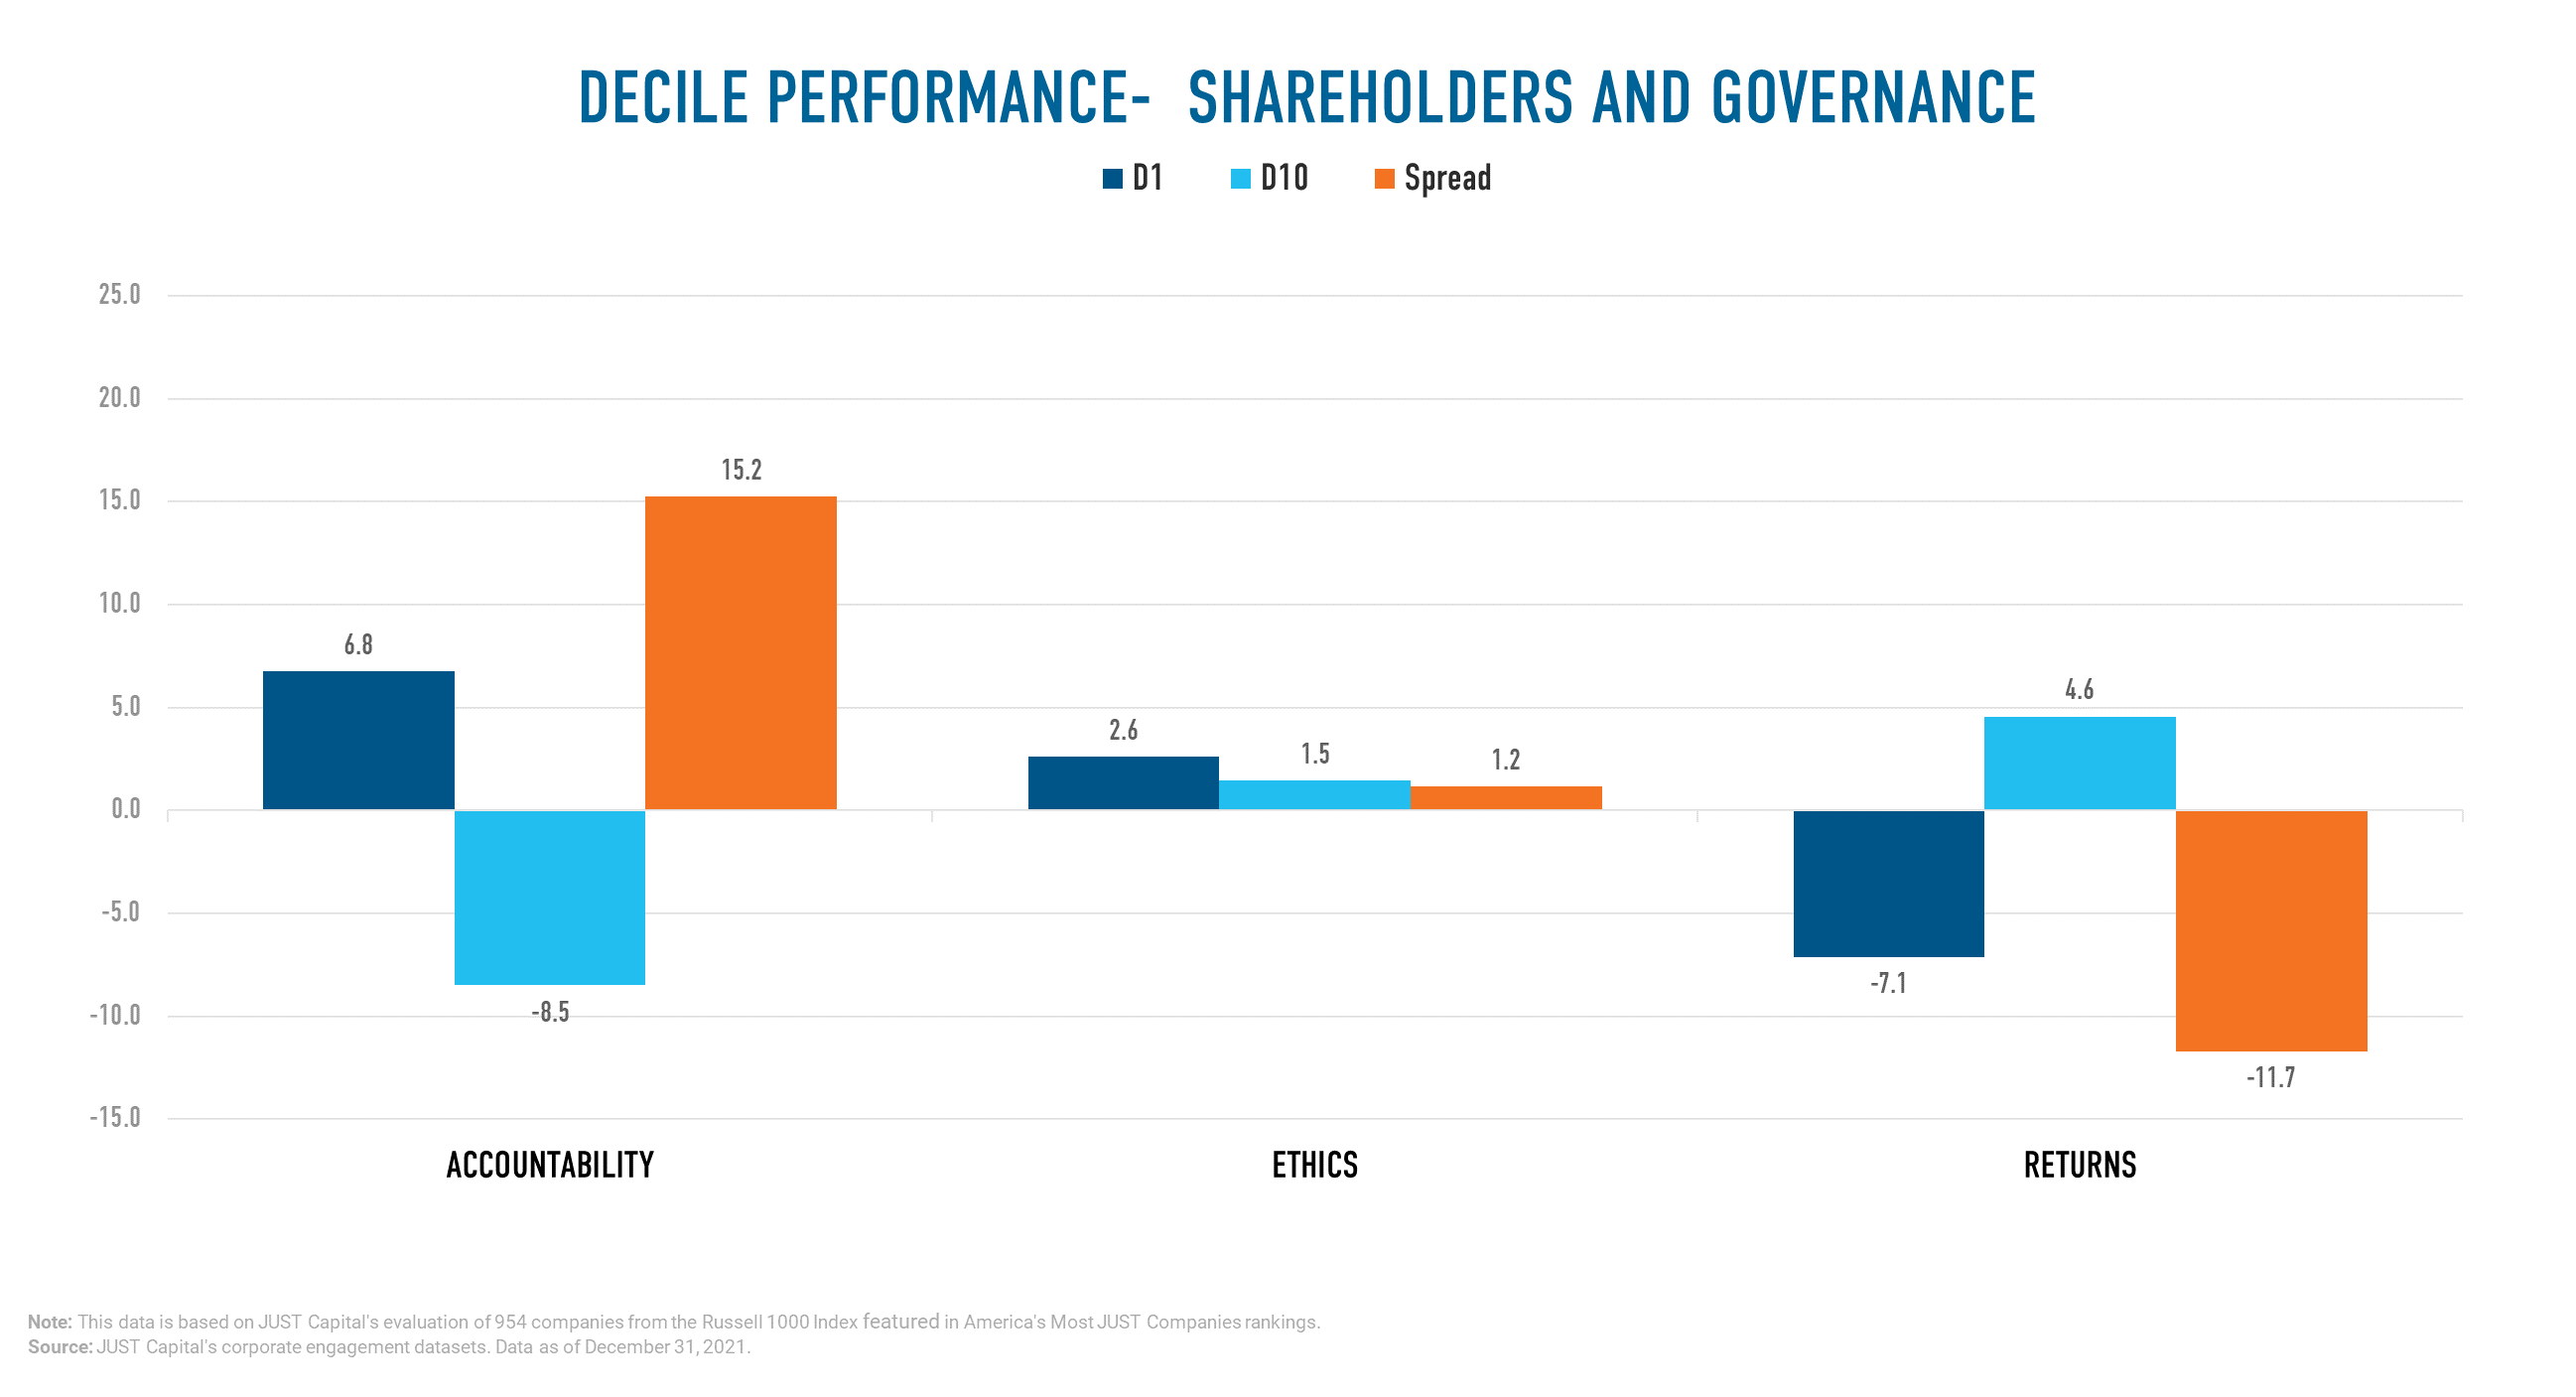
YTD we saw Accountability outperform the other Shareholder and Governance Issues, with a long-short spread of 15.24%. Returns was a negative contributor to performance, and Ethics exhibited close to neutral performance.
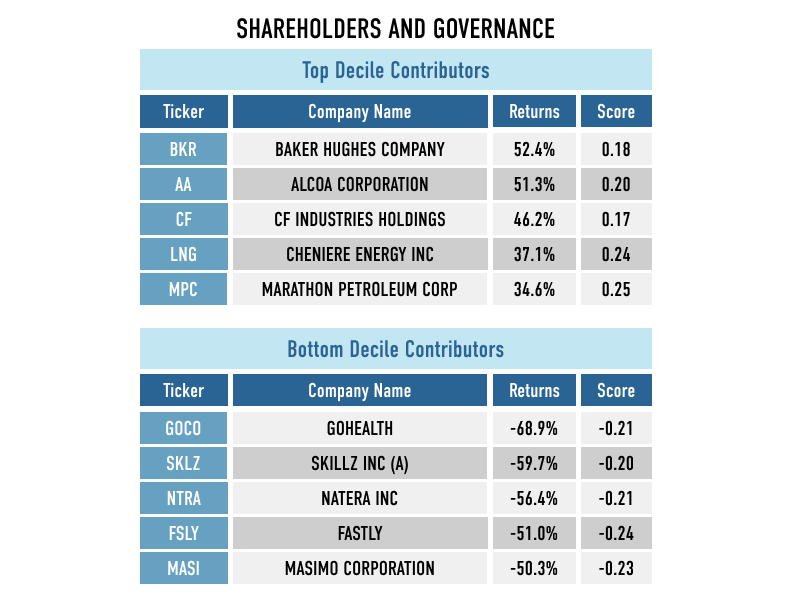
Shown below are the both top and bottom five contributors to the top decile (D1), the best-ranked companies as measured by their Shareholders and Governance score, and the bottom decile (D10), the worst-ranked companies as measured by their Shareholders and Governance score.
Customers Performance
The Customers stakeholder measures a company across four Issues:
- Privacy – Protects customer privacy.
- Experience – Treats customers fairly.
- Transparency – Communicates transparently.
- Beneficial Products – Makes beneficial products.
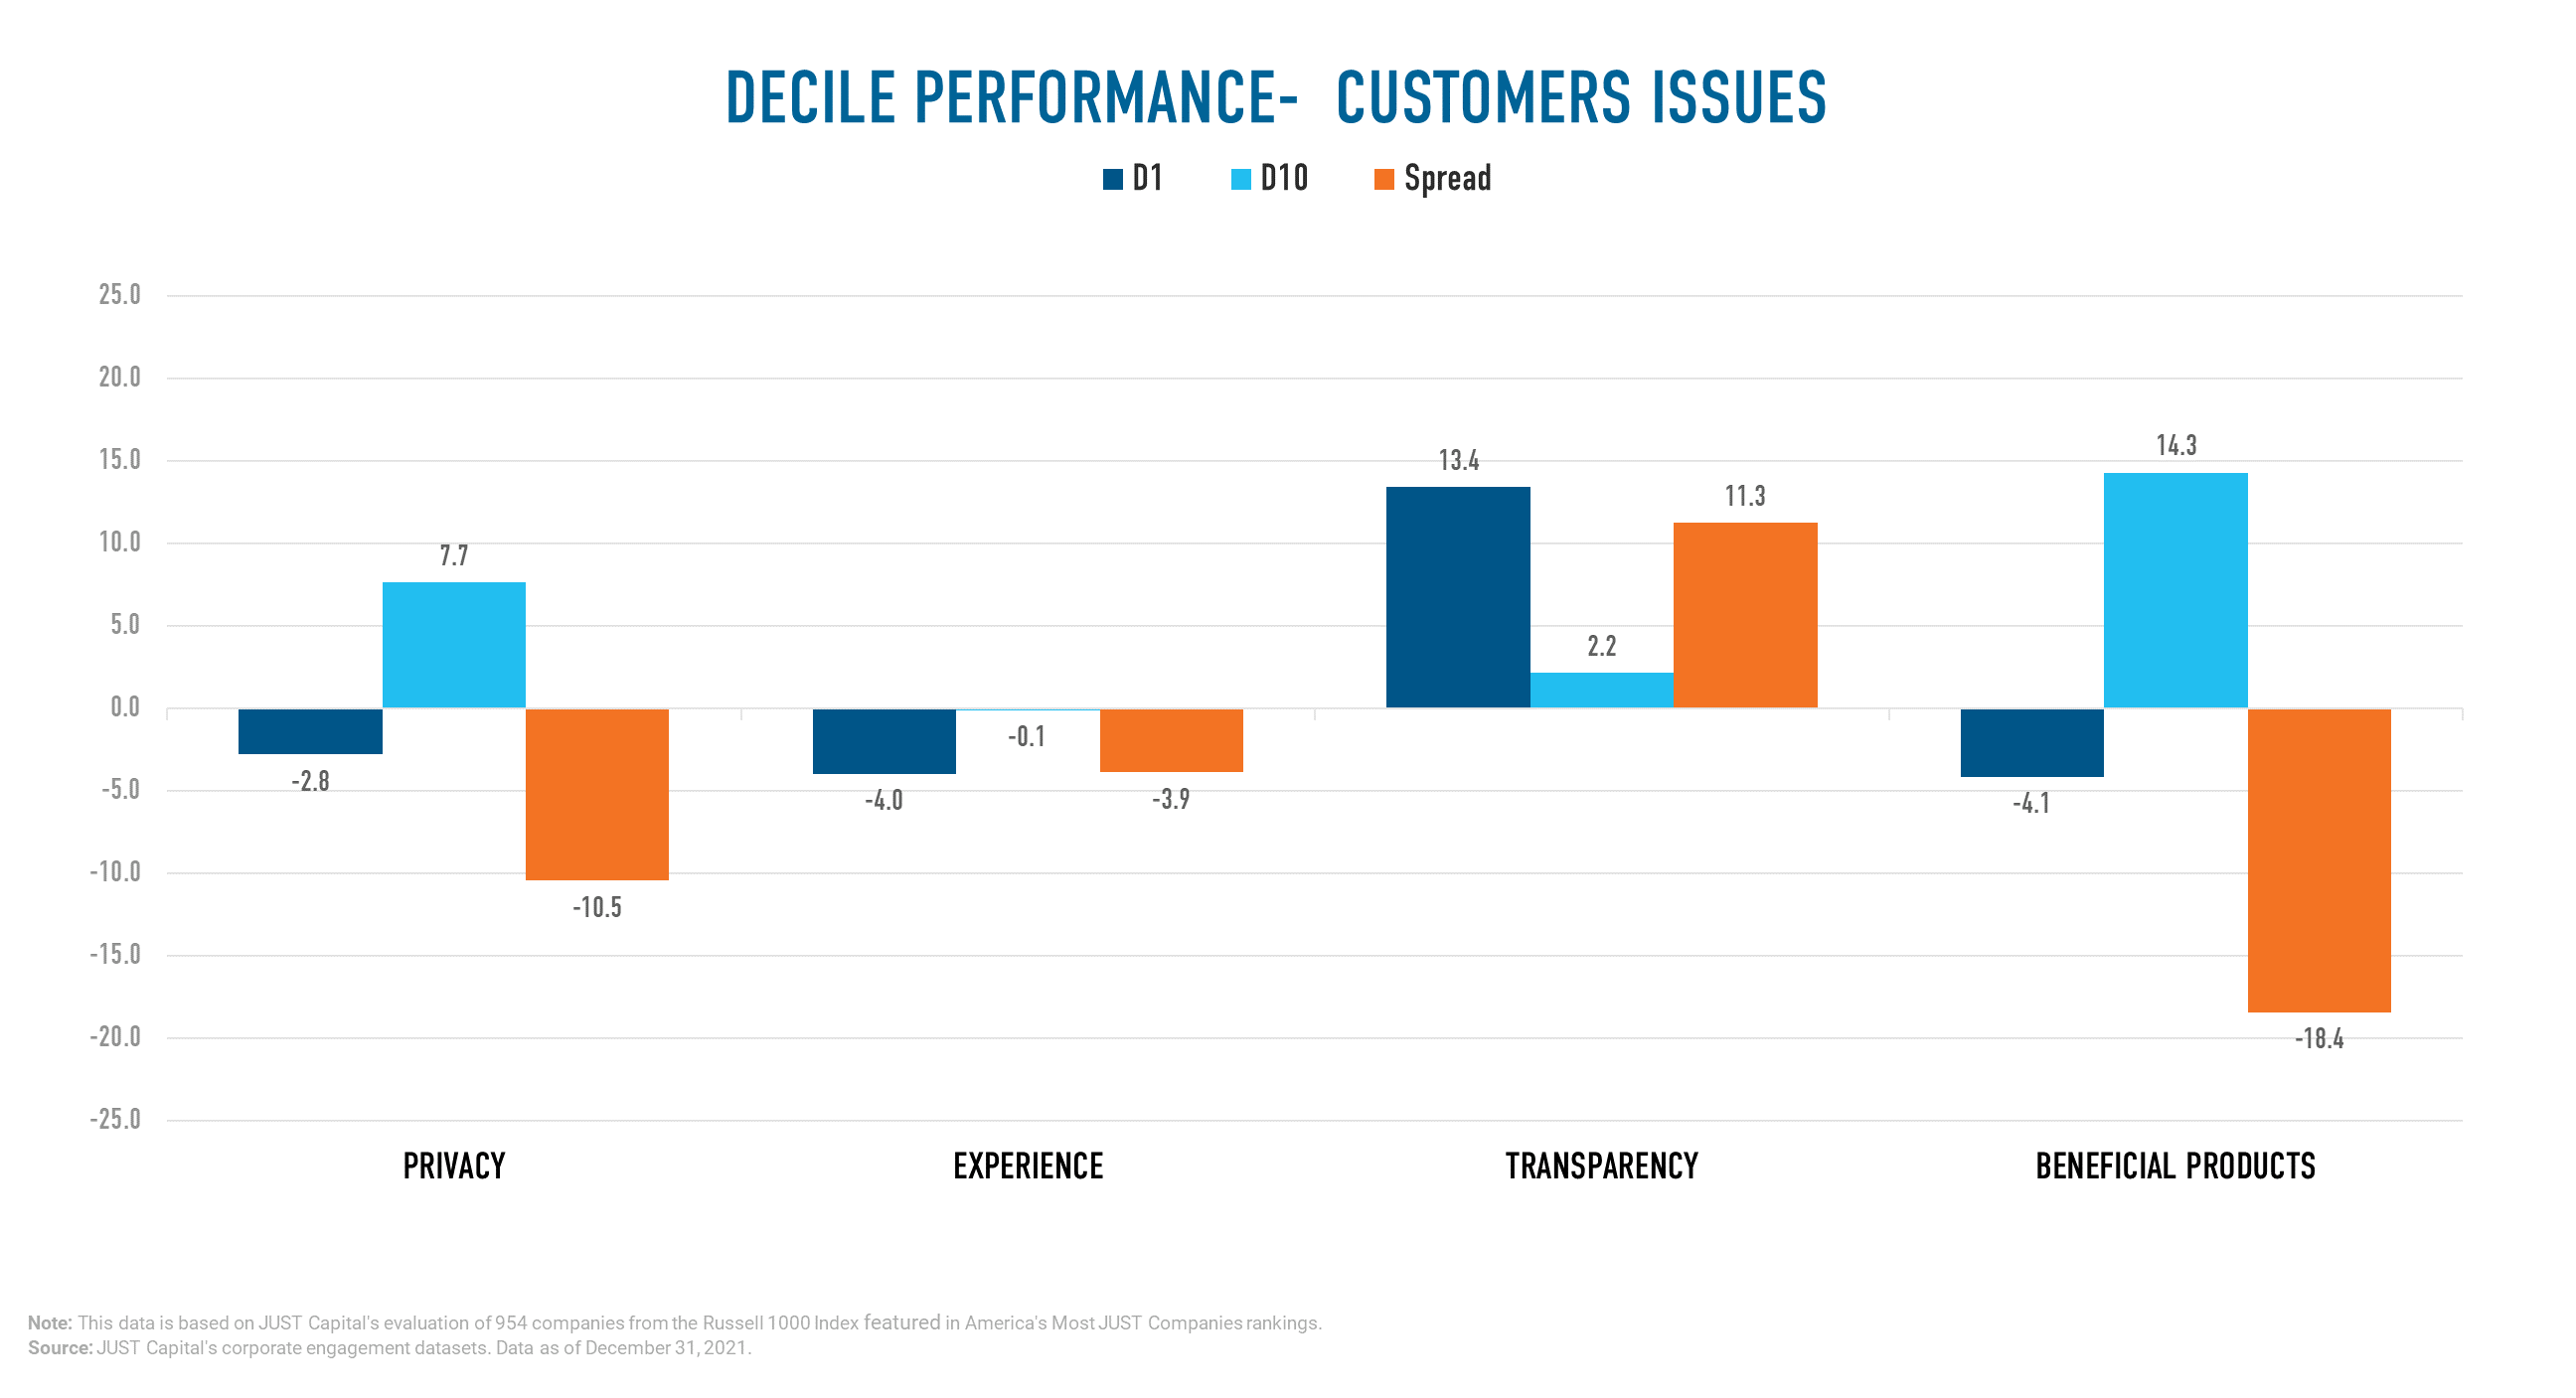
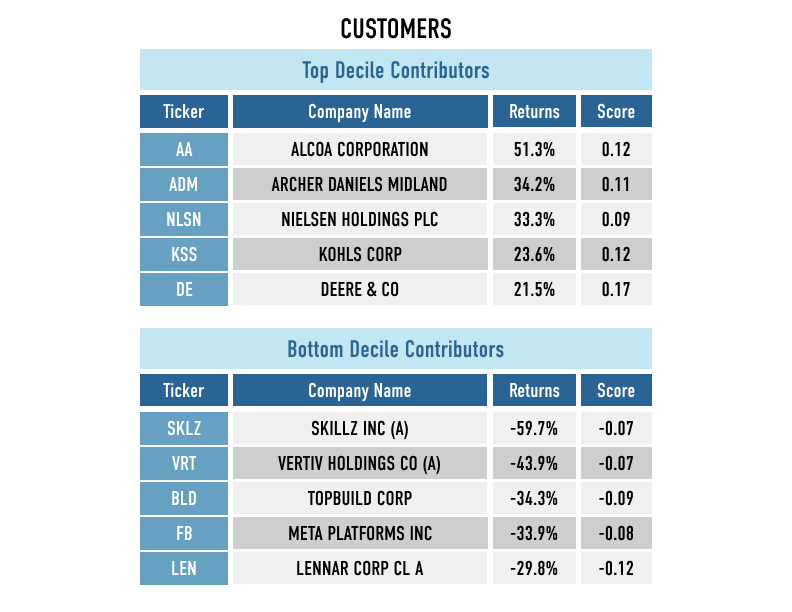
YTD we saw the Transparency outperform the other Customer Issues with a long-short spread of 11.26%. Beneficial Products, Privacy, and Experience were negative contributors to Customer performance.
Shown below are the both top and bottom five contributors to the top decile (D1), the best-ranked companies as measured by their Customer score, and the bottom decile (D10), the worst-ranked names as measured by Customer score.
Environment Performance
The Environment stakeholder measures a company across four Issues:
- Sustainable Products – Develops and supports sustainable products.
- Pollution Reduction – Minimizes pollution.
- Climate Change – Helps combat climate change.
- Resource Efficiency – Uses resources efficiently.
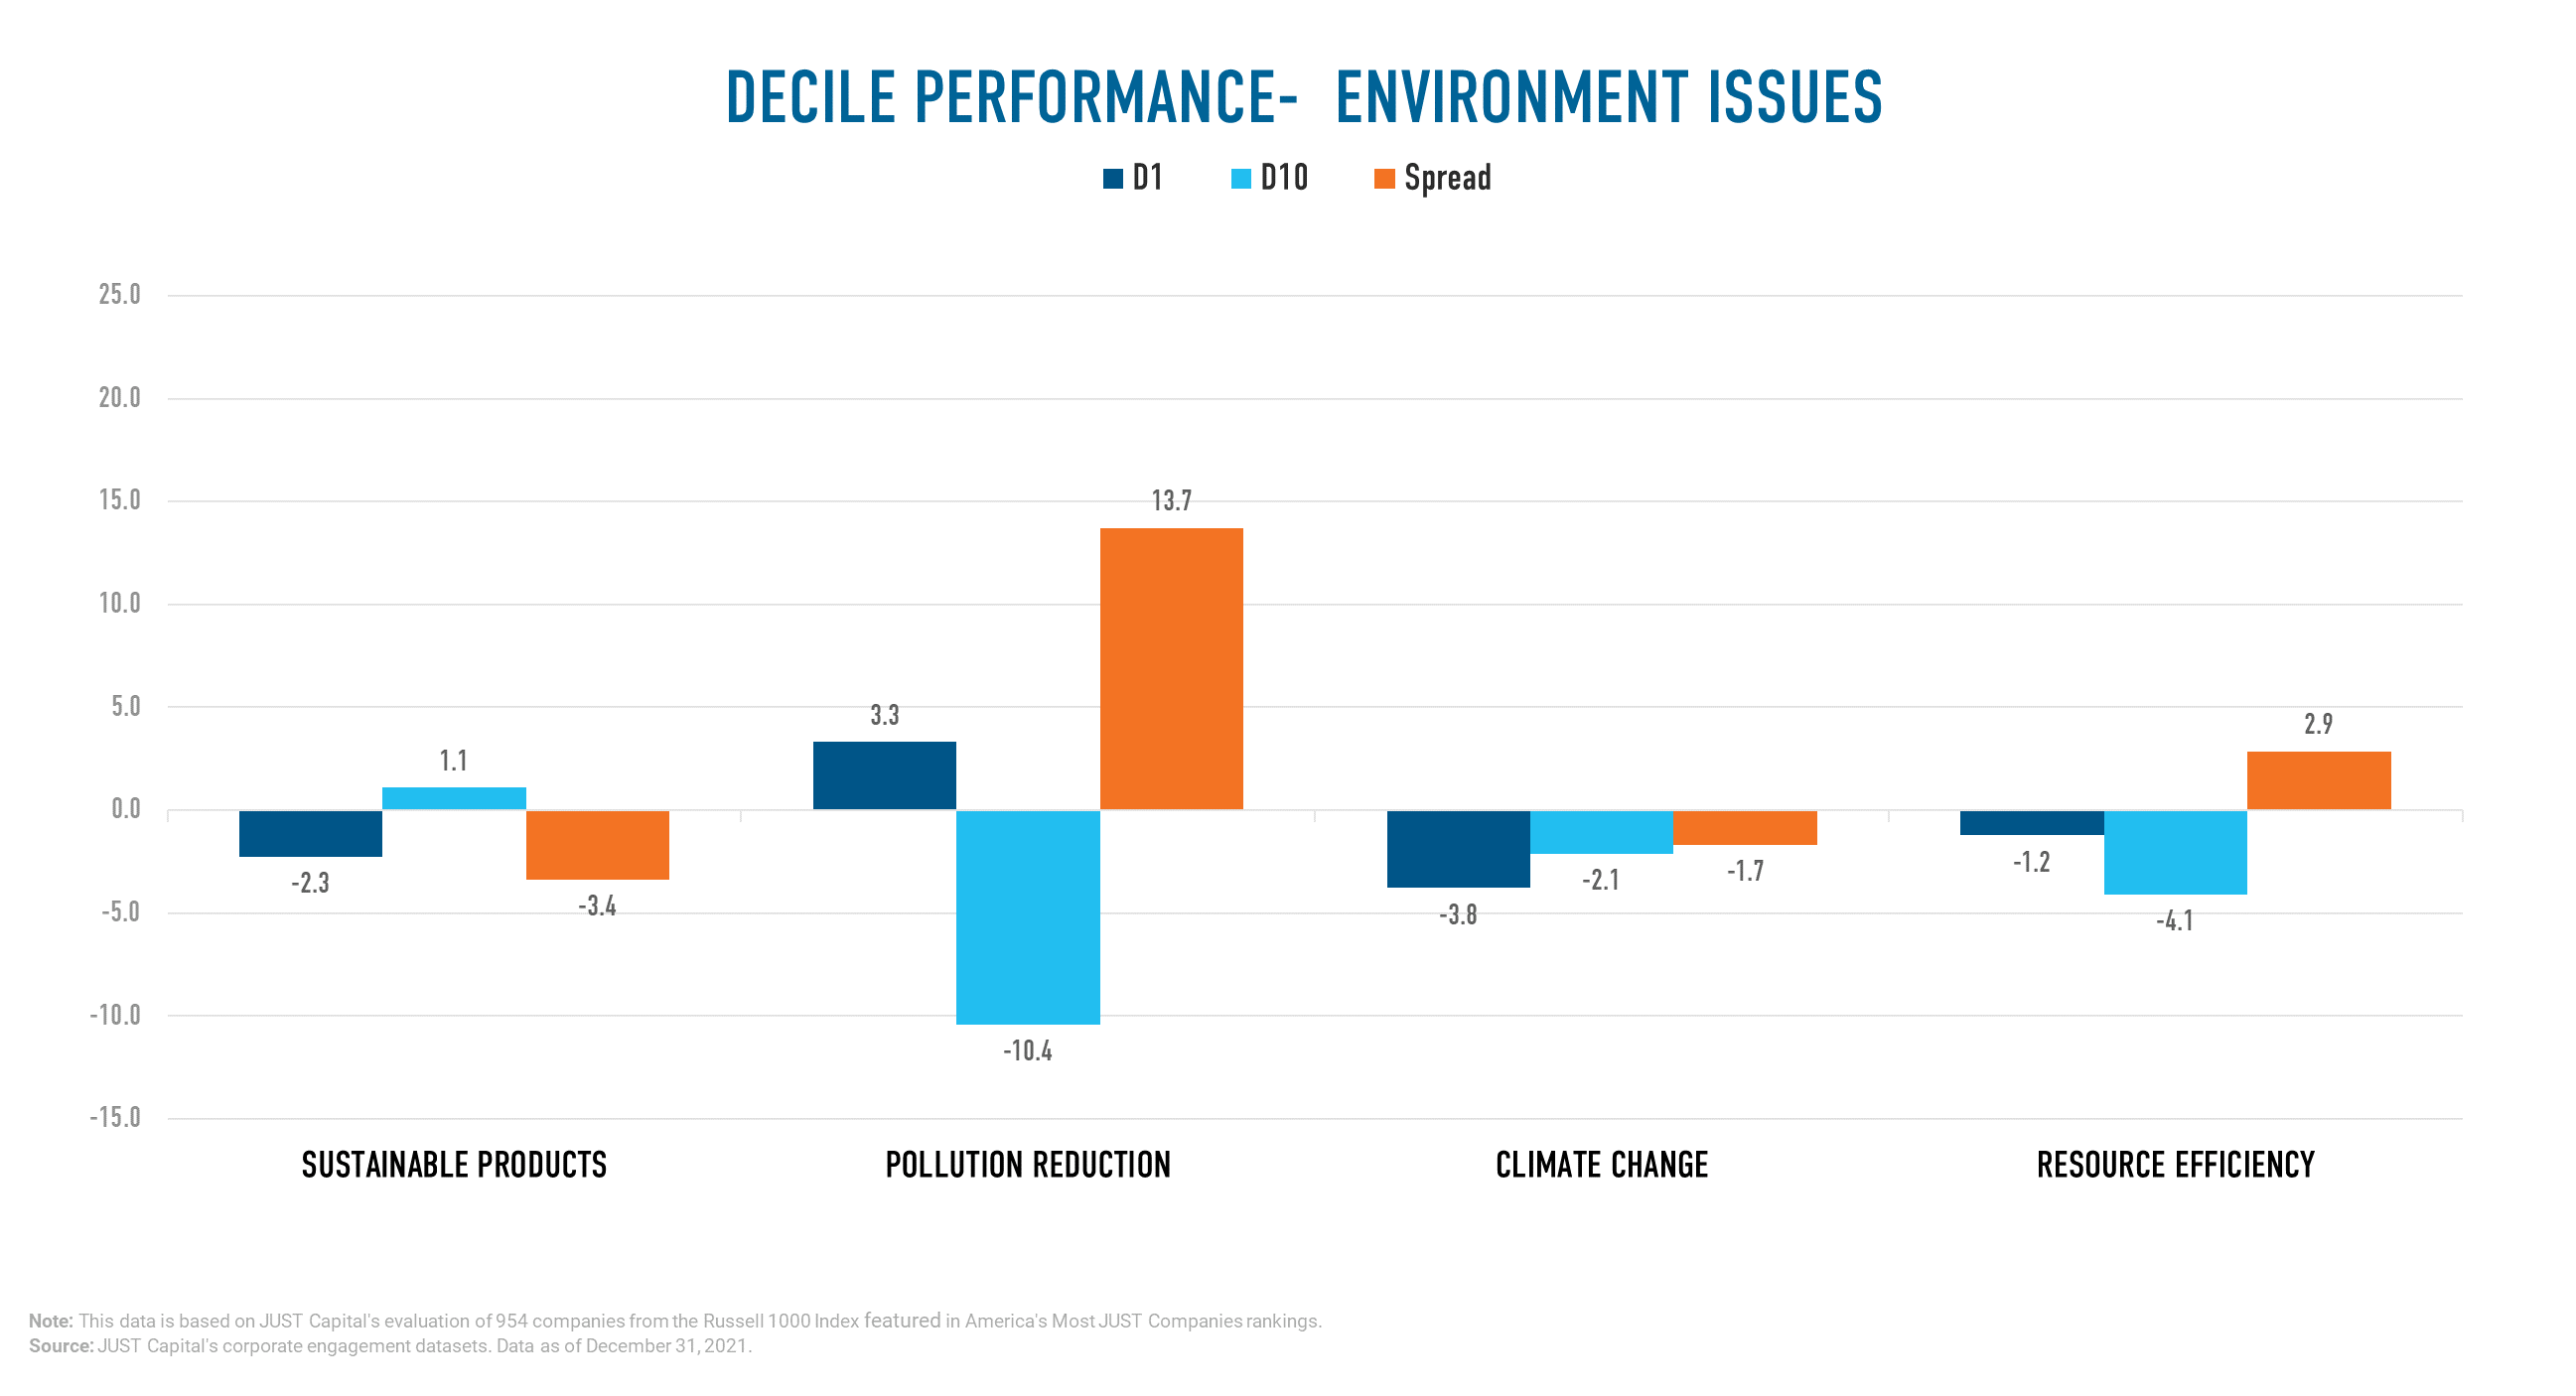
YTD we saw Pollution Reduction outperform other Environment Issues. Resource Efficiency was also positive, while Sustainable Products and Climate Change had negative performance.
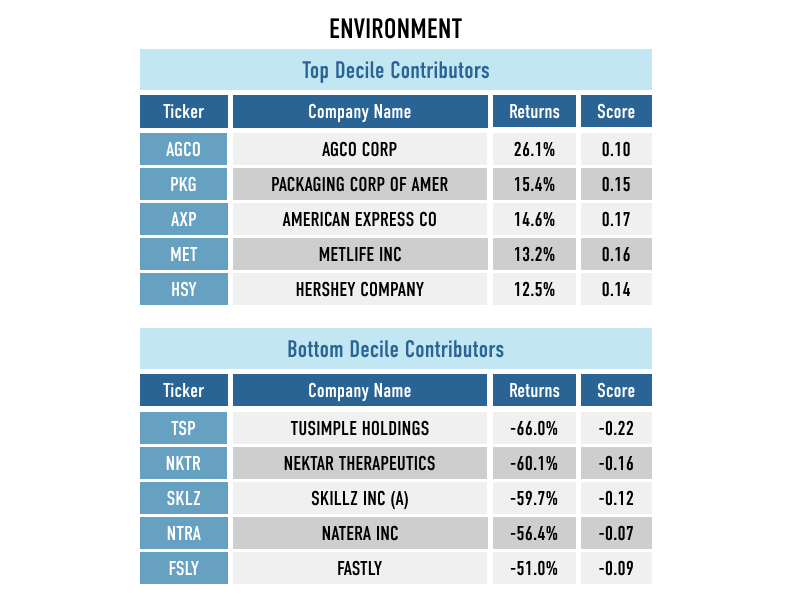
Shown below are the both top and bottom five contributors to the top decile (D1), the best-ranked companies as measured by their Environmental score, and the bottom decile (D10), the worst-ranked companies as measured by their Environmental score.
Appendix
Computation Methodology
We monitor the performance of these stakeholders and Issues on a long-short basis. The long and short portfolios are selected based on the factor scores as the top and bottom deciles within the universe of companies we track in the Russell 1000. Top decile (D1) companies are those that rank highest based on the factor score, and bottom decile (D10) companies are those that rank lowest based on the factor score.
D1 Performance is computed as (Equally weighted average of returns of stocks in D1 bucket) – (Equally weighted average of returns of all stocks within the Universe).
D10 Performance is computed as (Equally weighted average of returns of stocks in D10 bucket) – (Equally weighted average of returns of all stocks within the Universe).
Spread is computed as D1 Performance – D10 Performance.