JUST Report
Companies That Prioritize Their Workers Outperformed Peers in Q3
- More Reports
- View all JUST Reports
November 1, 2022
Report by Director of Quantitative Research & Analytics Mona Patni.
JUST Capital’s Quarterly Review of Stakeholder Performance – Q3 2022
Markets remained very volatile in Q3 2022. Global markets fell in the third quarter as inflation remained near multi-decade highs, geopolitical tensions escalated, and the Federal Reserve reaffirmed its commitment to raising interest rates to fight inflation. The Russell 1000 index after a rally in July returned -4.6% in Q3 after FOMC meeting minutes and Fed member speeches stoked fears the Fed could tighten too much and push the economy into recession. With respect to sector performance, the communication services sector was the worst performing sector over the quarter, along with real estate. The consumer discretionary was the best performing sector followed by energy.
During this challenging period, JUST Capital found that two of the five stakeholders we track delivered positive performance, with the exception of the Environment, Customers and Shareholders. The Workers stakeholder delivered the best performance over this period with a long-short spread of 2.05%. Within the Environment and Customers stakeholders, underperformance was driven by both deciles, with the top decile underperforming and bottom decile outperforming, and within the Shareholders stakeholder, underperformance was primarily driven by the bottom decile.
JUST Capital’s Overall Weighted Score takes into account the 20 core Issues determined through our survey research – including paying a living wage, creating a diverse, inclusive workplace, and helping combat climate change – across key business stakeholders: Workers, Communities, Shareholders and Governance, Customers, and Environment. This Overall Weighted Score had a negative long-short spread of -0.64% over the period ending September 30, 2022.
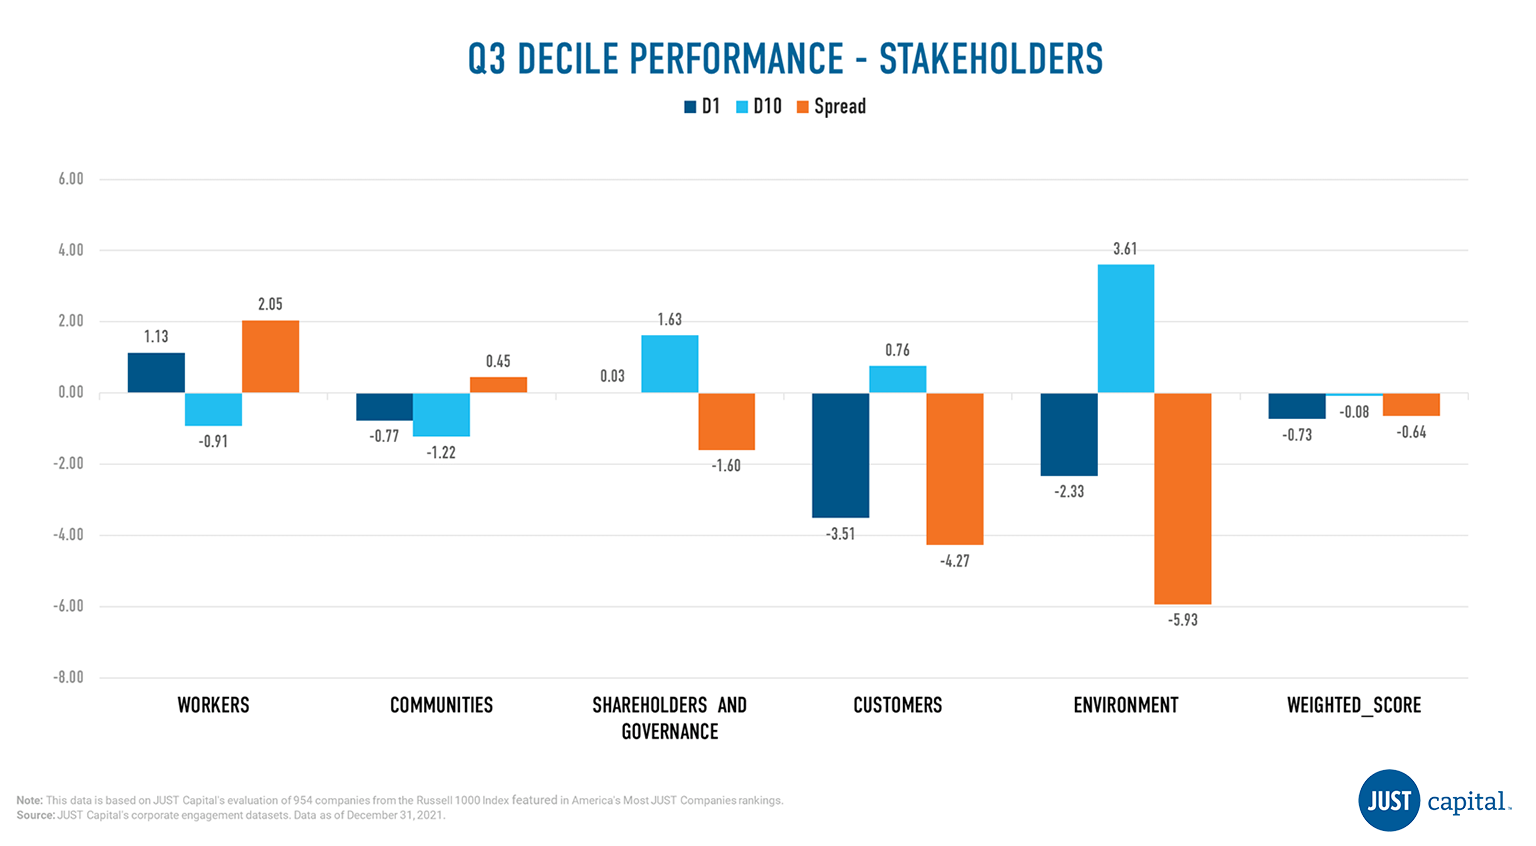
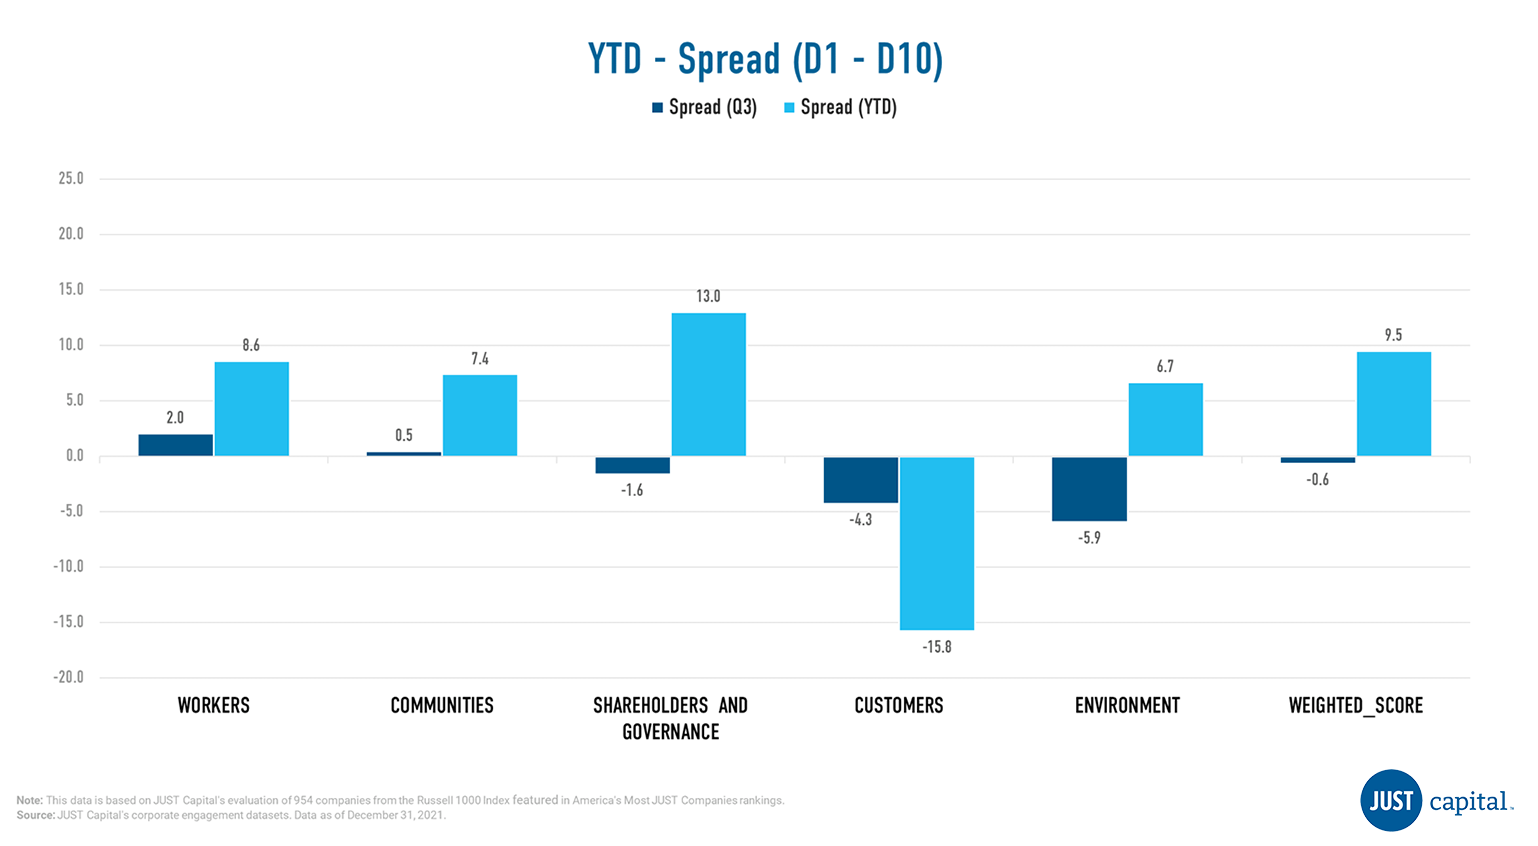
Shown below is the Year-to-Date (YTD) and Q3 performance, which is quantified by the spread between the top and bottom deciles of all the stakeholders and the overall weighted score.
Workers Performance
The Workers stakeholder measures a company across five Issues:
- Wages – Pays a fair, living wage.
- Health – Protects worker health and safety.
- Benefits – Provides benefits and work-life balance.
- Diversity, Equity, and Inclusion (DEI) – Cultivates a diverse, inclusive workplace.
- Careers – Invests in workforce training.
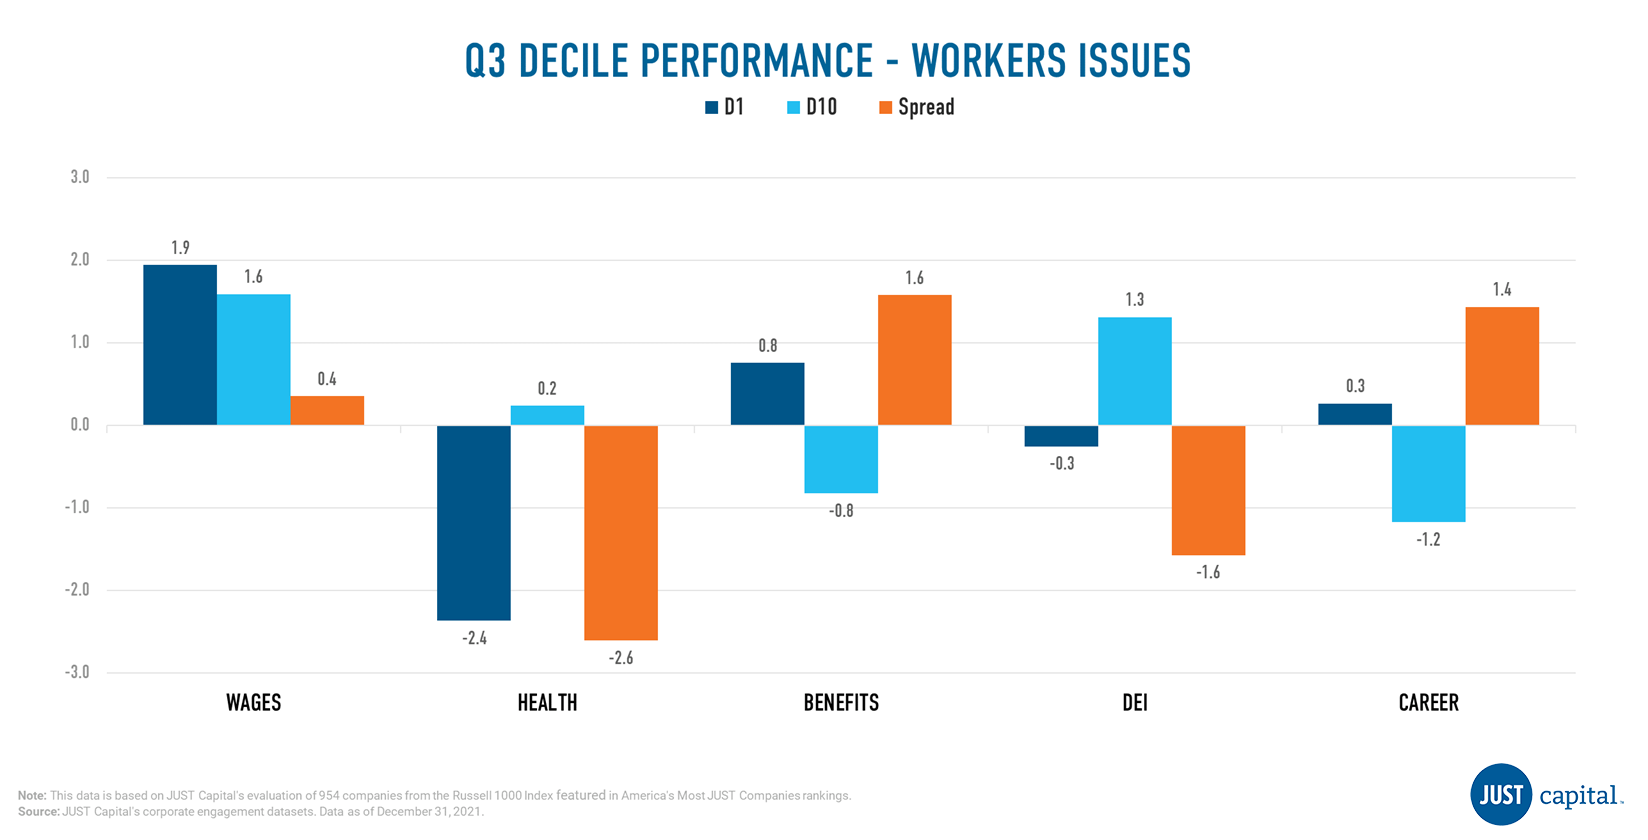
In Q3, we saw three out of five Worker Issues outperform. Underperformance in Health and DEI was driven by negative performance from both top and bottom decile companies.
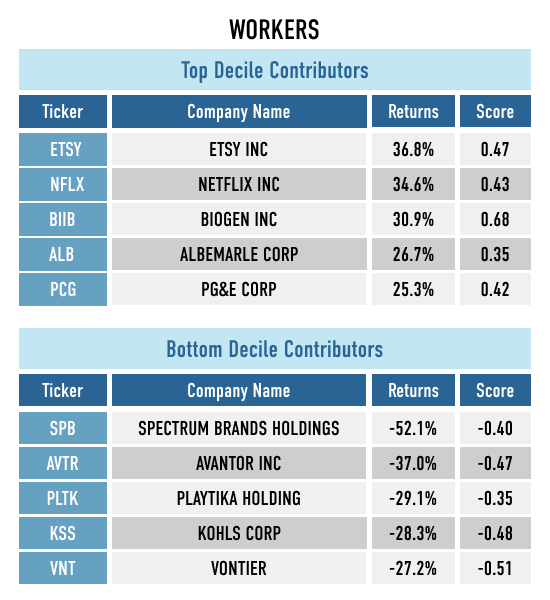
Shown below are the top and bottom five contributors to the top decile (D1), the top-ranked companies as measured by their Workers score, and the bottom decile (D10), the lowest-ranked companies as measured by their Worker score.
Communities Performance
The Communities stakeholder measures a company across four Issues:
- Jobs – Creates jobs in the U.S.
- Supply Chain – Respects human rights in the supply chain.
- Community Development – Contributes to community development.
- Philanthropy – Gives back to local communities.
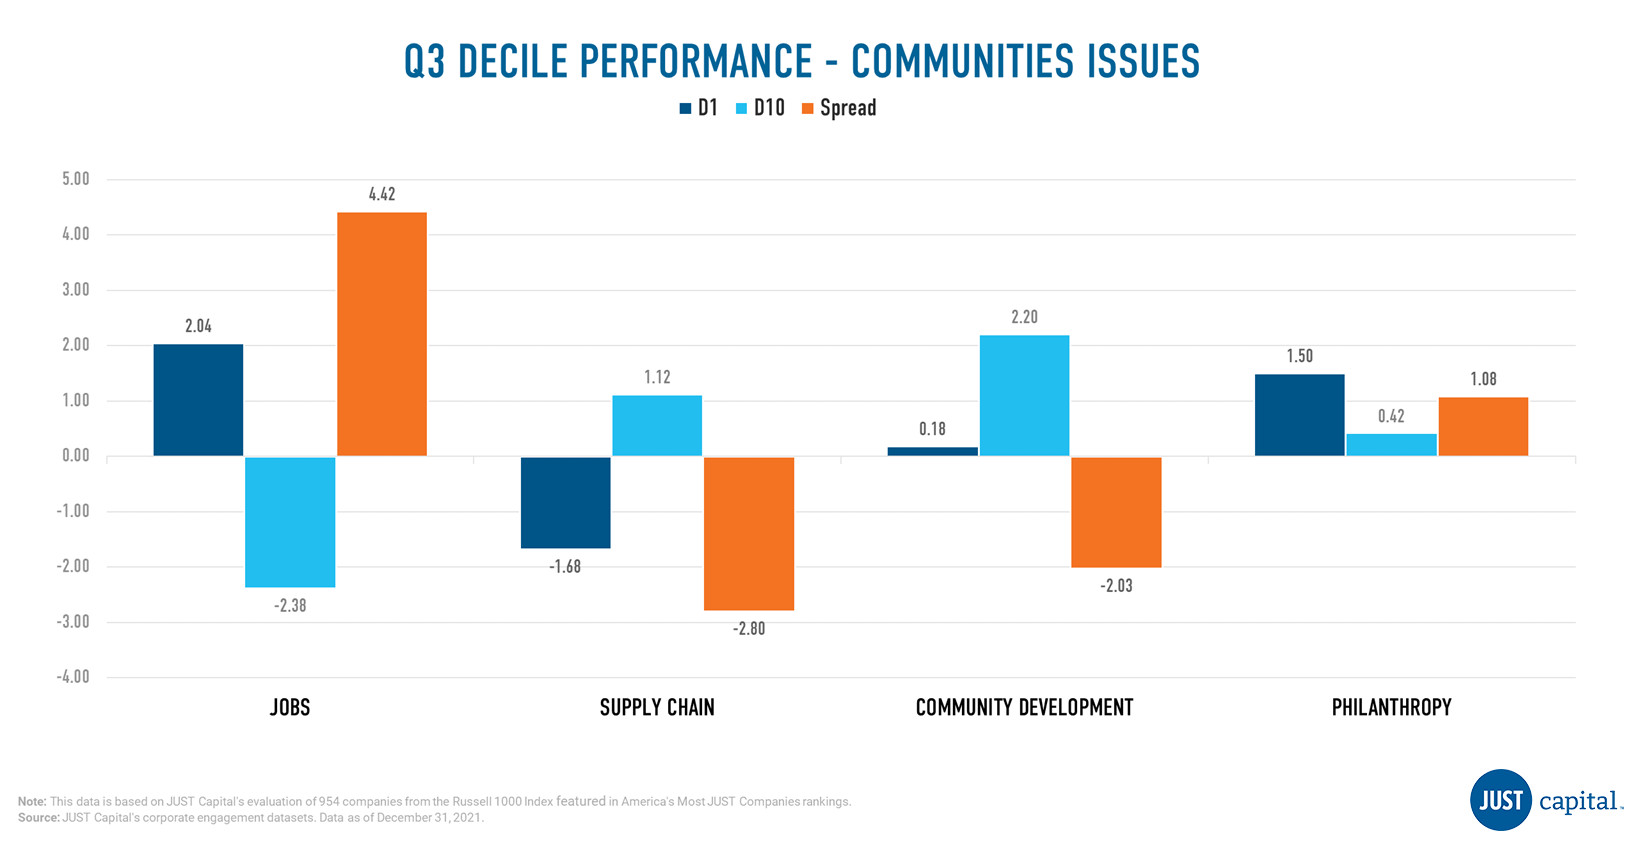
Jobs and Philanthropy within Communities were positive contributors to the stakeholder’s performance whereas Supply Chain and Community Development didn’t add to performance.
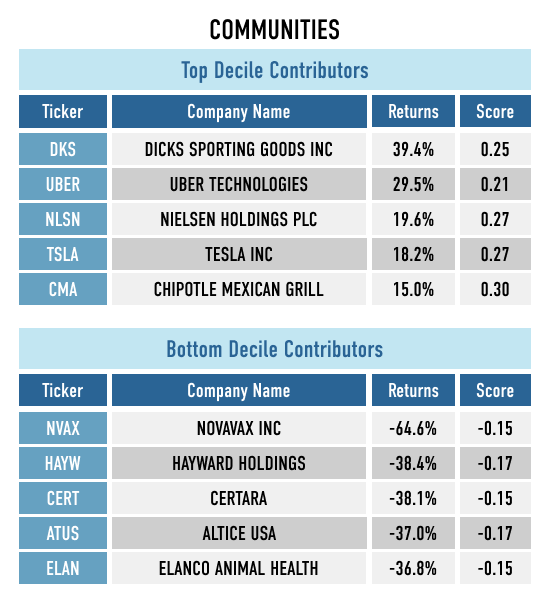
Shown below are the both top and bottom five contributors to the top decile (D1), the best-ranked companies as measured by their Communities score, and the bottom decile (D10), the worst-ranked companies as measured by their Communities score.
Shareholders and Governance Performance
The Shareholders and Governance stakeholder measures a company across three Issues:
- Accountability – Priotitizes accountability to all stakeholders.
- Ethics – Acts ethically at the leadership level.
- Returns – Generates returns for investors.
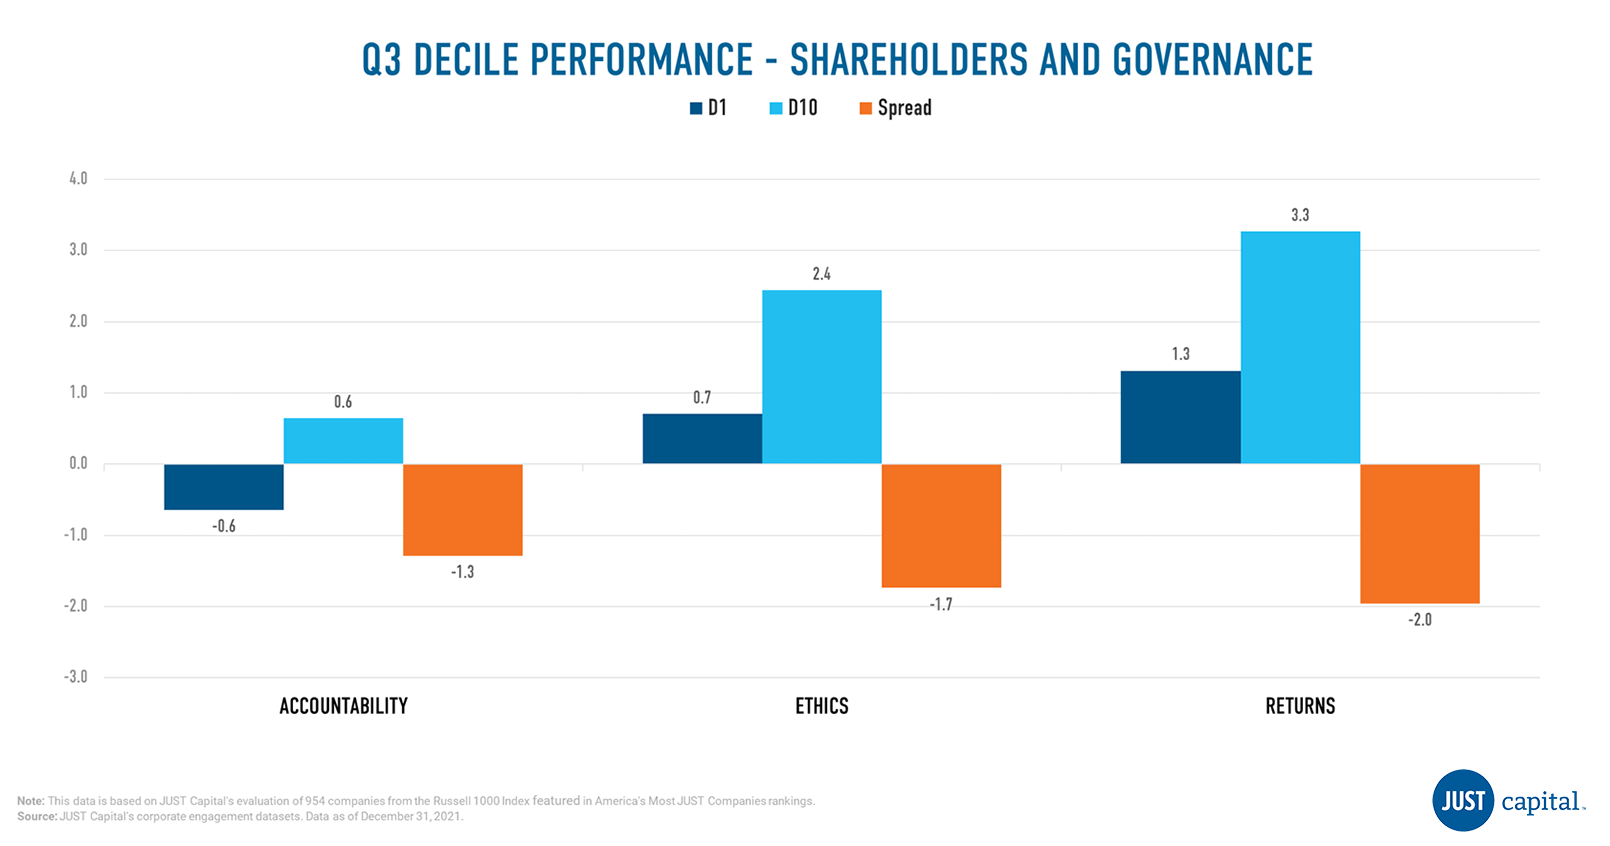
In Q3 we saw the Returns issue under-perform the other Shareholder and Governance issues, with a long-short spread of -2%.
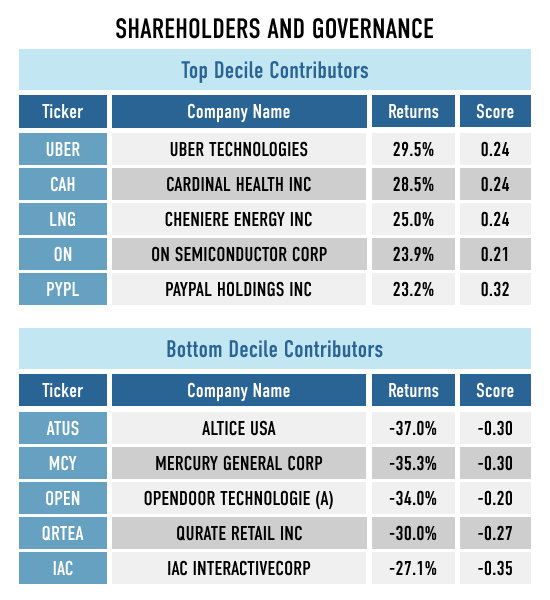
Shown below are the both top and bottom five contributors to the top decile (D1), the best-ranked companies as measured by their Shareholders and Governance score, and the bottom decile (D10), the worst-ranked companies as measured by their Shareholders and Governance score.
Customers Performance
The Customers stakeholder measures a company across four Issues:
- Privacy – Protects customer privacy.
- Experience – Treats customers fairly.
- Transparency – Communicates transparently.
- Beneficial Products – Makes beneficial products.
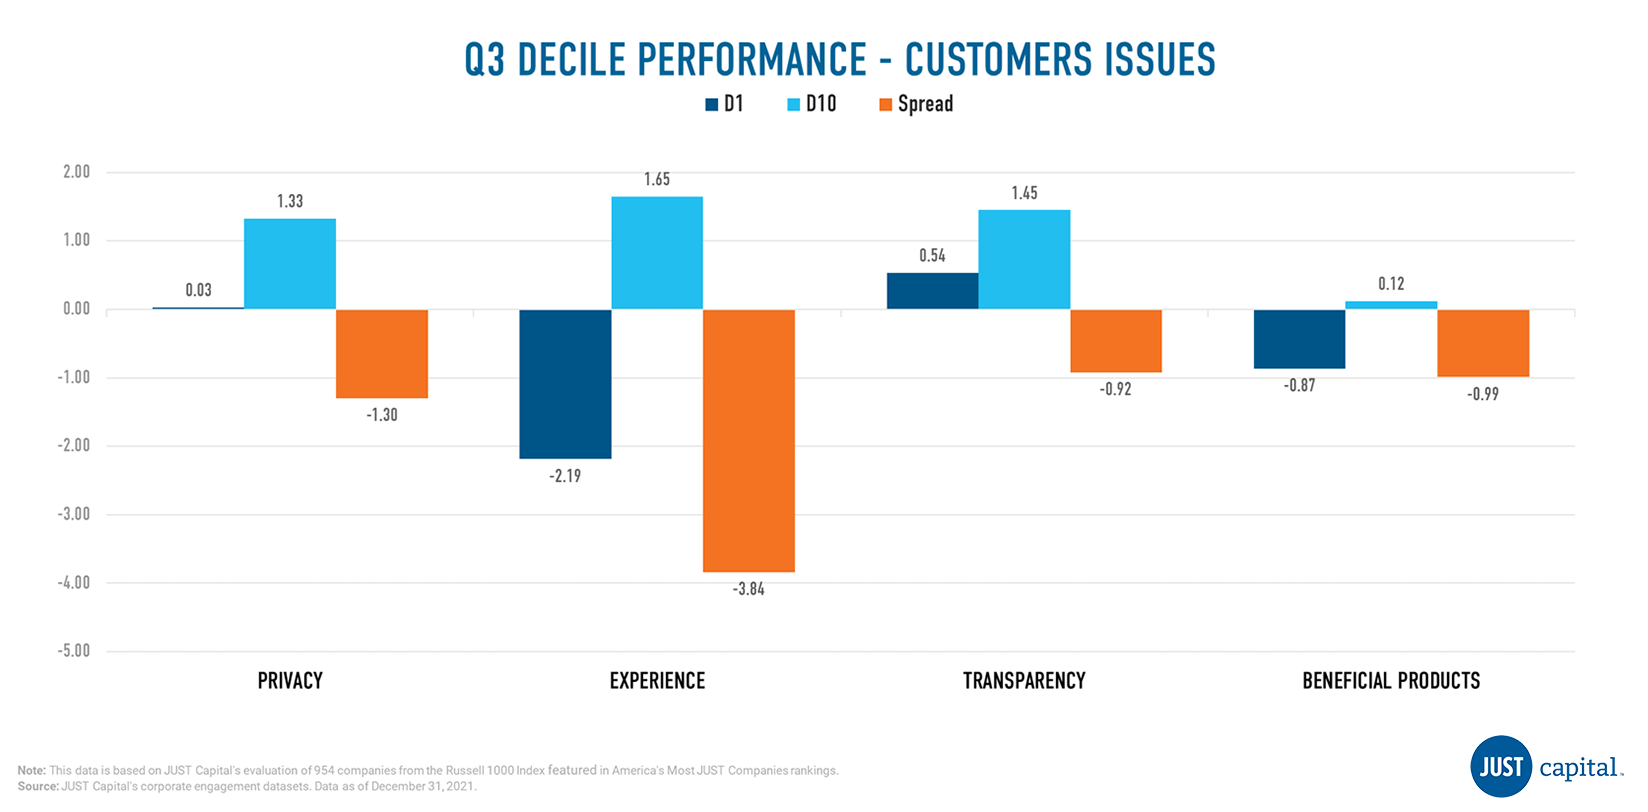
In Q3, we saw the Experience underperform the other Customer Issues, with a long-short spread of 3.8%. Beneficial Products, Privacy, and Transparency also were negative contributors to Customer performance.
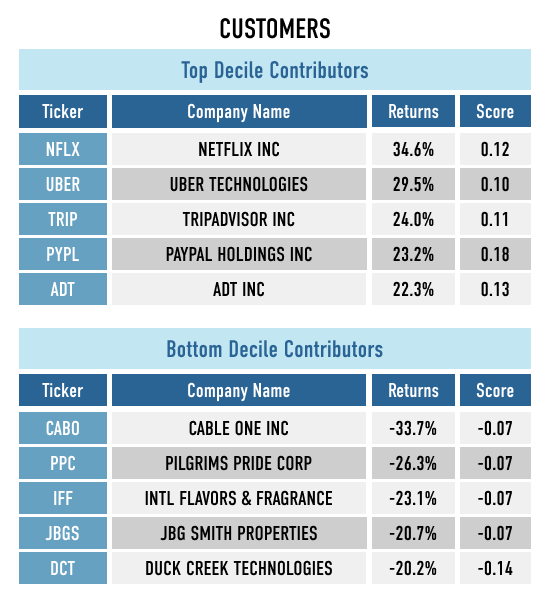
Shown below are the both top and bottom five contributors to the top decile (D1), the best-ranked companies as measured by their Customer score, and the bottom decile (D10), the worst-ranked names as measured by Customer score.
Environment Performance
The Environment stakeholder measures a company across four Issues:
- Sustainable Products – Develops and supports sustainable products.
- Pollution Reduction – Minimizes pollution.
- Climate Change – Helps combat climate change.
- Resource Efficiency – Uses resources efficiently.
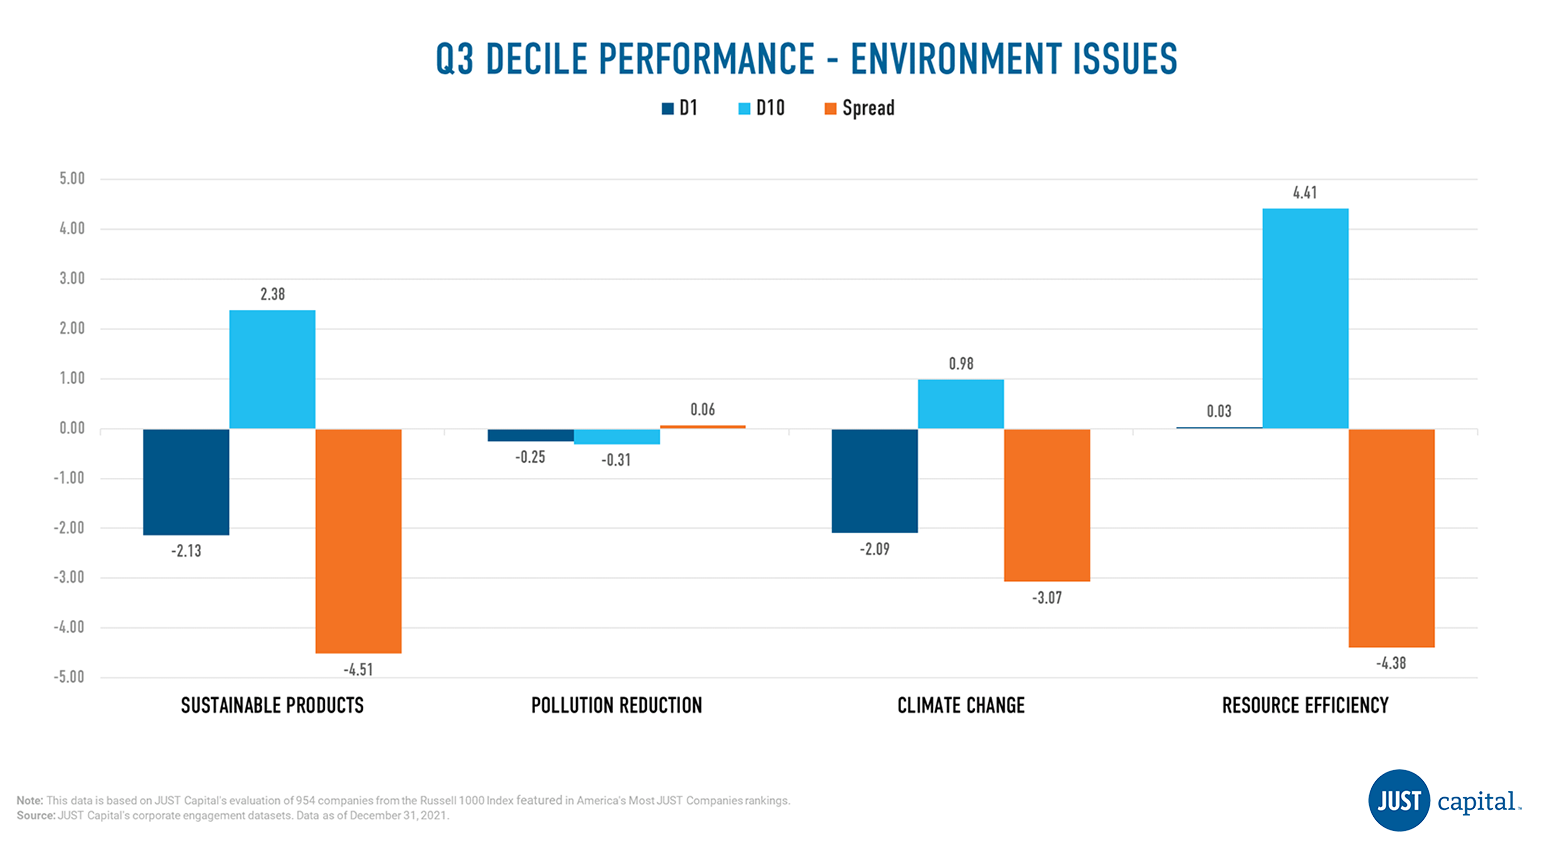
In Q3, we saw Pollution Reduction outperform other Environment Issues. Resource Efficiency, Sustainable Products and Climate Change delivered negative performance in this quarter.
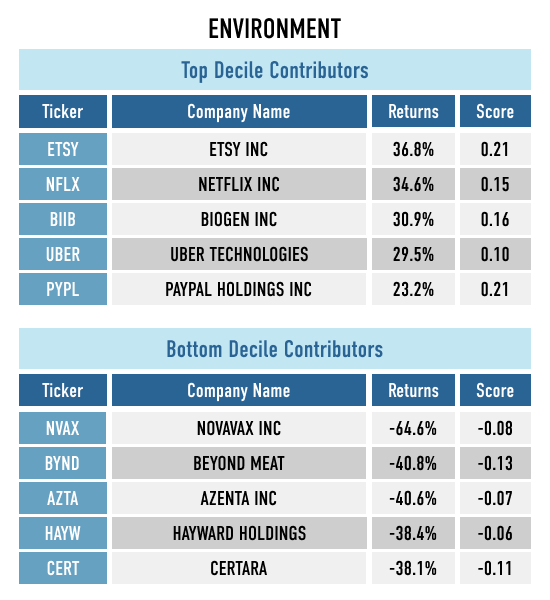
Shown below are the both top and bottom five contributors to the top decile (D1), the best-ranked companies as measured by their Environmental score, and the bottom decile (D10), the worst-ranked companies as measured by their Environment score.
Appendix
Computation Methodology
We monitor the performance of these stakeholders and Issues on a long-short basis. The long and short portfolios are selected based on the factor scores as the top and bottom deciles within the universe of companies we track in the Russell 1000. Top decile (D1) companies are those that rank highest based on the factor score, and bottom decile (D10) companies are those that rank lowest based on the factor score.
D1 Performance is computed as:
(Equally weighted average of returns of stocks in D1 bucket) – (Equally weighted average of returns of all stocks within the Universe)
D10 Performance is computed as:
(Equally weighted average of returns of stocks in D10 bucket) – (Equally weighted average of returns of all stocks within the Universe)
Spread is computed as:
D1 Performance – D10 Performance