JUST Report
The Companies That Prioritized Their Stakeholders Outperformed Their Peers in the Fourth Quarter
- More Reports
- View all JUST Reports
JUST Capital’s Quarterly Review of Stakeholder Performance – Q4 2022
January 19, 2023
By Mona Patni
2022 was a challenging and volatile year for both stock and bond markets. The war in Ukraine,a 40-year high in inflation, historically aggressive Fed rate hikes, and growing concerns about economic and earnings recessions were the main sources of bond and equity markets’ struggles. However, the final quarter of the year did bring some relief with gains in Q4 but still resulted in the worst year for the S&P 500 index since the Global Financial Crisis.
By market capitalization, large-caps slightly out-performed small-caps in the fourth quarter, but modestly outperformed throughout 2022. Large-cap outperformance and small-cap underperformance throughout 2022 was driven by concerns about future economic growth and higher interest rates. Value stocks massively outperformed growth stocks all year and that trend continued in the fourth quarter. Underwhelming earnings weighed on tech stocks in the final three months of the year, while concerns about slowing economic growth combined with rising bond yields hit richly valued tech stocks throughout 2022.
On a sector level, 10 of the 11 S&P 500 sectors finished the fourth quarter with a positive return, although only two of the 11 ended 2022 with gains. Energy outperformed other sectors not just in the fourth quarter but for all of 2022.
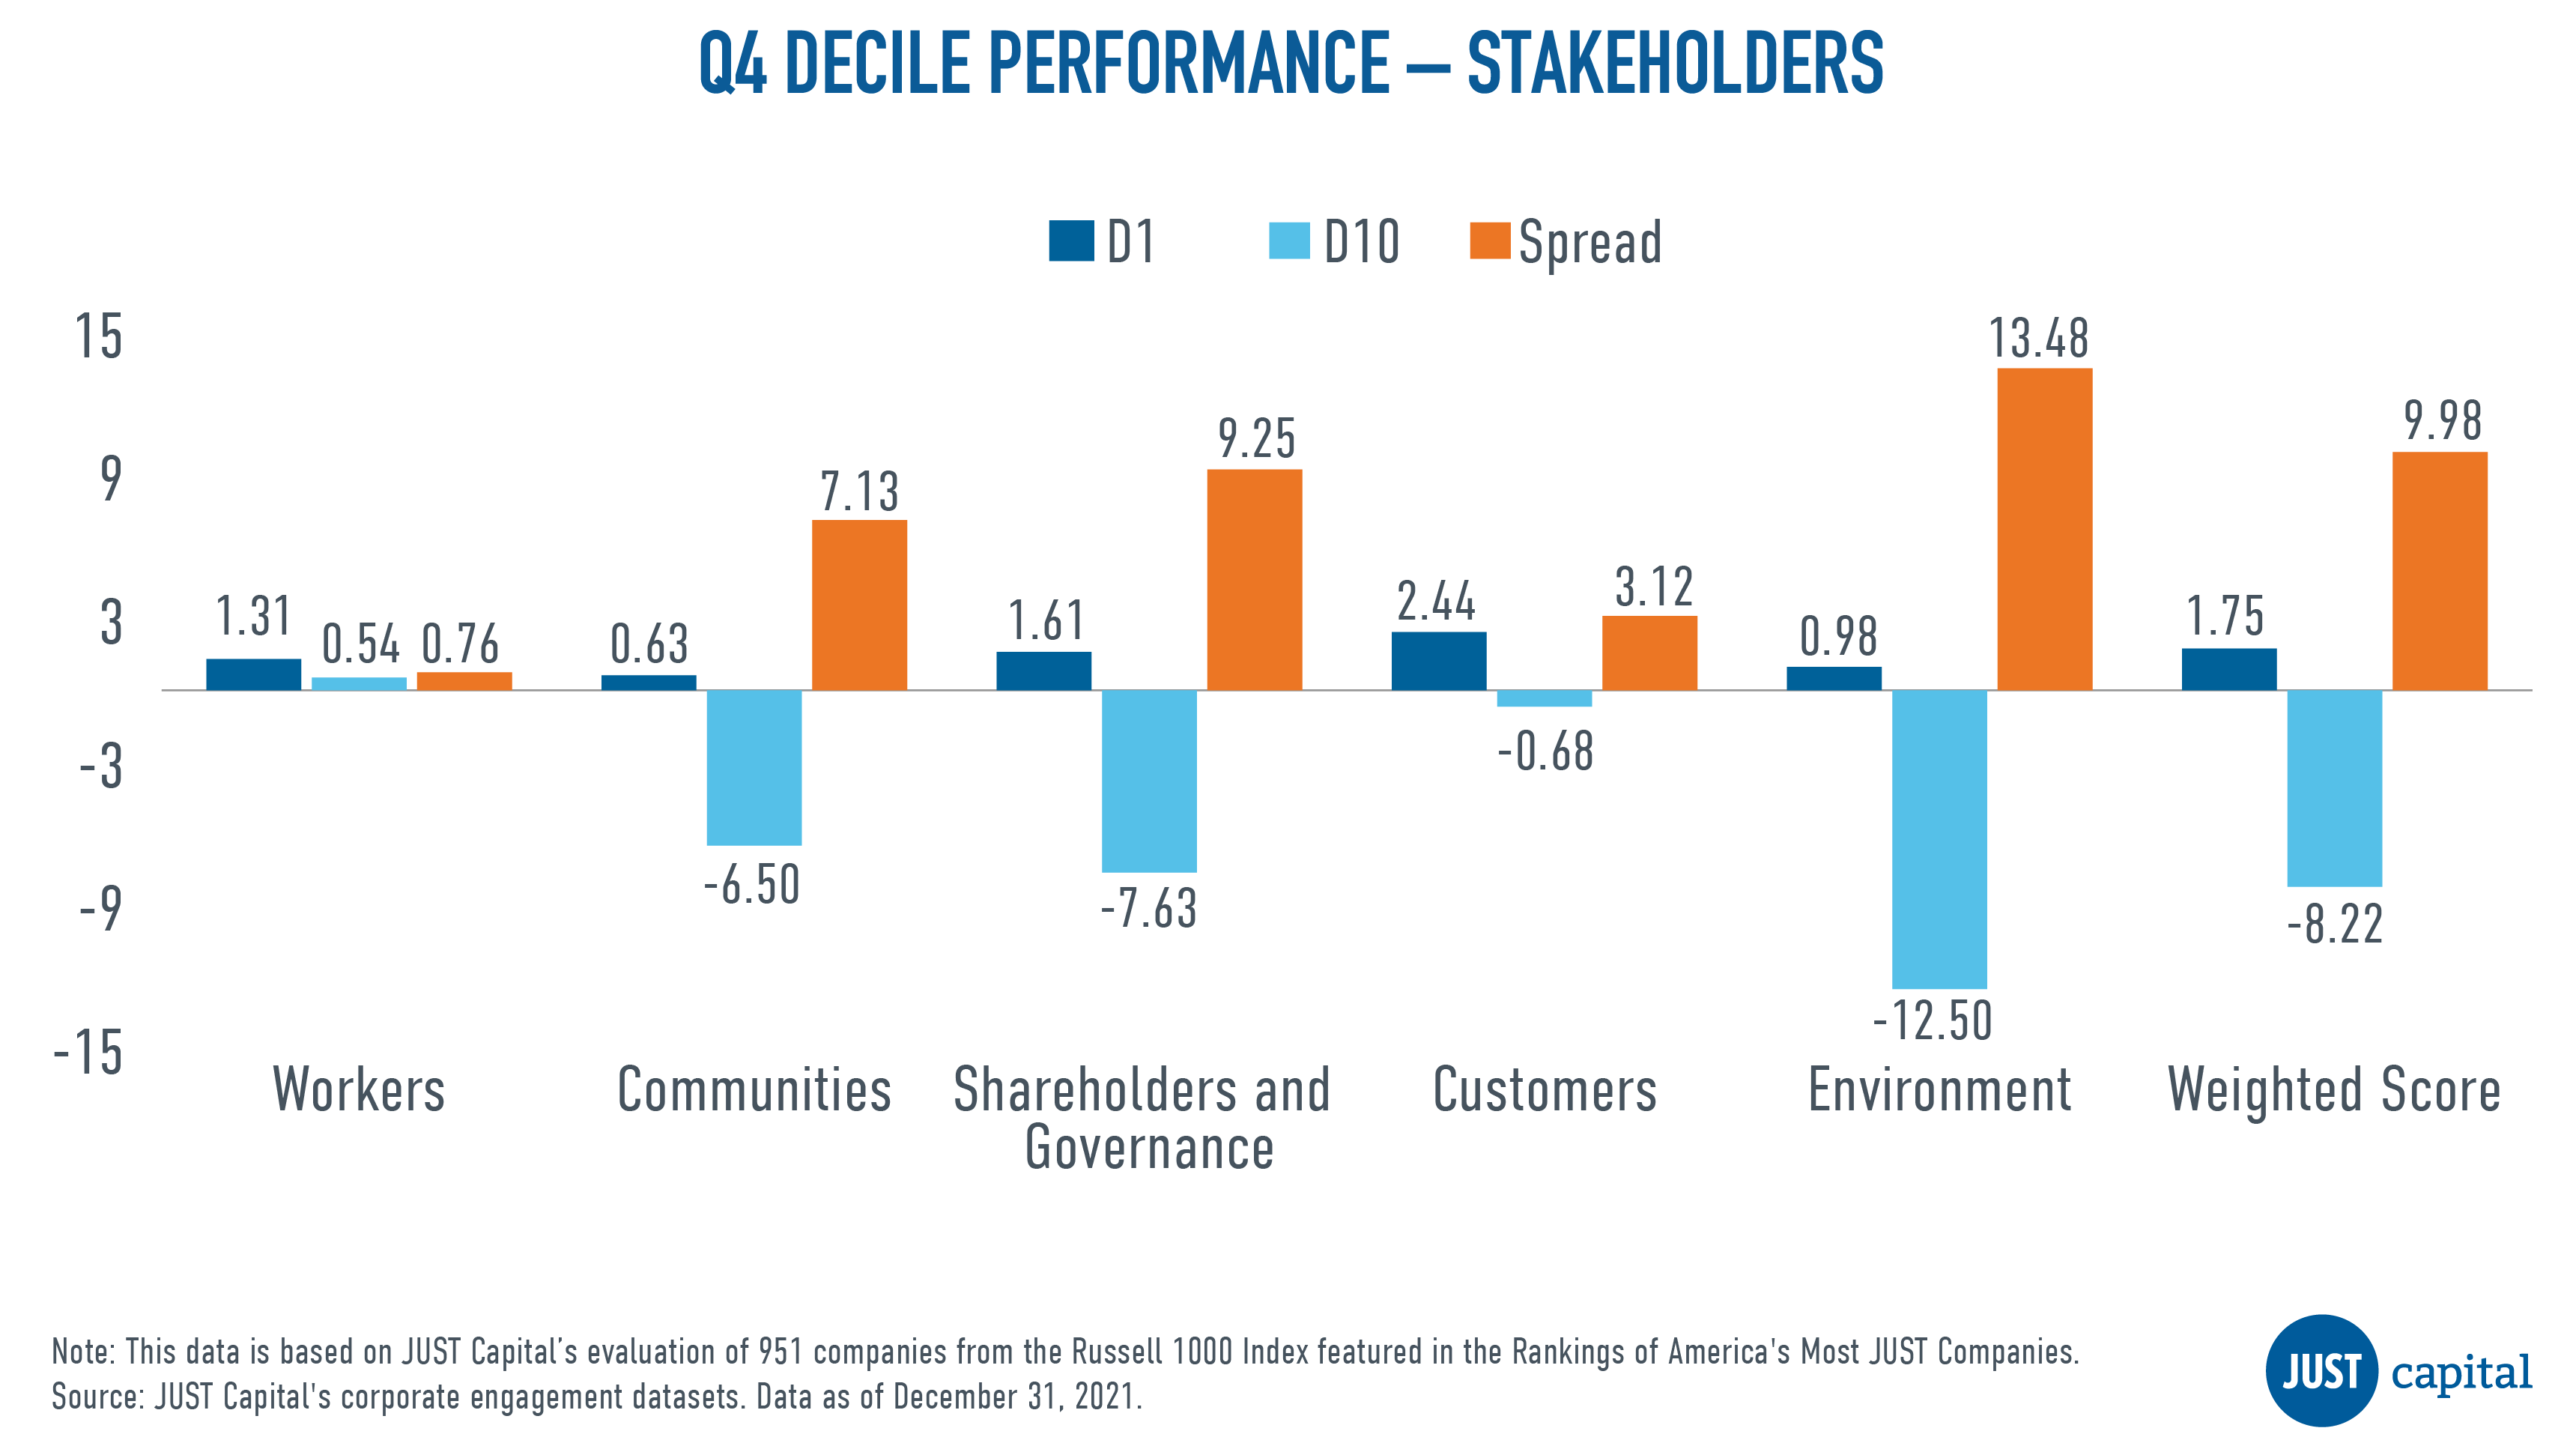
In Q4 2022, in which both stocks and bonds saw solid gains, JUST Capital found that all five of the stakeholders we track delivered positive performance. The Environment stakeholder delivered the best performance over this period with a long-short spread of 13.48%, followed by Shareholders and Governance stakeholder. For all stakeholders other than Workers, top decile stocks outperformed and bottom decile stocks underperformed the universe average; for Workers, the bottom decile outperformed the universe average.
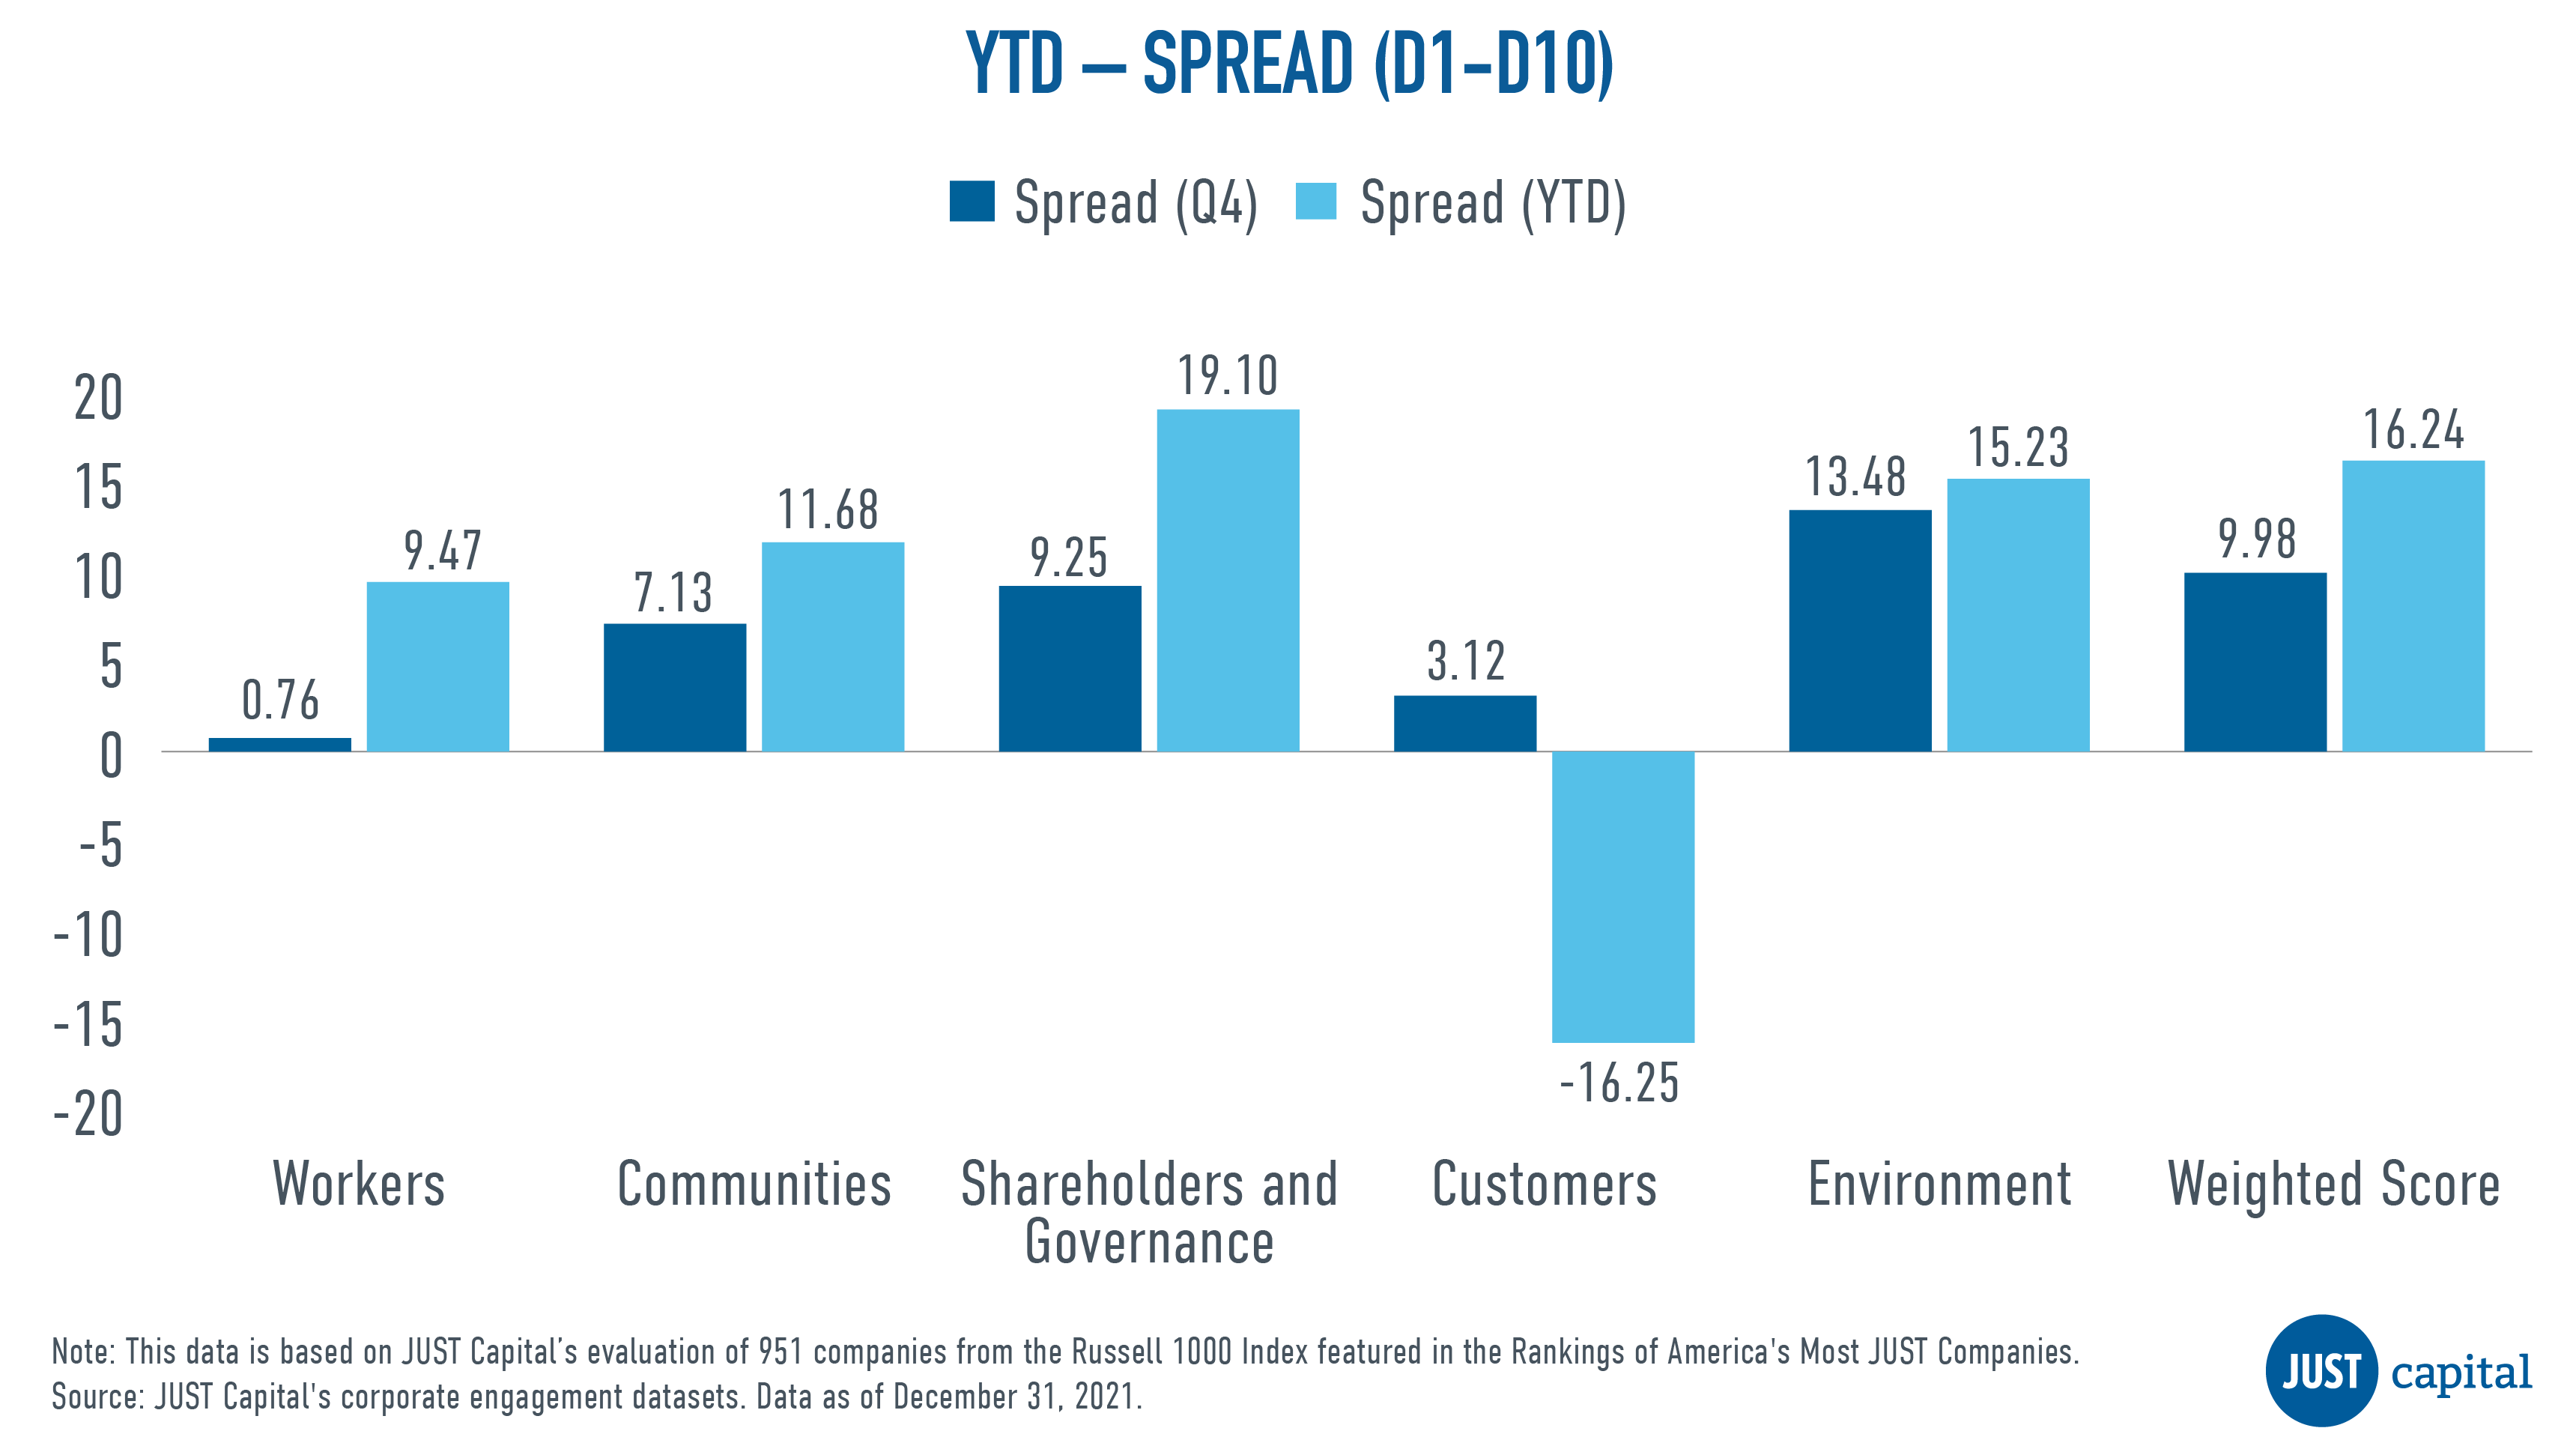
JUST Capital’s Overall Weighted Score takes into account the 20 core Issues determined through our survey research – including paying a living wage, creating a diverse, inclusive workplace, and helping combat climate change – across key business stakeholders: Workers, Communities, Shareholders and Governance, Customers, and the Environment. This Overall Weighted Score had a positive long-short spread of 9.98% in Q4 and delivered a 16.24% spread in 2022.
Shown below is the Year-to-Date (YTD) and Q4 performance, which is quantified by the spread between the top and bottom deciles of all the stakeholders and the overall weighted score.
Workers Performance
The Workers stakeholder measures a company across five Issues:
- Wages – Pays a fair, living wage.
- Health – Protects worker health and safety.
- Benefits – Provides benefits and work-life balance.
- Diversity, Equity, and Inclusion (DEI) – Cultivates a diverse, inclusive workplace.
- Careers: Invests in workforce training.
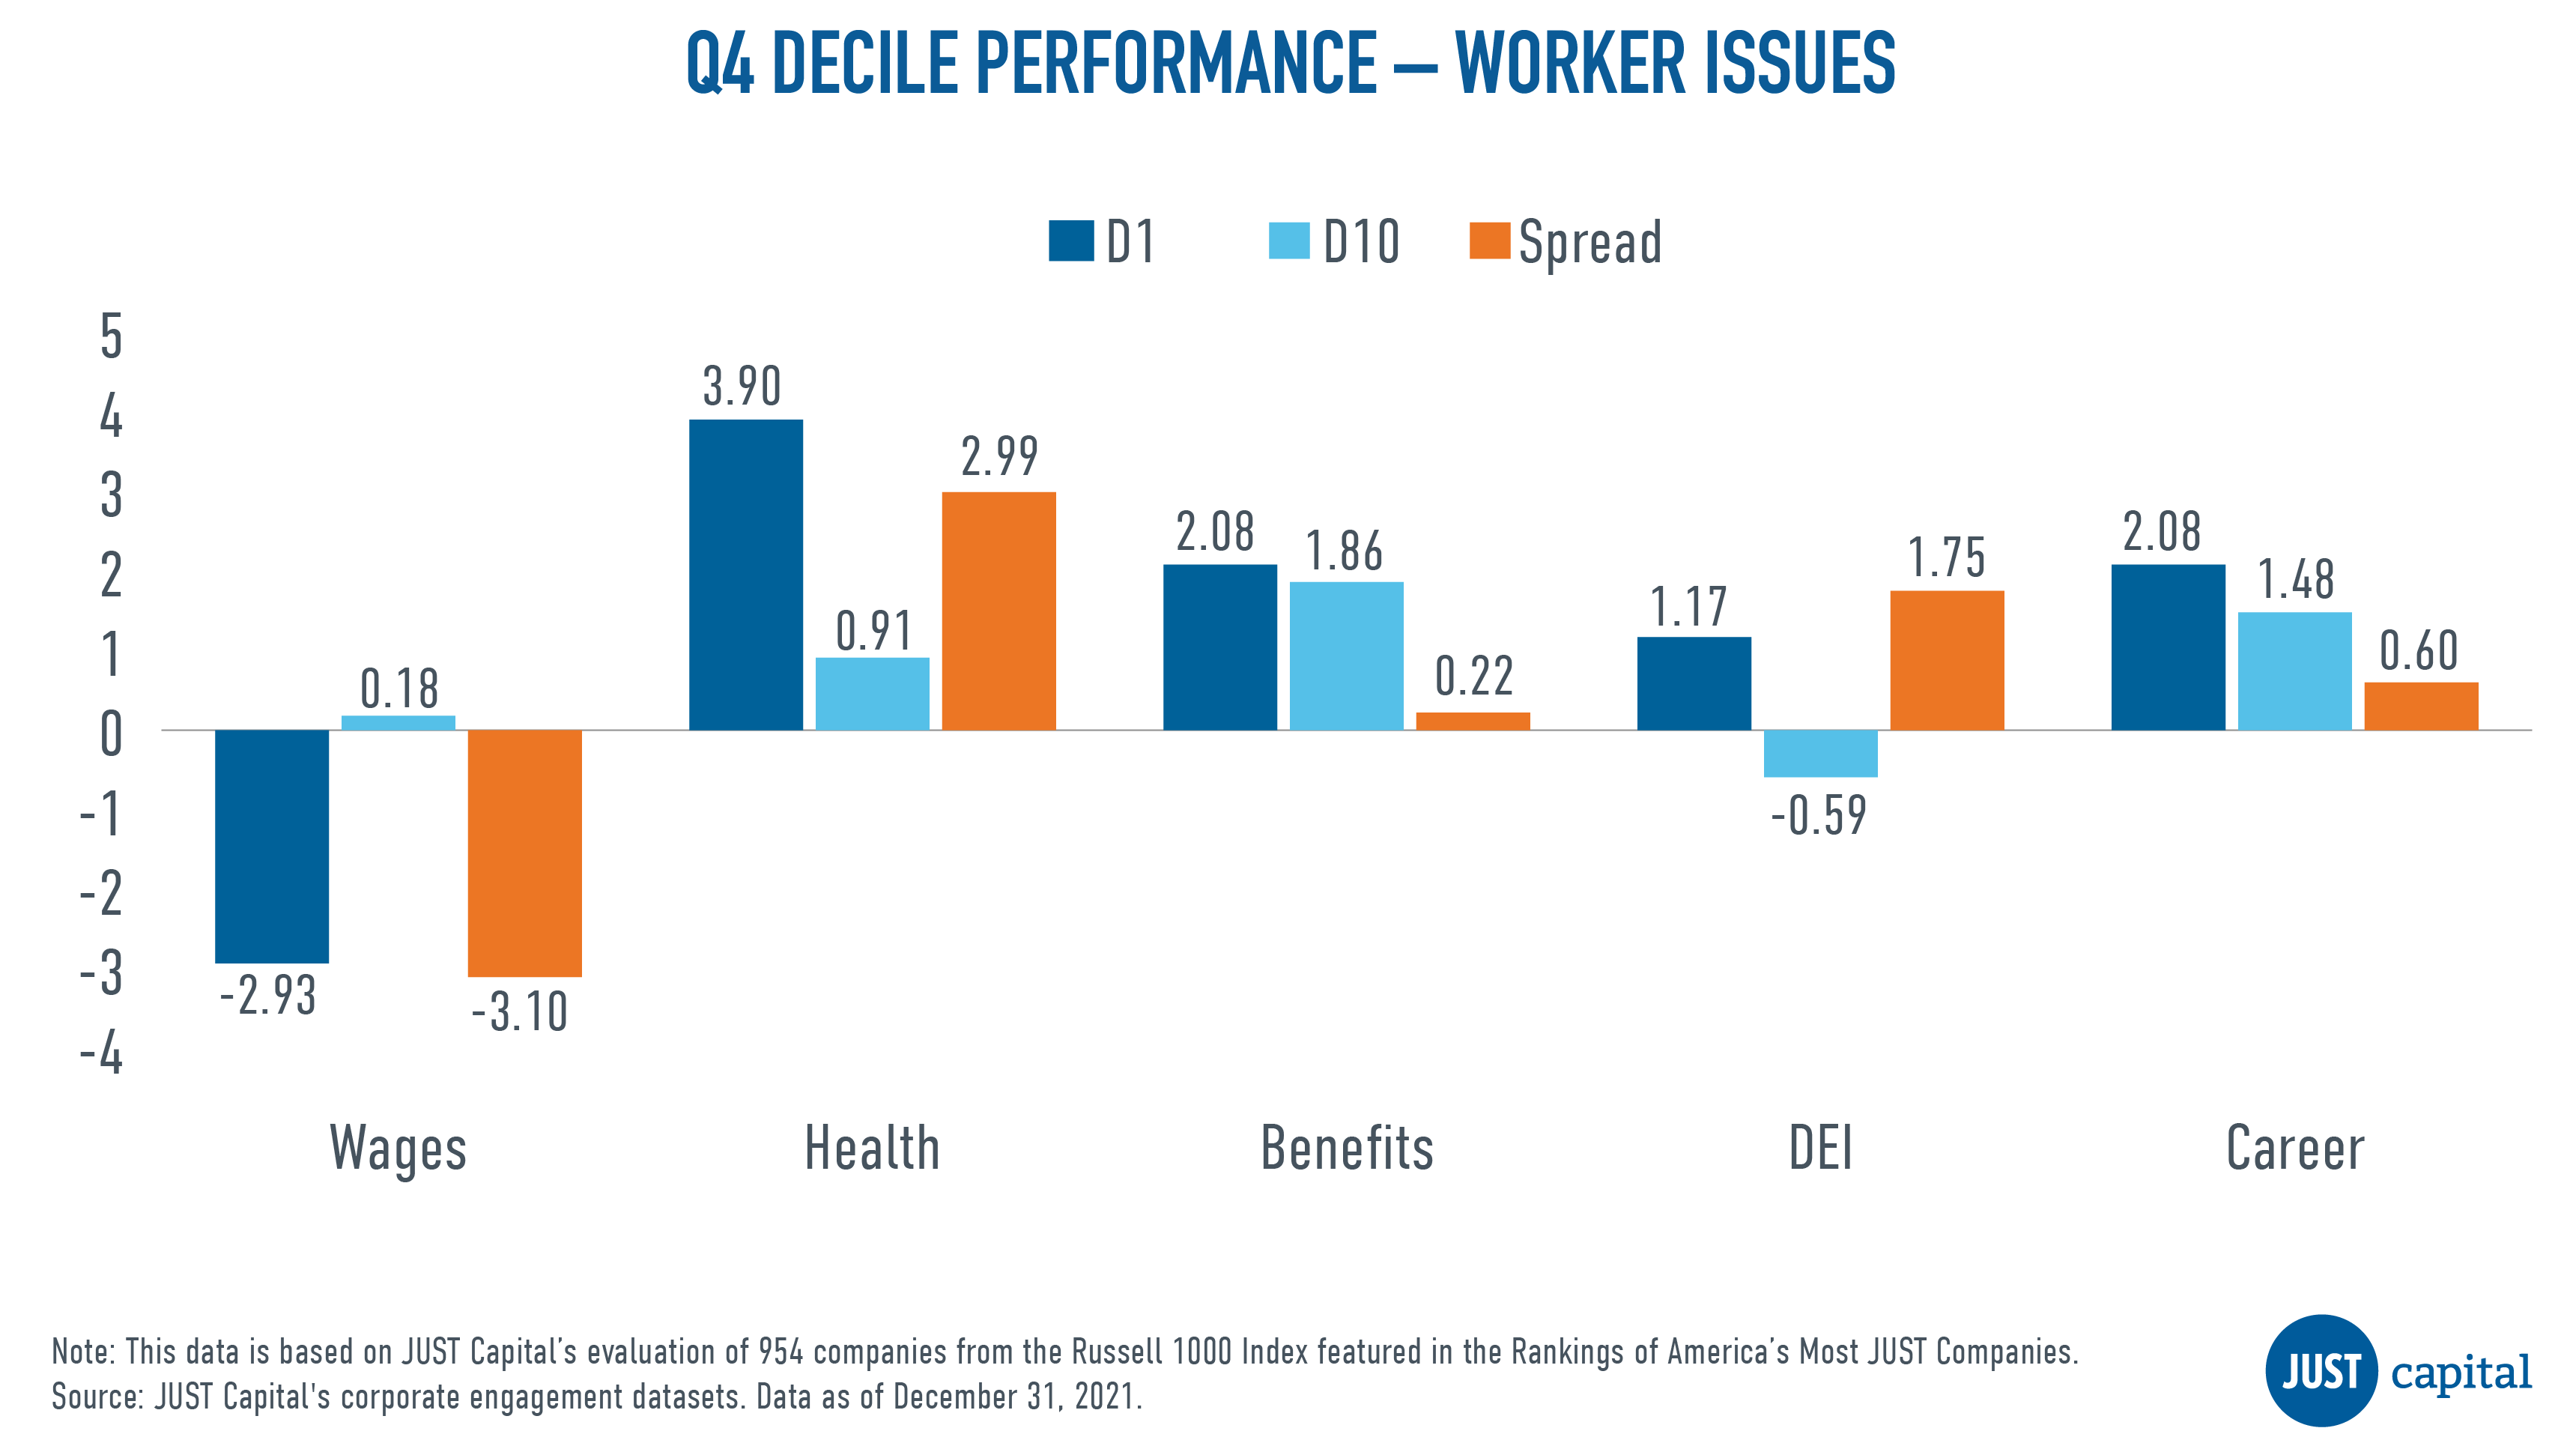
In Q4, we saw four out of five Worker Issues outperform. Underperformance in Wages was driven by negative performance from both top and bottom decile companies.
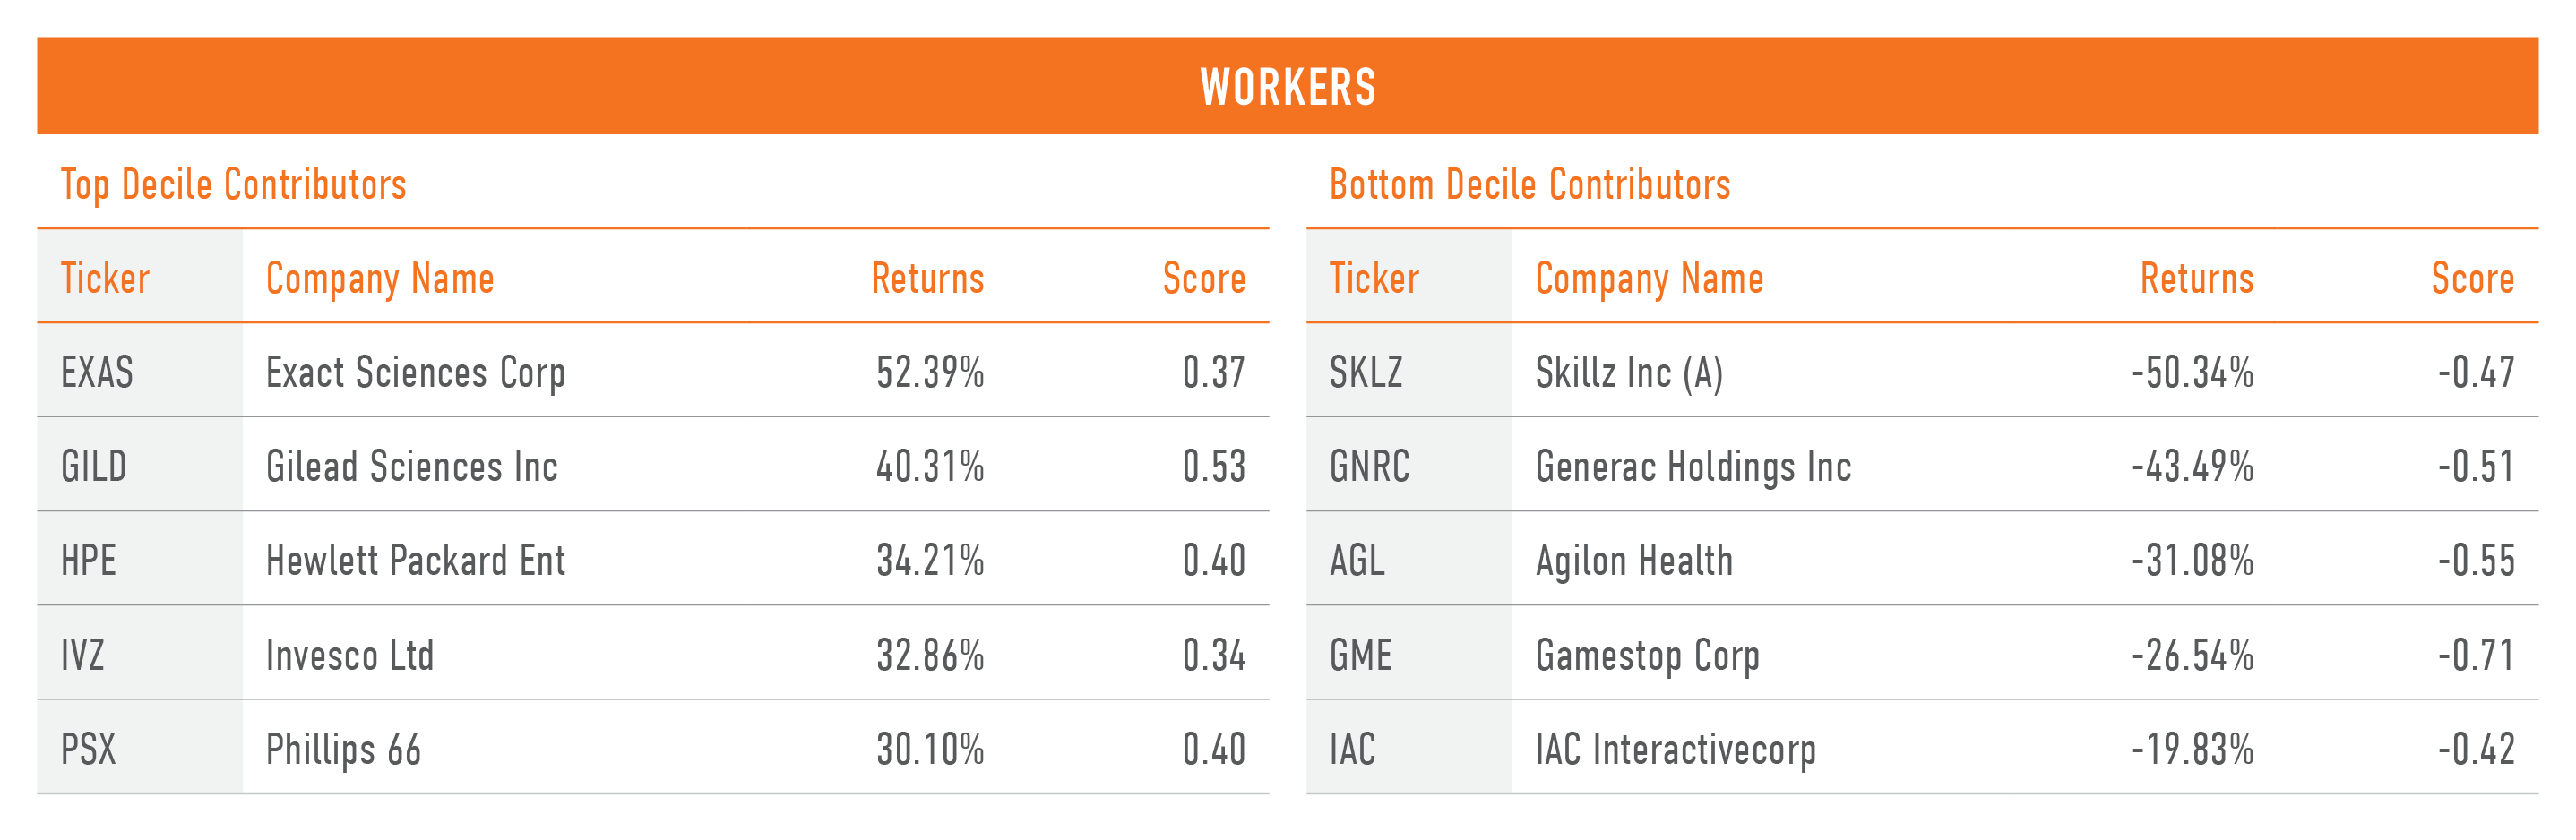
Shown below are the top and bottom five contributors to the top decile (D1), the top-ranked companies as measured by their Workers score, and the bottom decile (D10), the lowest-ranked companies as measured by their Worker score.
Communities Performance
The Communities stakeholder measures a company across four Issues:
- Jobs – Creates jobs in the U.S.
- Supply Chain – Respects human rights in the supply chain.
- Community Development – Contributes to community development.
- Philanthropy – Gives back to local communities.
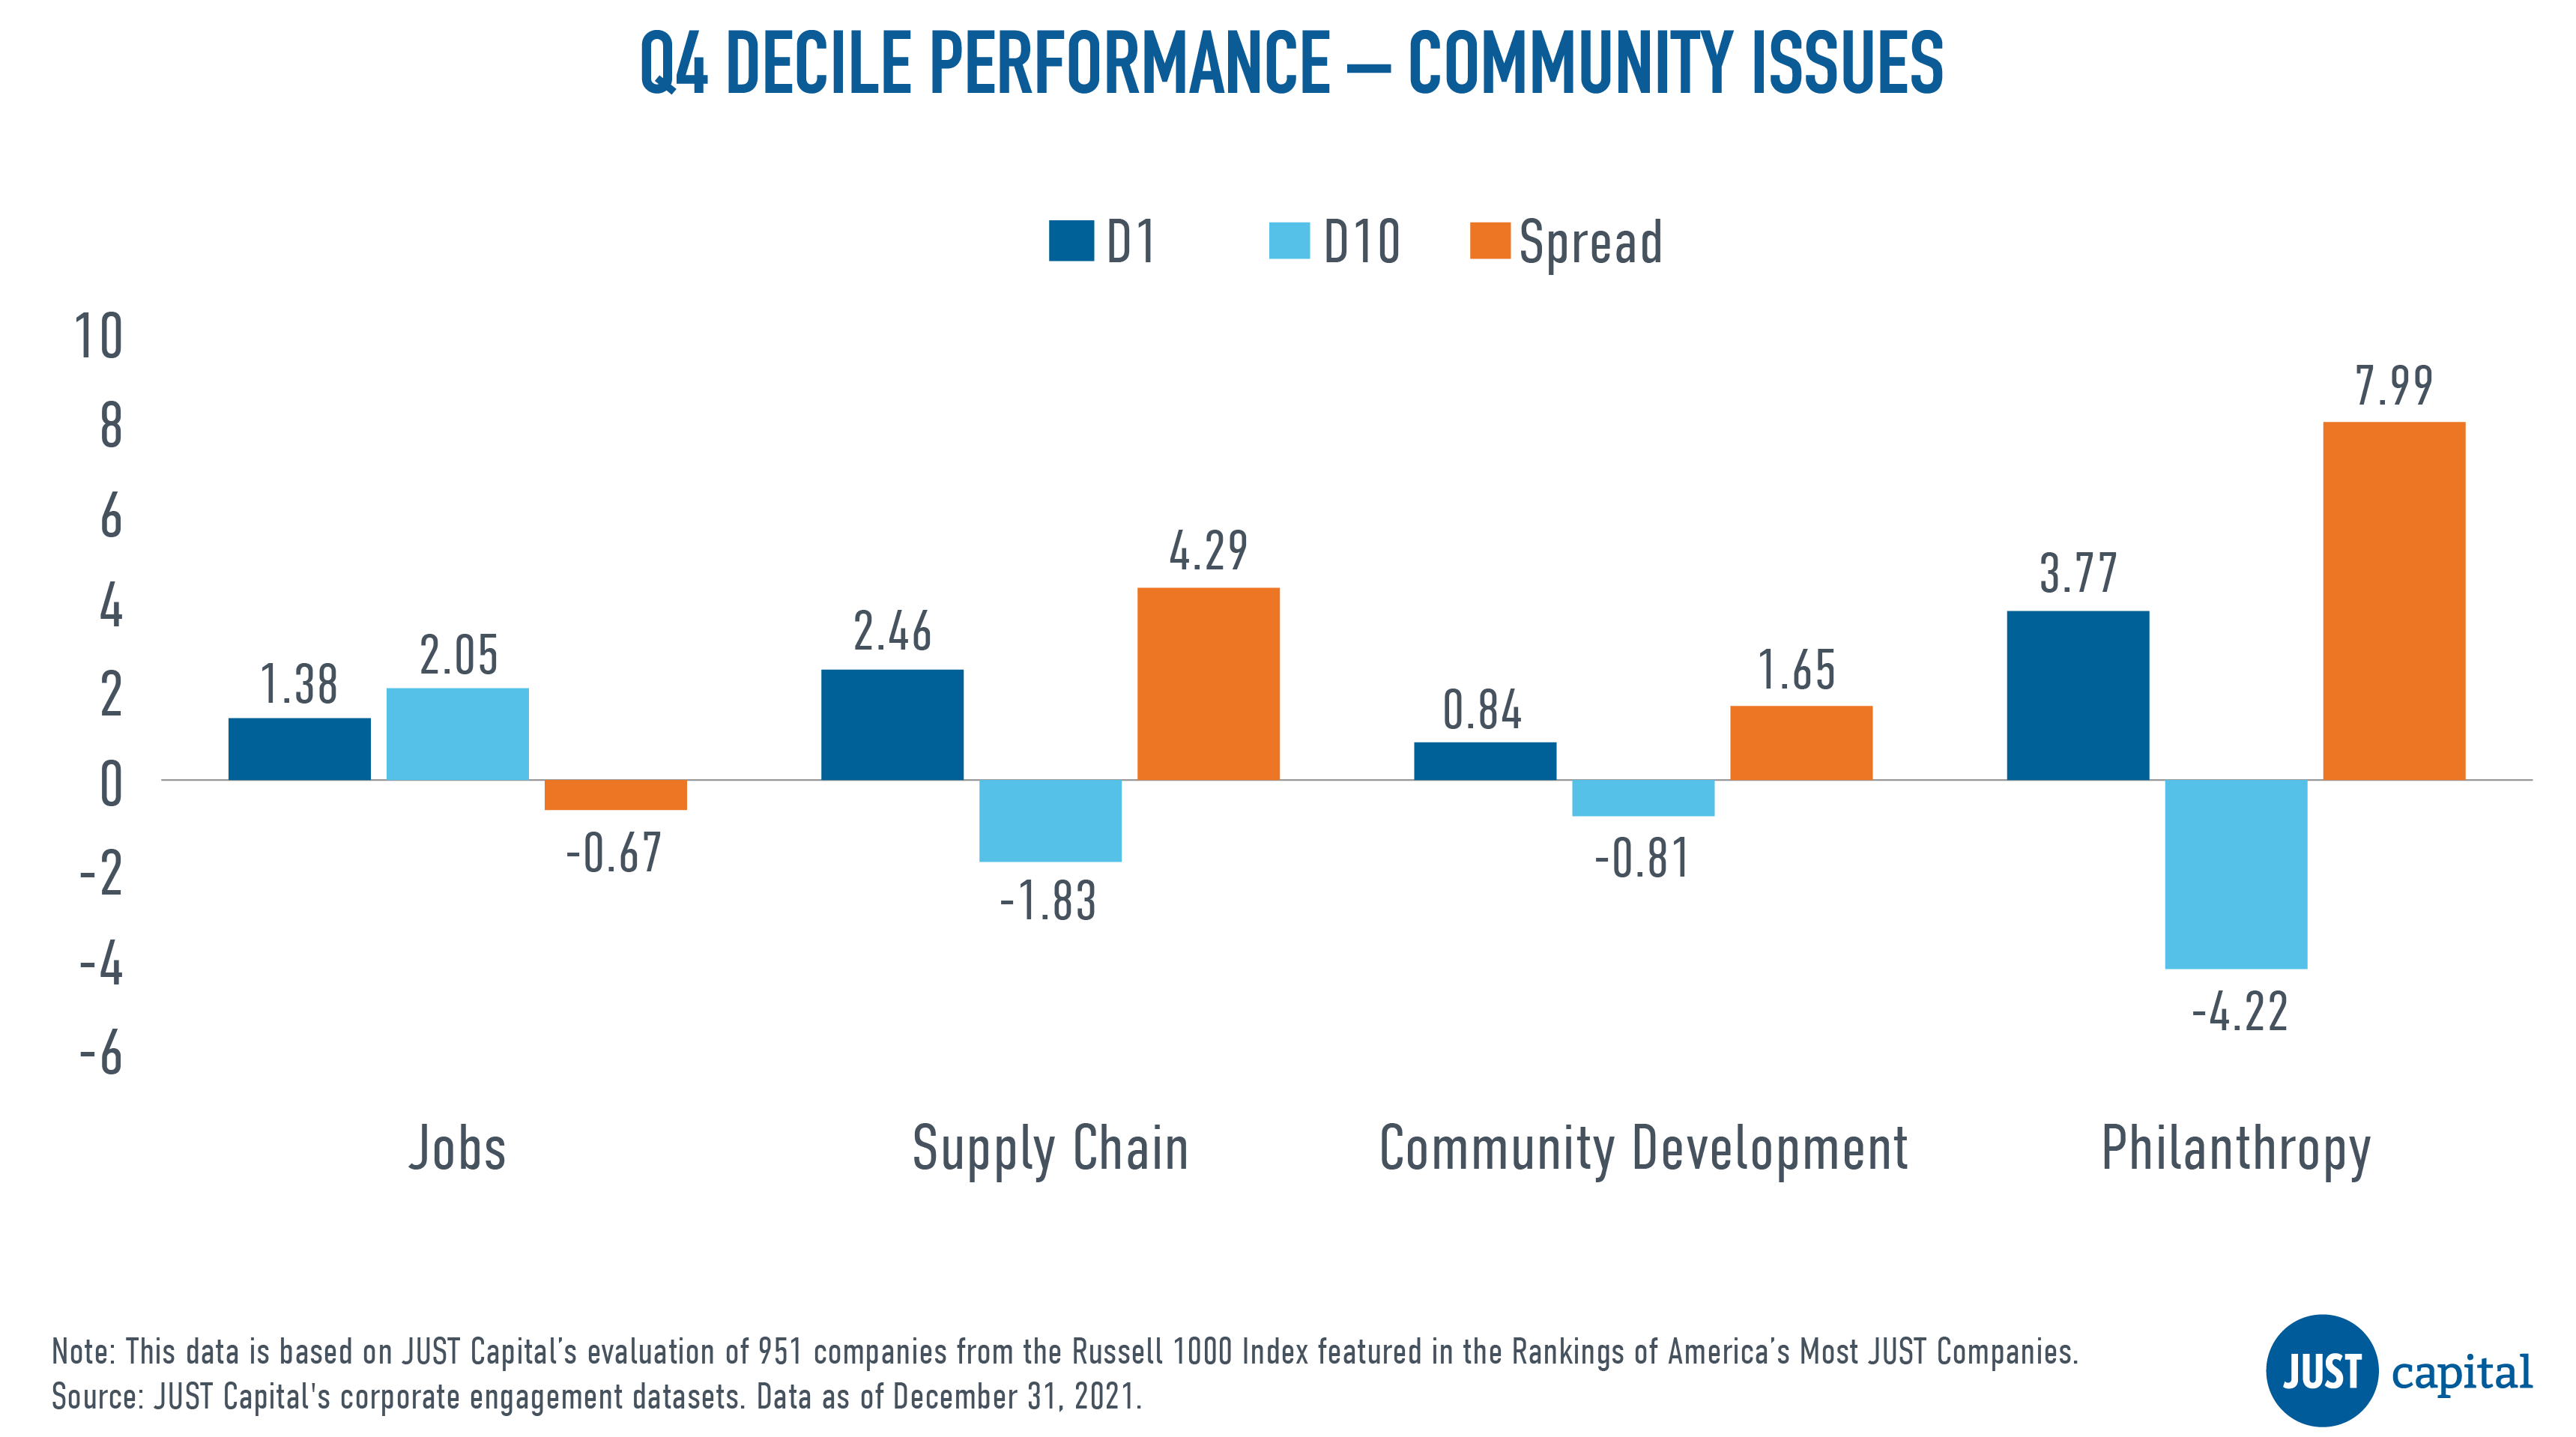
All issues with the exception of Jobs were positive contributors to the Communities stakeholder’s performance. Negative performance within Jobs was driven by the out-performance of bottom decile companies.
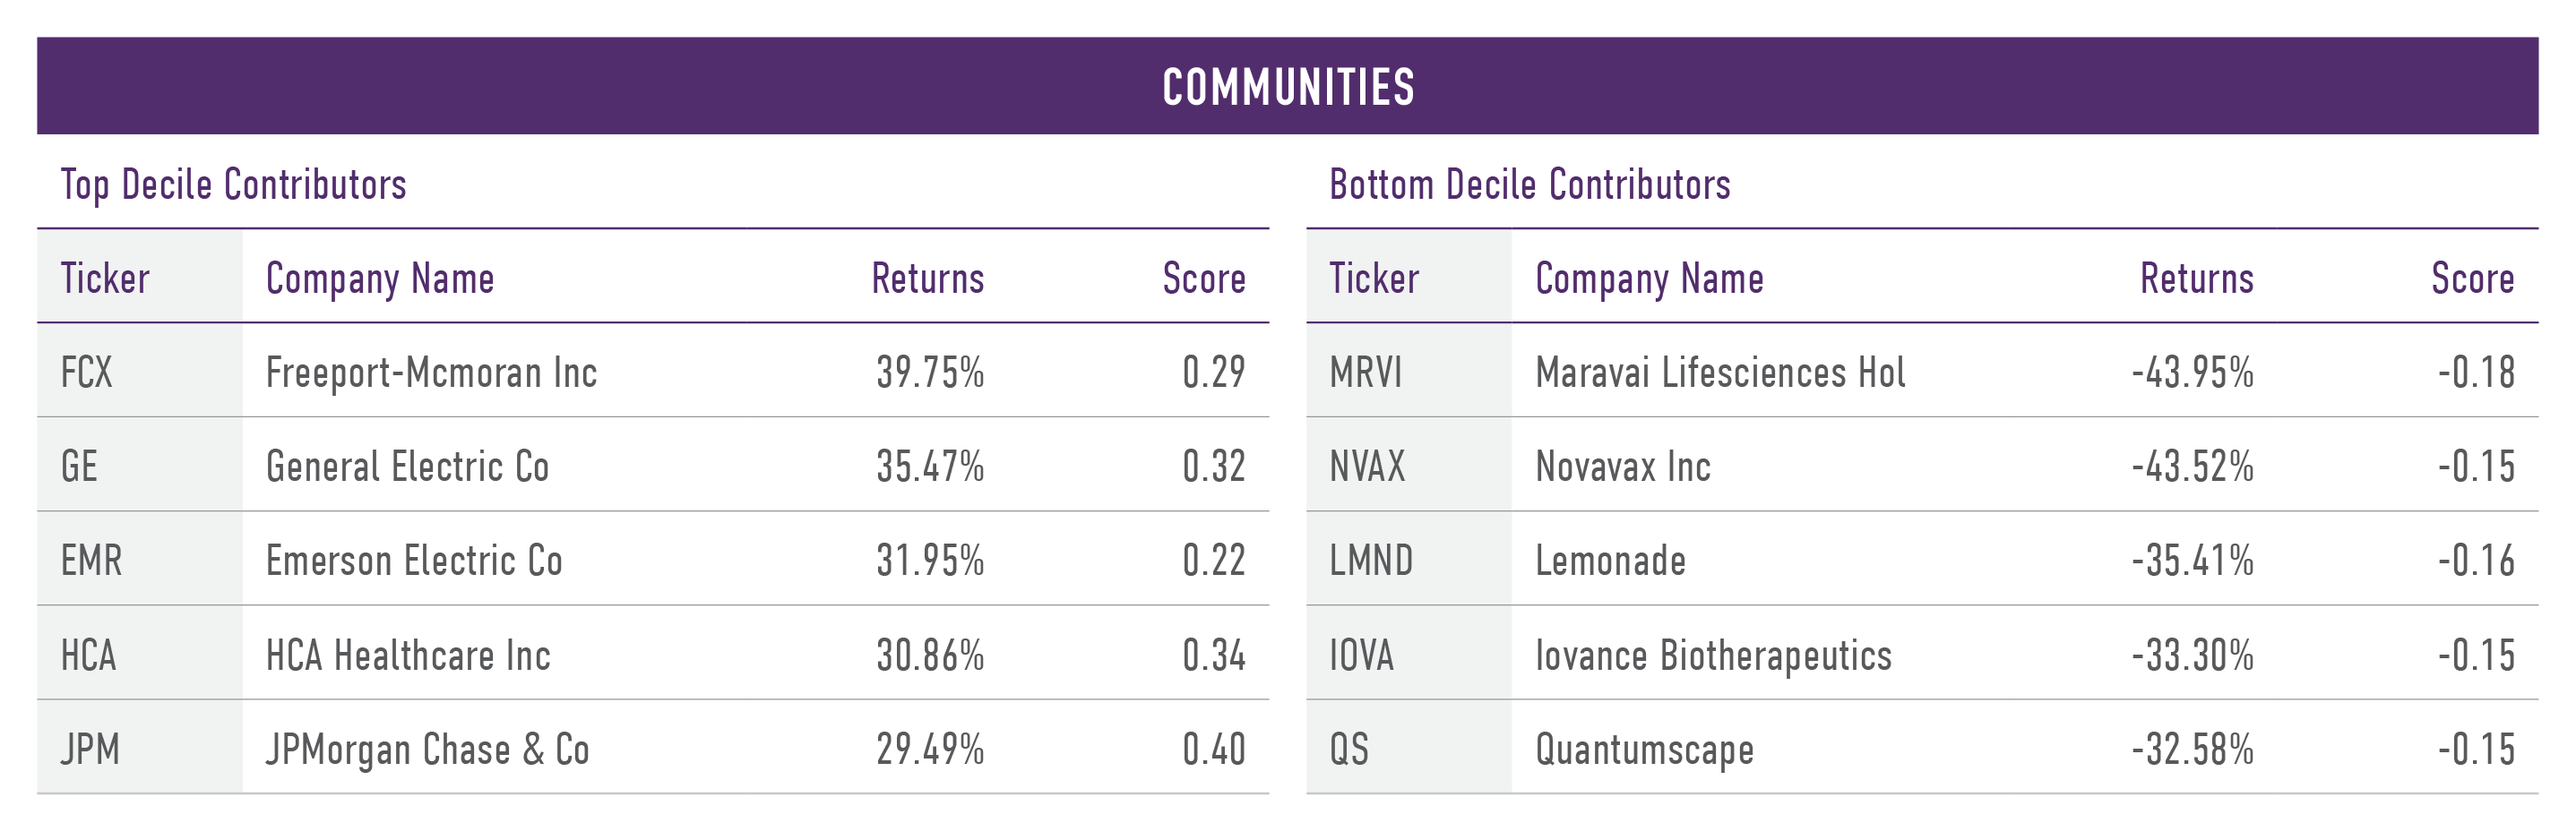
Shown below are the both top and bottom five contributors to the top decile (D1), the best-ranked companies as measured by their Communities score, and the bottom decile (D10), the worst-ranked companies as measured by their Communities score.
Shareholders and Governance Performance
The Shareholders and Governance stakeholder measures a company across three Issues:
- Accountability – Priotitizes accountability to all stakeholders.
- Ethics – Acts ethically at the leadership level.
- Returns – Generates returns for investors.
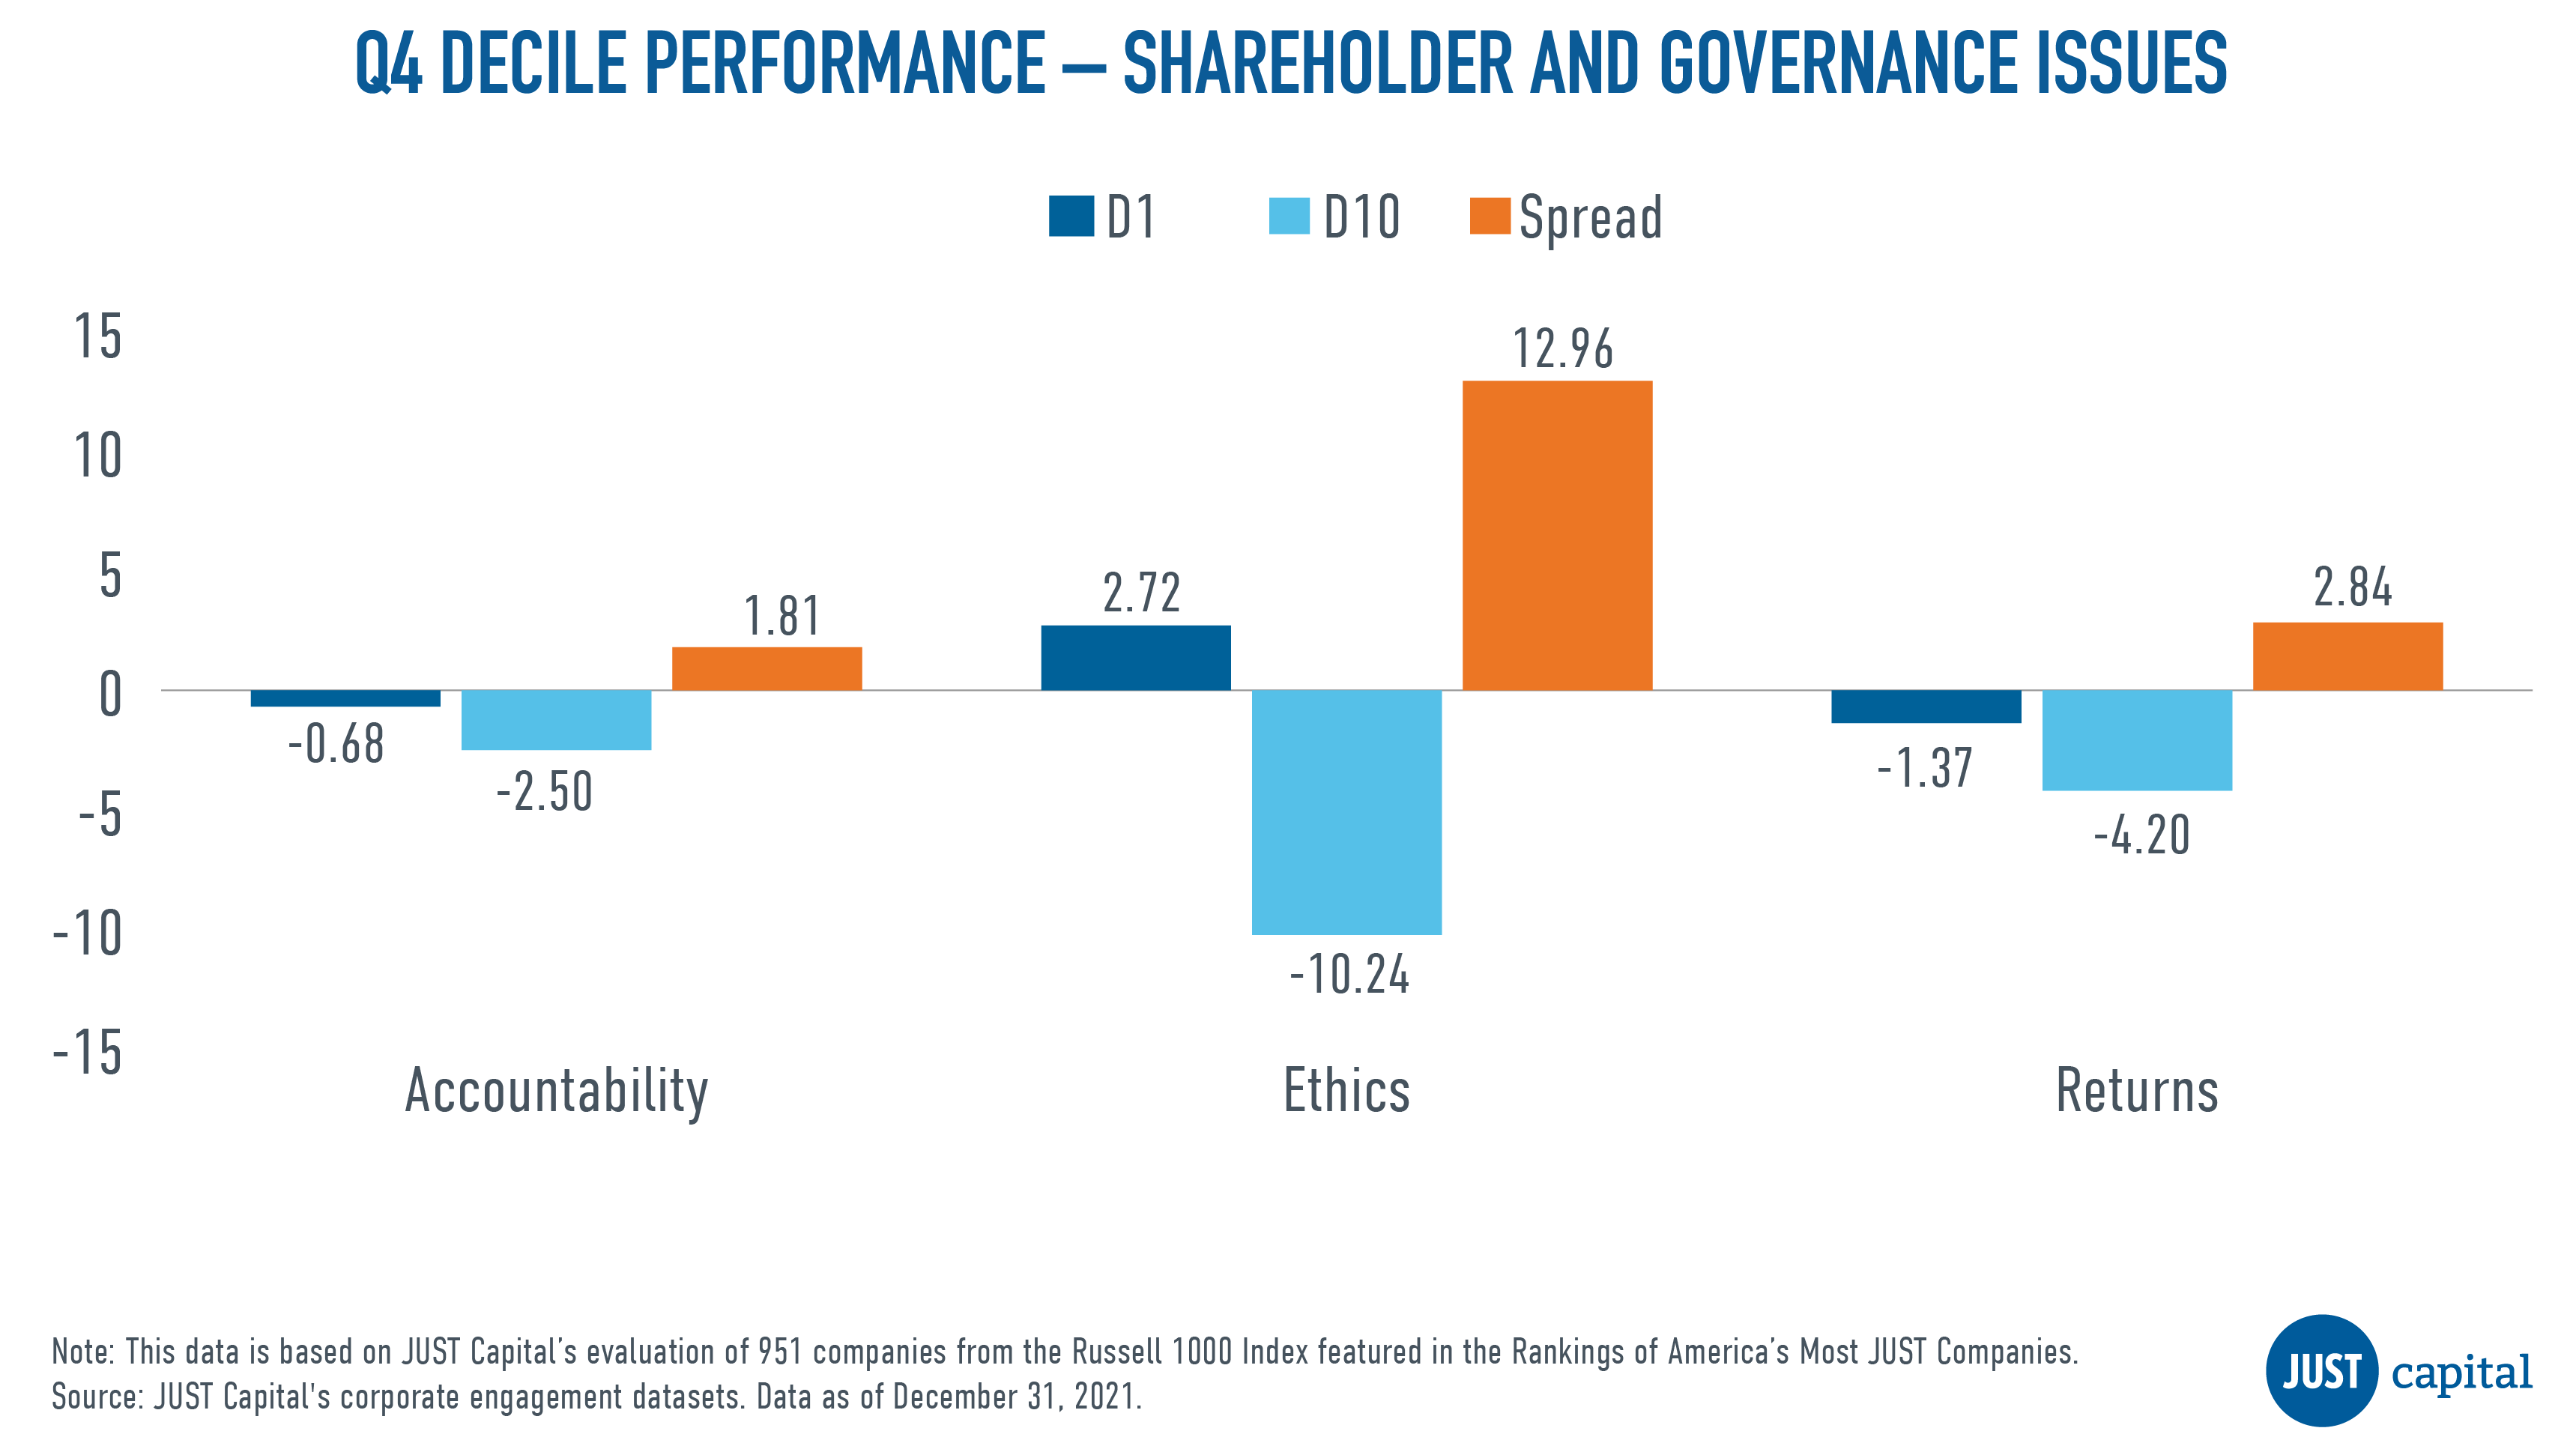
In Q4 we saw all the Shareholder and Governance issues outperform, with Ethics being the leader in performance driven primarily by the underperformance of bottom decile companies.
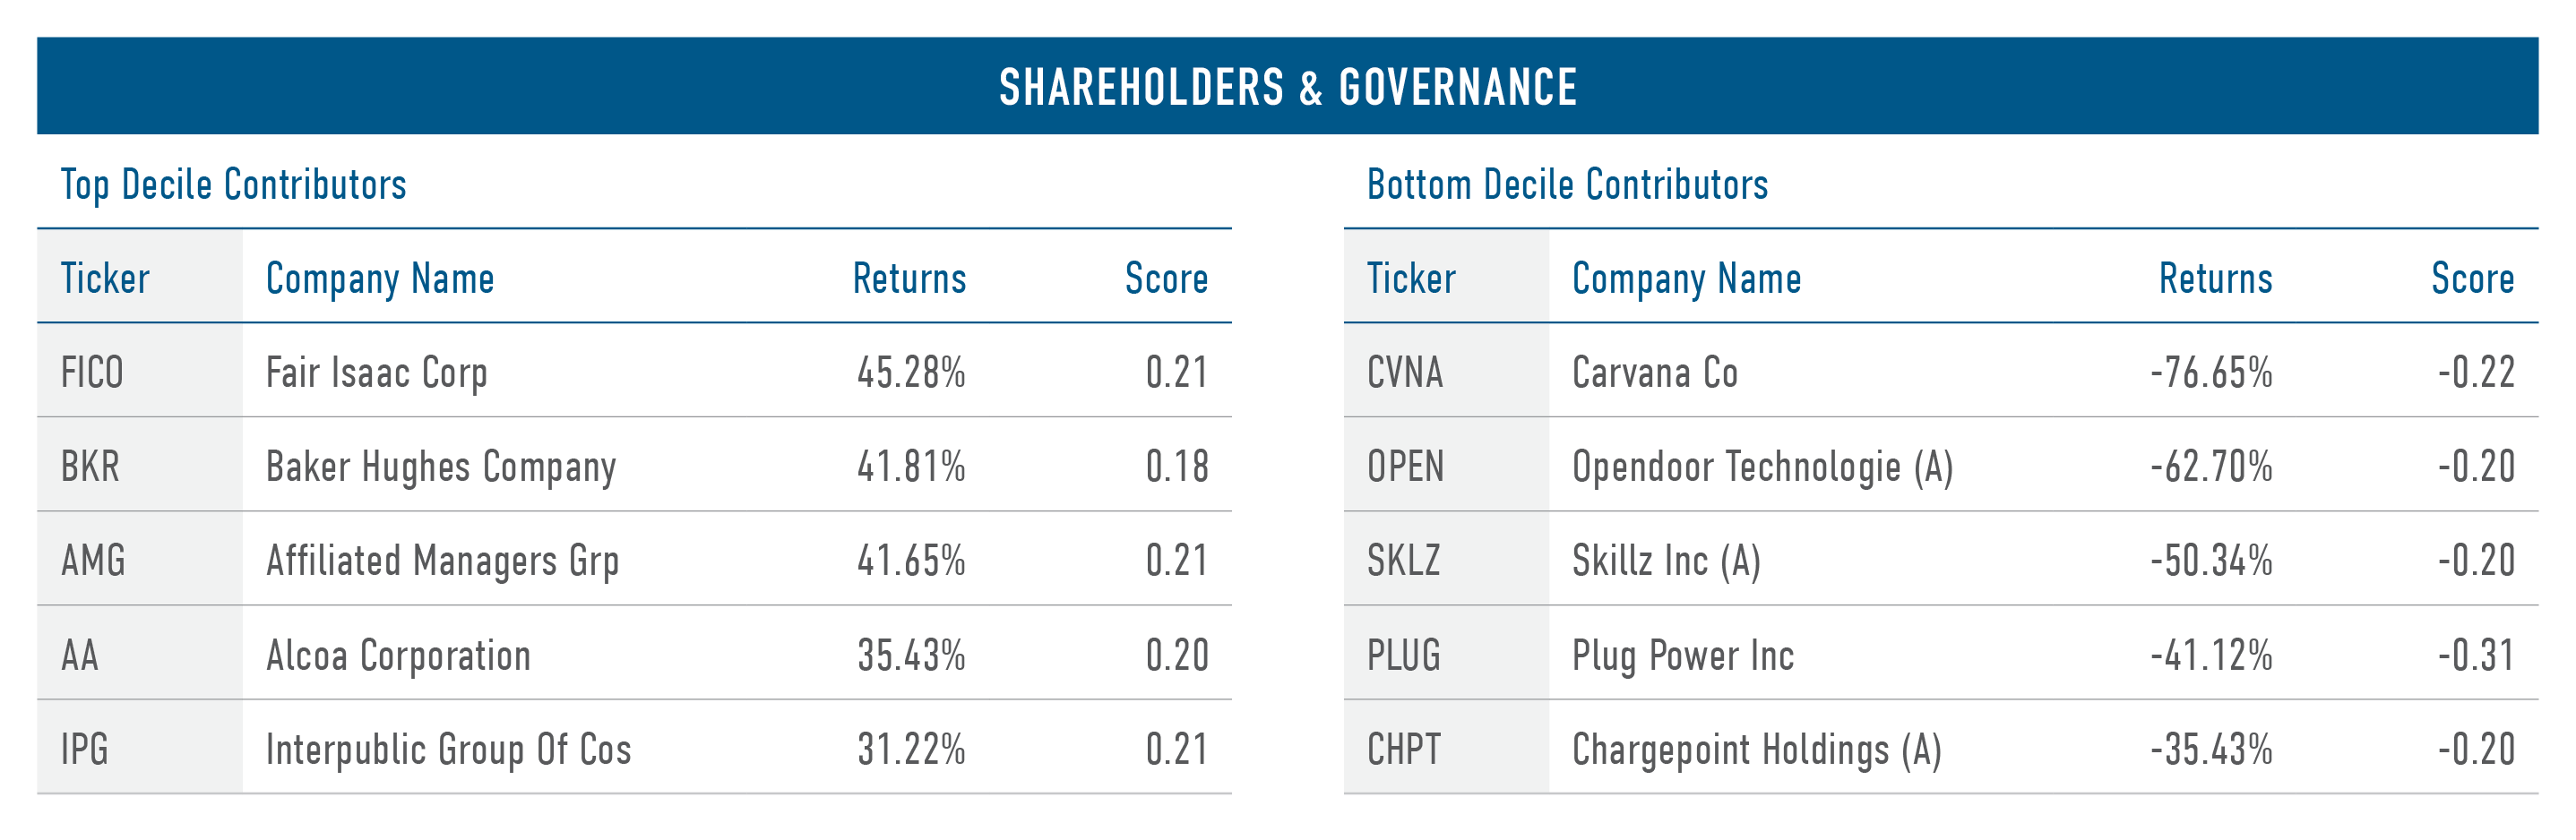
Shown below are the both top and bottom five contributors to the top decile (D1), the best-ranked companies as measured by their Shareholders and Governance score, and the bottom decile (D10), the worst-ranked companies as measured by their Shareholders and Governance score.
Customers Performance
The Customers stakeholder measures a company across four Issues:
- Privacy – Protects customer privacy.
- Experience – Treats customers fairly.
- Transparency – Communicates transparently.
- Beneficial Products – Makes beneficial products.
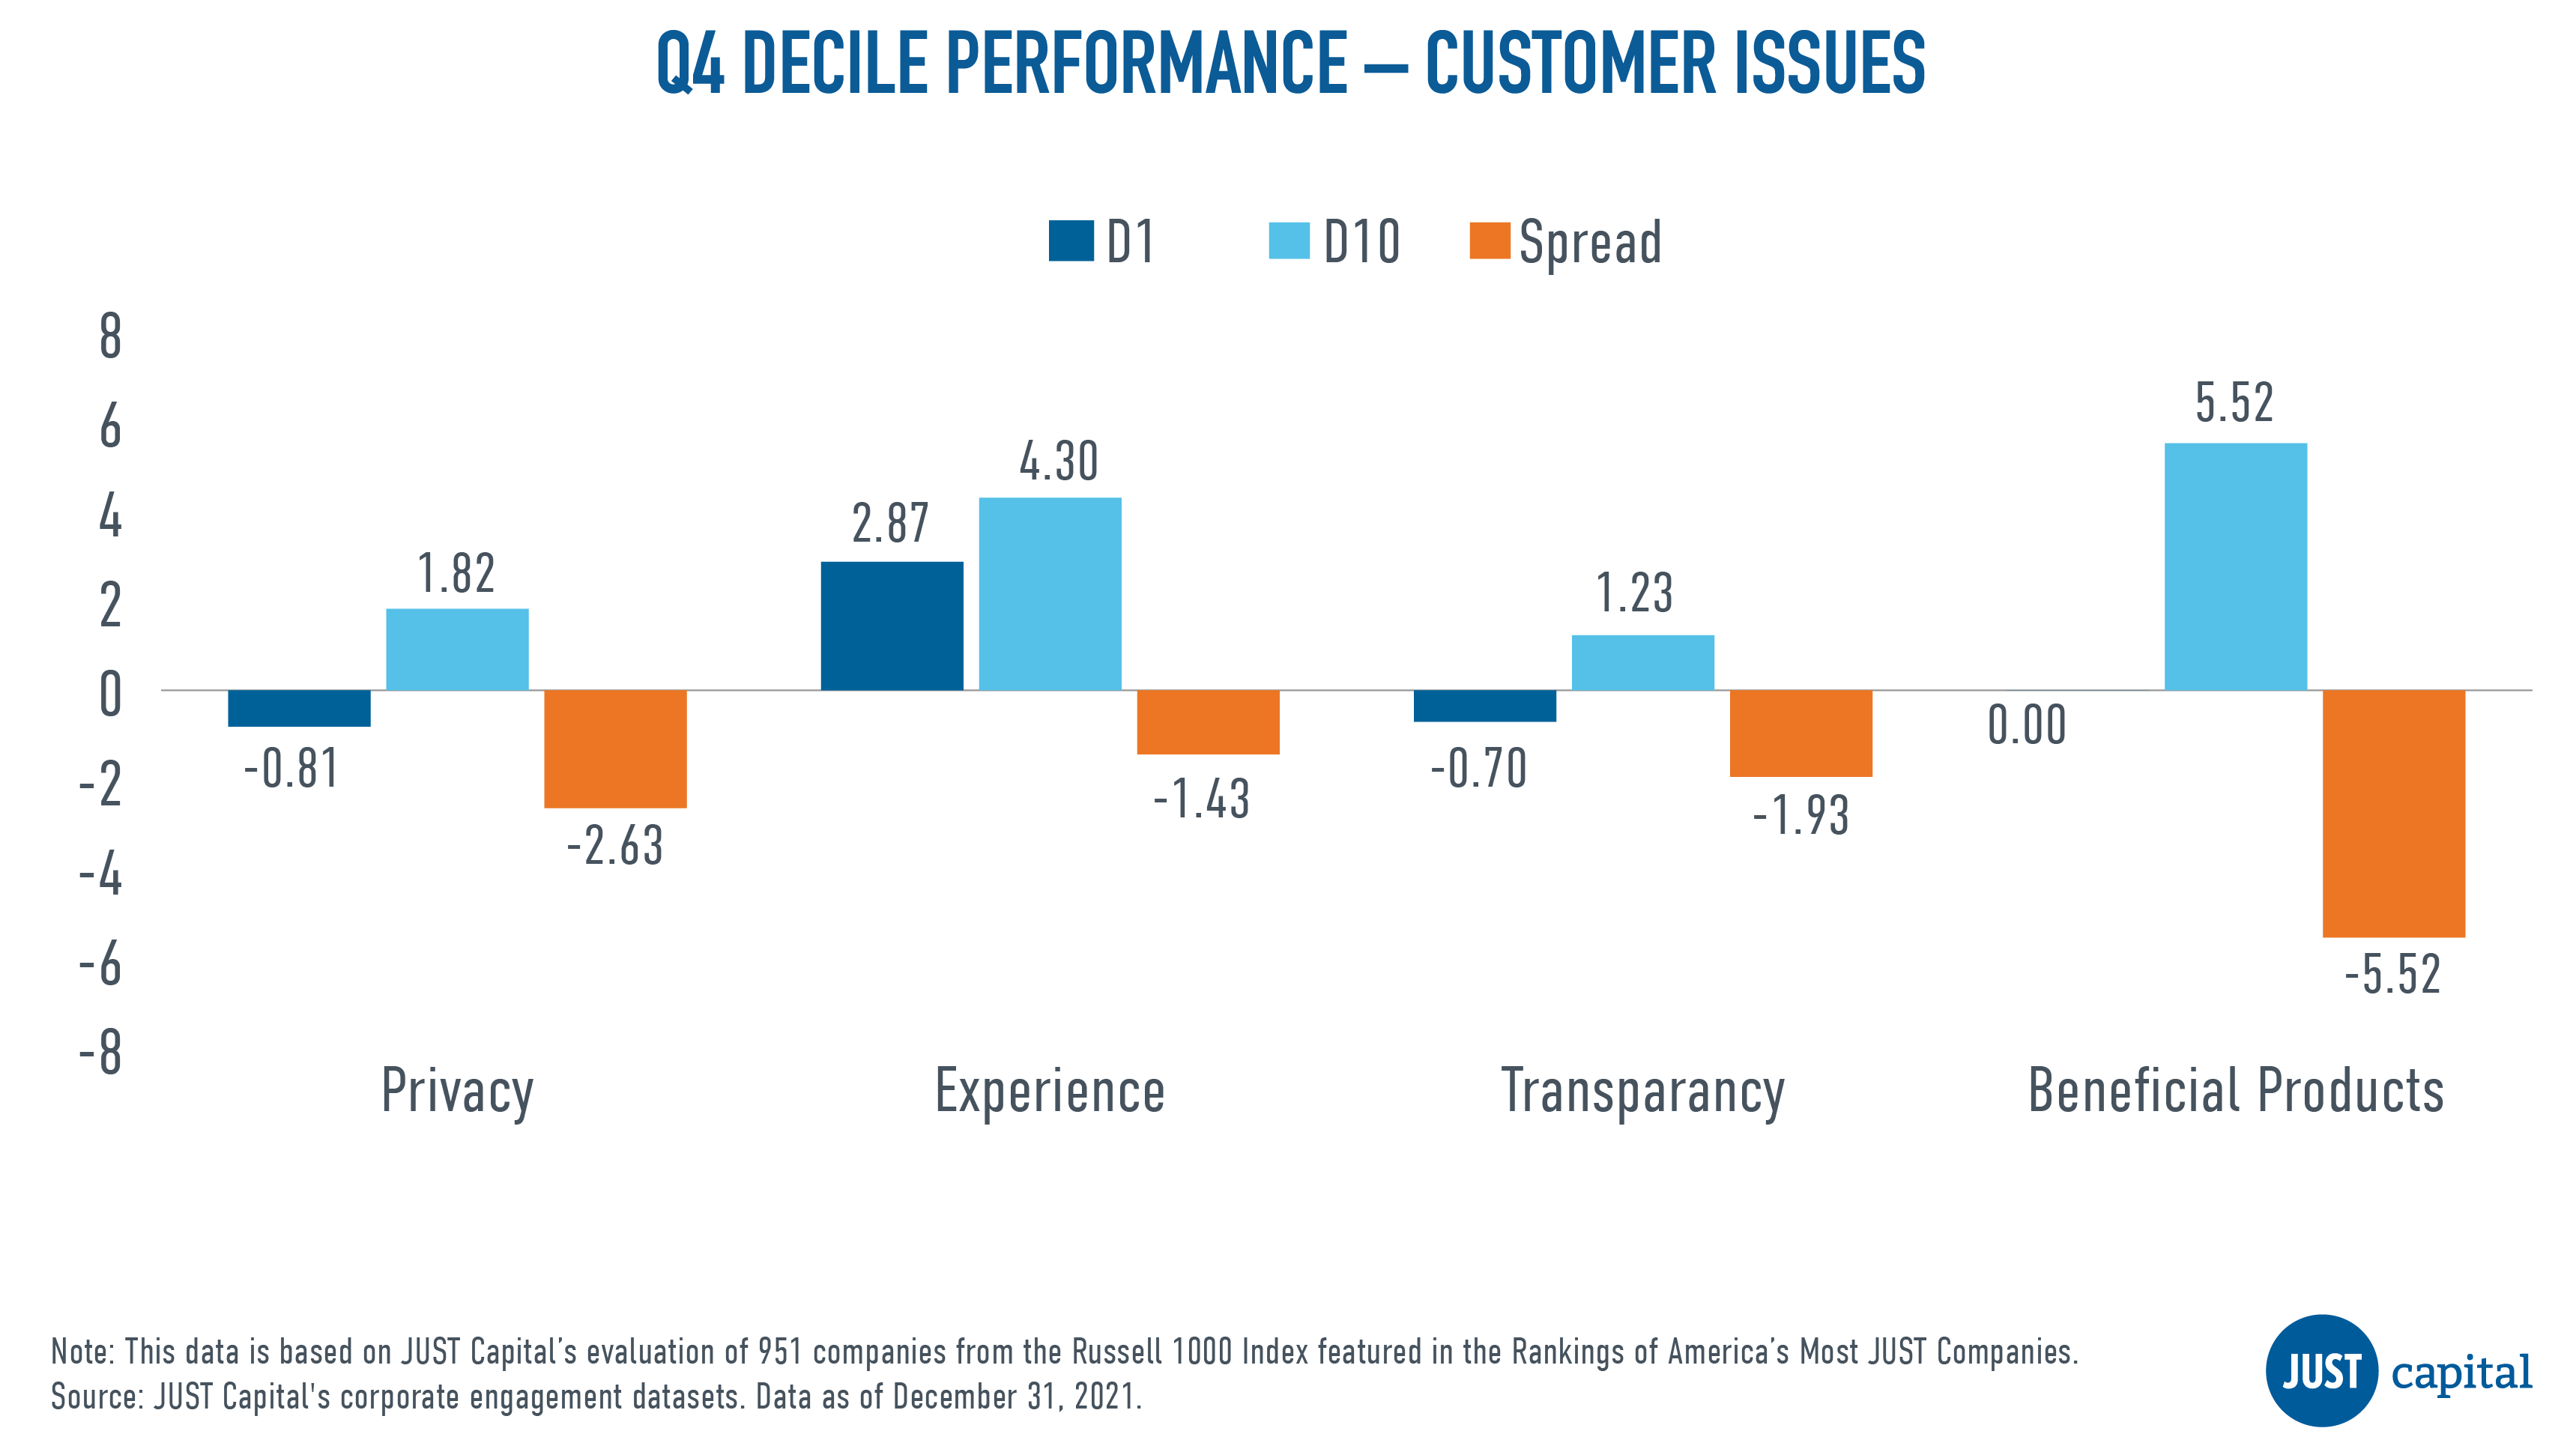
In Q4, we saw all Customer Issues underperform. The Beneficial Products issue was the biggest negative contributor to Customer performance.
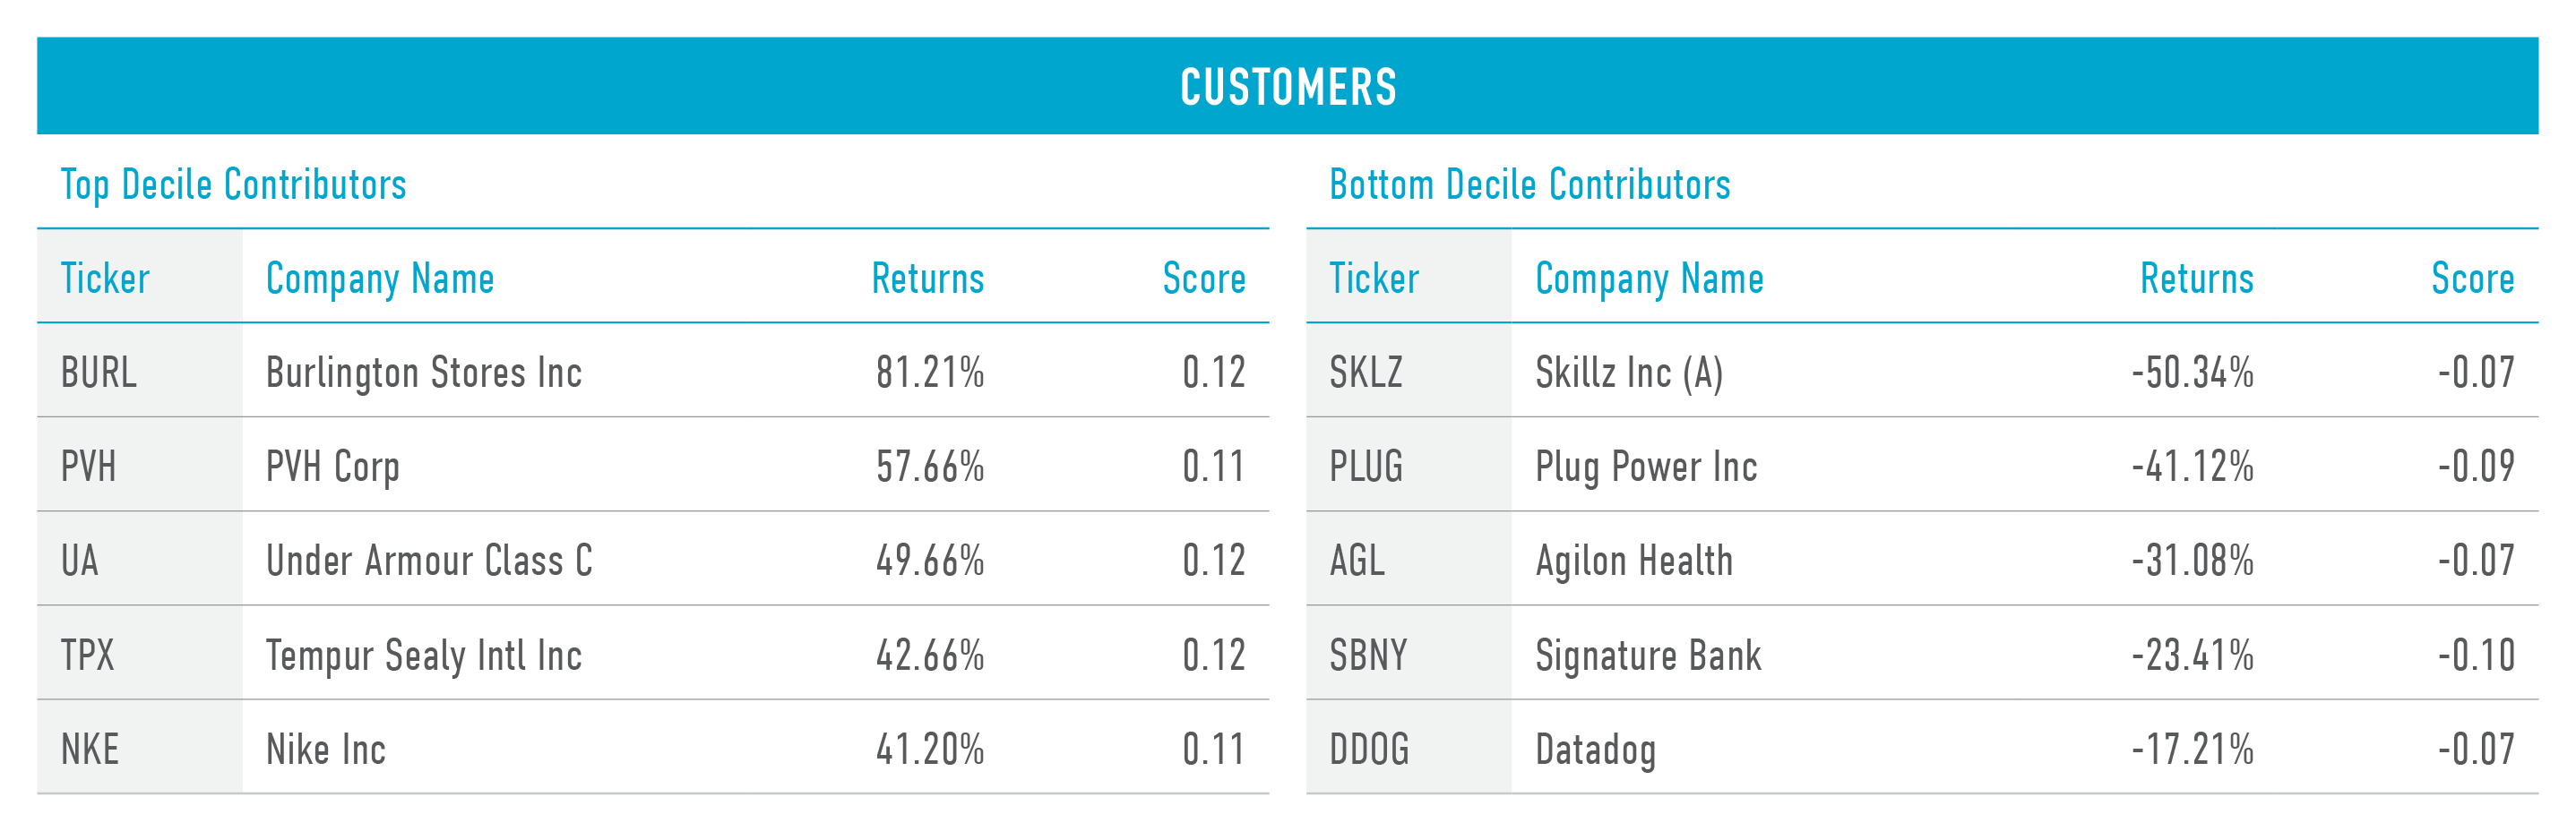
Shown below are the both top and bottom five contributors to the top decile (D1), the best-ranked companies as measured by their Customer score, and the bottom decile (D10), the worst-ranked names as measured by Customer score).
Environment Performance
The Environment stakeholder measures a company across four Issues:
- Sustainable Products – Develops and supports sustainable products.
- Pollution Reduction – Minimizes pollution.
- Climate Change – Helps combat climate change.
- Resource Efficiency – Uses resources efficiently.
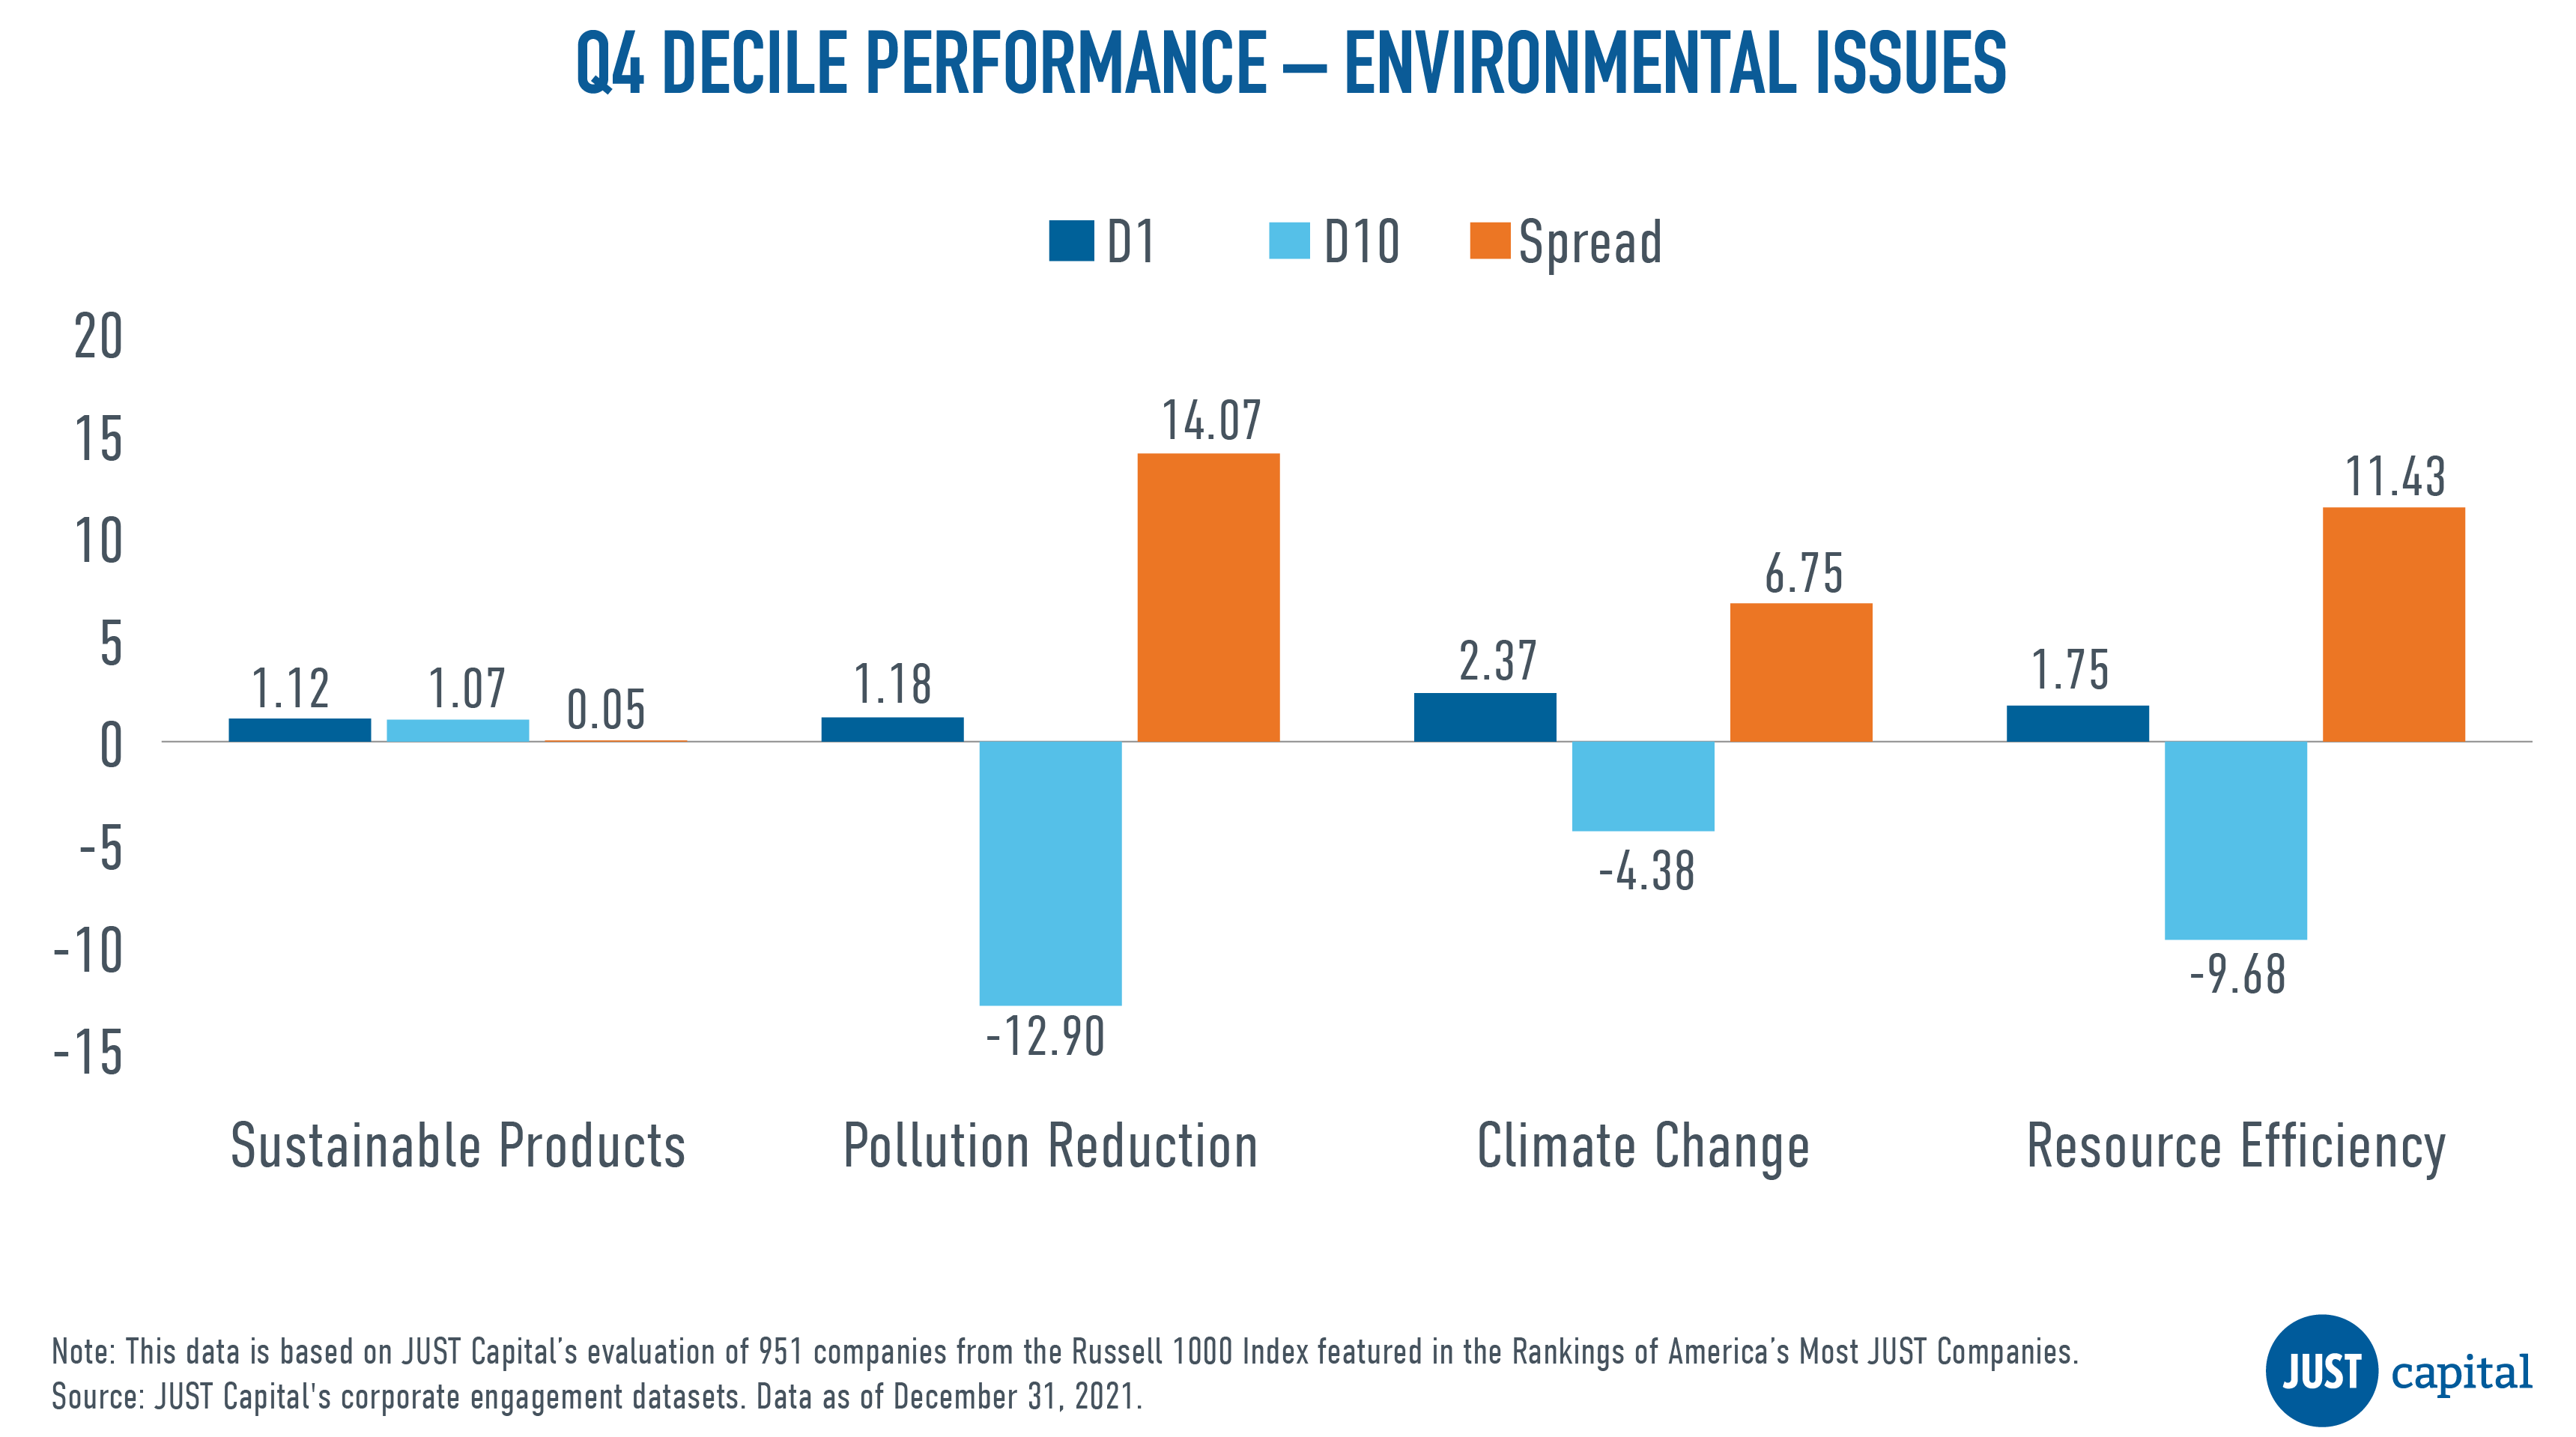
In Q3, we saw all the Environment Issues do well, with the Pollution Reduction Issue being the leader in performance amongst all the Issues in this quarter.
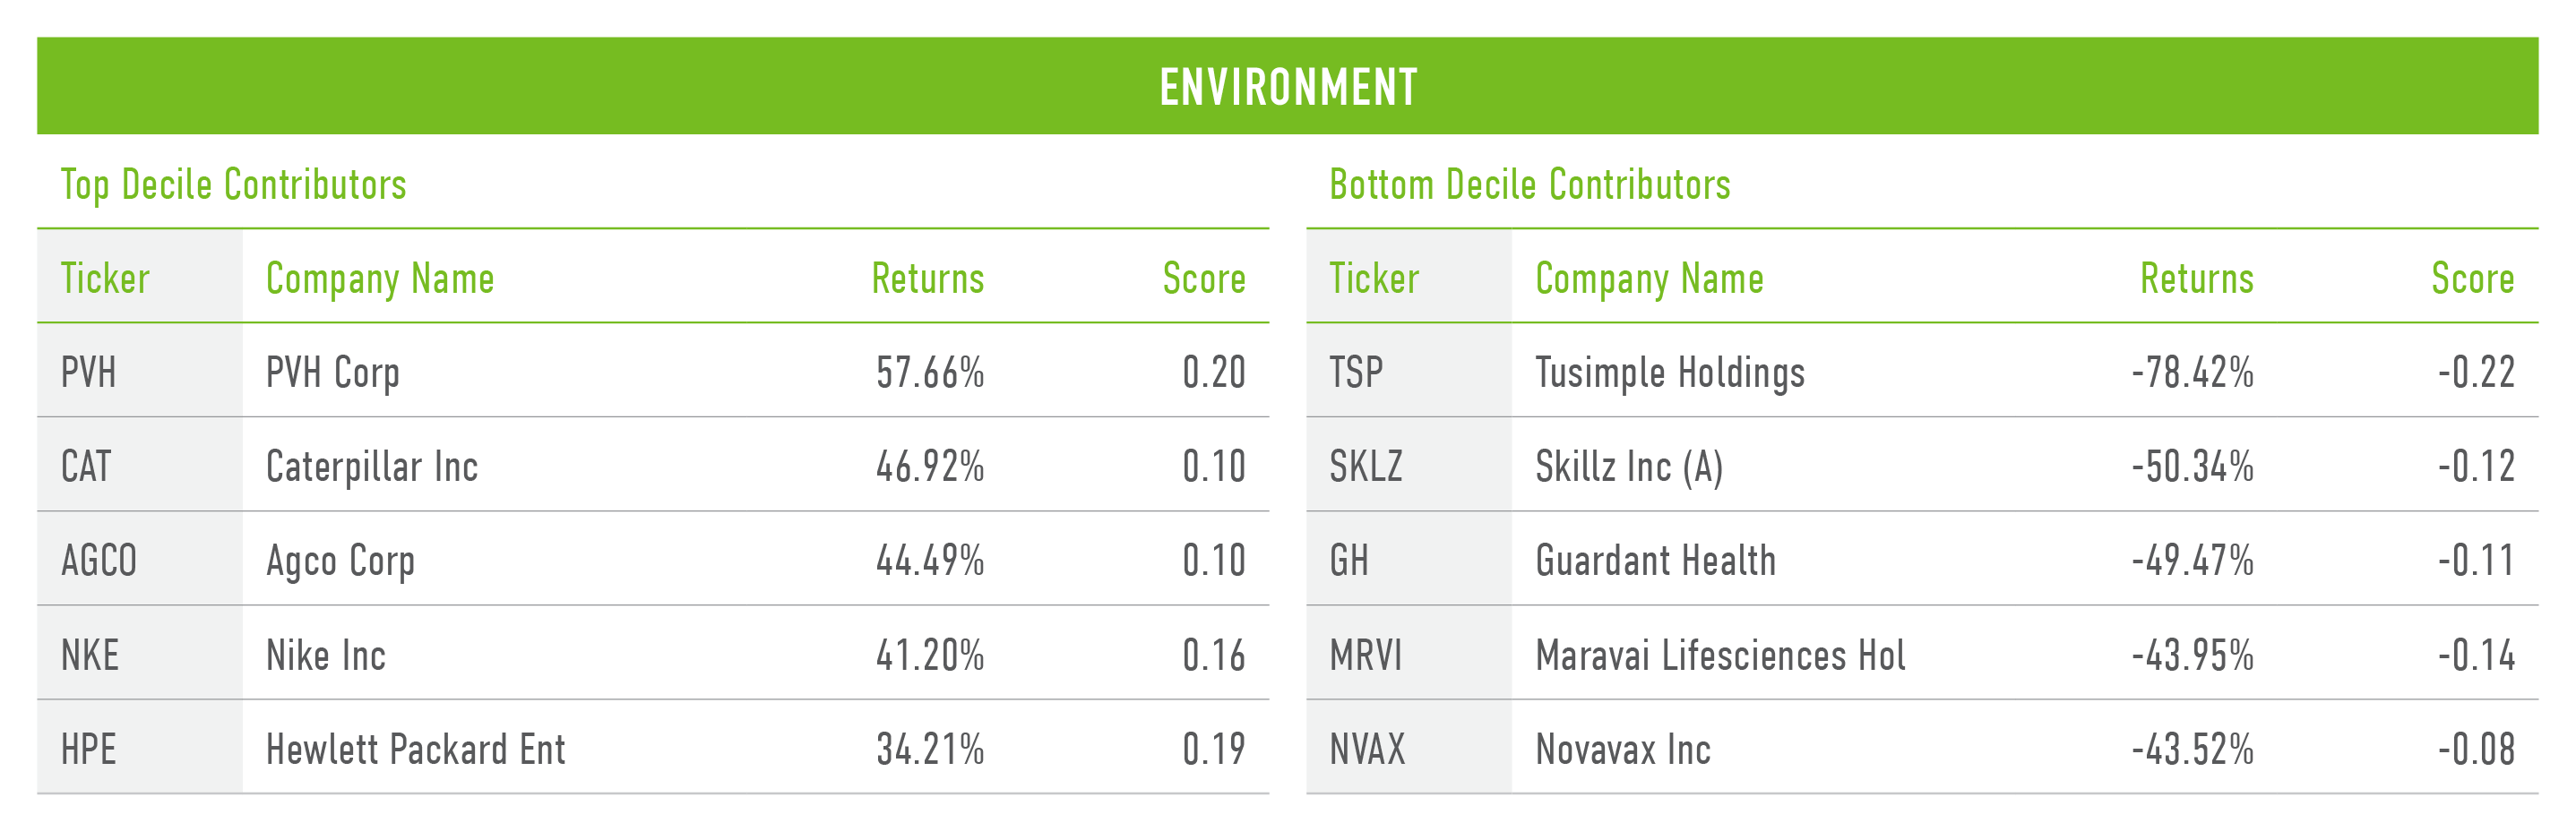
Shown below are the both top and bottom five contributors to the top decile (D1), the best-ranked companies as measured by their Environmental score, and the bottom decile (D10), the worst-ranked companies as measured by their Environmental score.
Appendix
Computation Methodology
We monitor the performance of these stakeholders and Issues on a long-short basis. The long and short portfolios are selected based on the factor scores as the top and bottom deciles within the universe of companies we track in the Russell 1000. Top decile (D1) companies are those that rank highest based on the factor score, and bottom decile (D10) companies are those that rank lowest based on the factor score.
D1 Performance is computed as:
(Equally weighted average of returns of stocks in D1 bucket) – (Equally weighted average of returns of all stocks within the Universe)
D10 Performance is computed as:
(Equally weighted average of returns of stocks in D10 bucket) – (Equally weighted average of returns of all stocks within the Universe)
Spread is computed as:
D1 Performance – D10 Performance