Political and business leaders from around the world will be in Sharm el-Sheikh, Egypt, from Nov. 6-18 for this year’s United Nations Climate Change Conference, COP27, to discuss long-term plans for reducing greenhouse gas emissions. Simultaneously, however, oil companies are riding a wave of high profits linked to first the reopening of the global economy followed by the massive energy sector disruption of the Russia-Ukraine war. In fact, the Russell 1000 Energy Index is the top performing sector year to date, up nearly 66%, compared to the broader market (Russell 1000 Index), which is off by 18.6% as of Oct 31 2022.
That’s sparked an ongoing ESG (Environmental, Social, Governance) debate throughout the year, over the role fossil fuel investment plays when there is a short-term urgency for oil and gas and a long-urgency for clean energy – as well as pressure from the White House to direct a higher portion of profits to investment in energy production rather than to buybacks.
JUST does not come to this as a typical ESG aggregator, but rather measures and ranks America’s largest public companies according to the priorities of the public, as measured in our extensive polling research that takes into the workers, communities, customers, shareholders, and the environment stakeholders. We’ve found that the leading energy companies as designated by Industry Classification Benchmark (ICB) – in our 2022 Rankings of America’s Most JUST Companies have outperformed their sector peers.
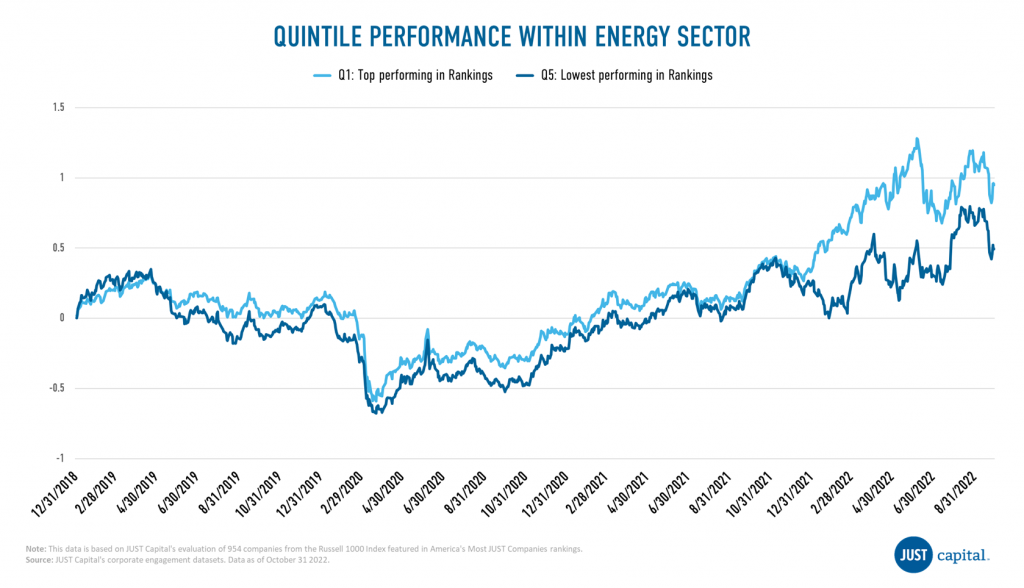
Specifically, companies that score in the top quintile of energy companies across all five stakeholder groups we measure have had 45.7% outperformance versus the bottom quintile from January 1, 2019 to September 30, 2022. Companies in the top quintile include Exxon Mobil (ranked 89th in 2022), ConocoPhillips (106th), and Chevron (110th). This top quintile has also returned 95.07%, beating the Russell 1000 Energy Index’s return of 55.85% from January 1, 2019 to September 30, 2022.
Rising rates and high valuations along with a soaring U.S. dollar have led investors to move away from technology companies towards energy as an inflation hedge, and it’s an attractive one not only on a valuation basis but on a free cash flow yield basis.
However, as evidenced above investors should also take note of which companies perform best in serving their stakeholders as another critical lens into their assessments.
The Investor Strategies team at JUST Capital leverages our in-depth company research and polling of the American public to delivering innovative commercial and programmatic solutions, build strategic partnerships and initiatives, and produce leading-edge research, insights, and thought leadership. Please reach out using this request form below to learn more about partnering with JUST.
November 1, 2022
Report by Director of Quantitative Research & Analytics Mona Patni.
Markets remained very volatile in Q3 2022. Global markets fell in the third quarter as inflation remained near multi-decade highs, geopolitical tensions escalated, and the Federal Reserve reaffirmed its commitment to raising interest rates to fight inflation. The Russell 1000 index after a rally in July returned -4.6% in Q3 after FOMC meeting minutes and Fed member speeches stoked fears the Fed could tighten too much and push the economy into recession. With respect to sector performance, the communication services sector was the worst performing sector over the quarter, along with real estate. The consumer discretionary was the best performing sector followed by energy.
During this challenging period, Just Capital found that two of the five stakeholders we track delivered positive performance, with the exception of the Environment, Customers and Shareholders. The Workers stakeholder delivered the best performance over this period with a long-short spread of 2.05%. Within the Environment and Customers stakeholders, underperformance was driven by both deciles, with the top decile underperforming and bottom decile outperforming, and within the Shareholders stakeholder, underperformance was primarily driven by the bottom decile.
Just Capital’s Overall Weighted Score takes into account the 20 core Issues determined through our survey research – including paying a living wage, creating a diverse, inclusive workplace, and helping combat climate change – across key business stakeholders: Workers, Communities, Shareholders and Governance, Customers, and Environment. This Overall Weighted Score had a negative long-short spread of -0.64% over the period ending September 30, 2022.
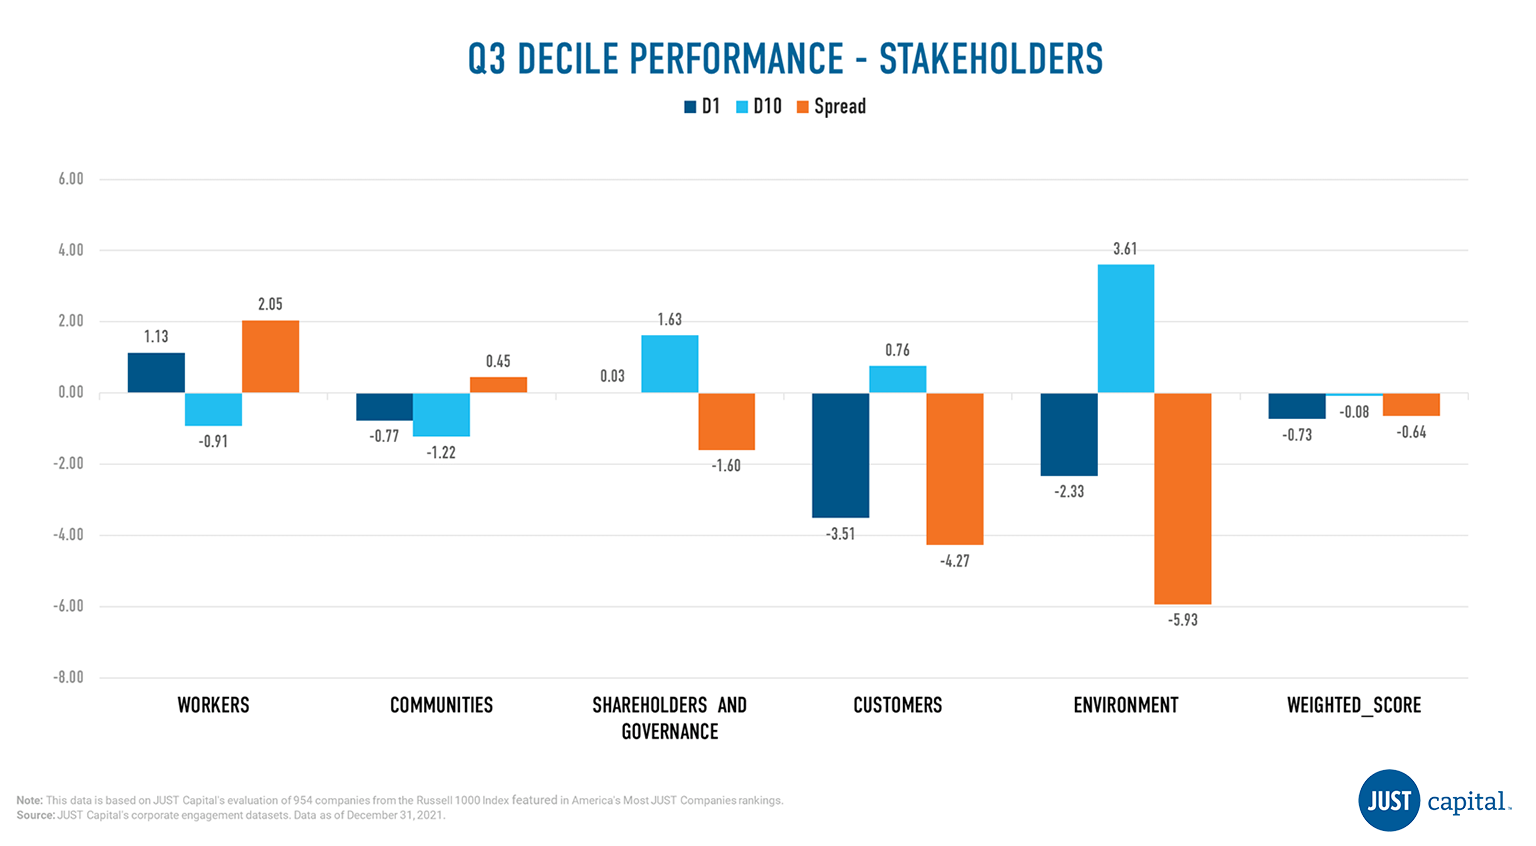
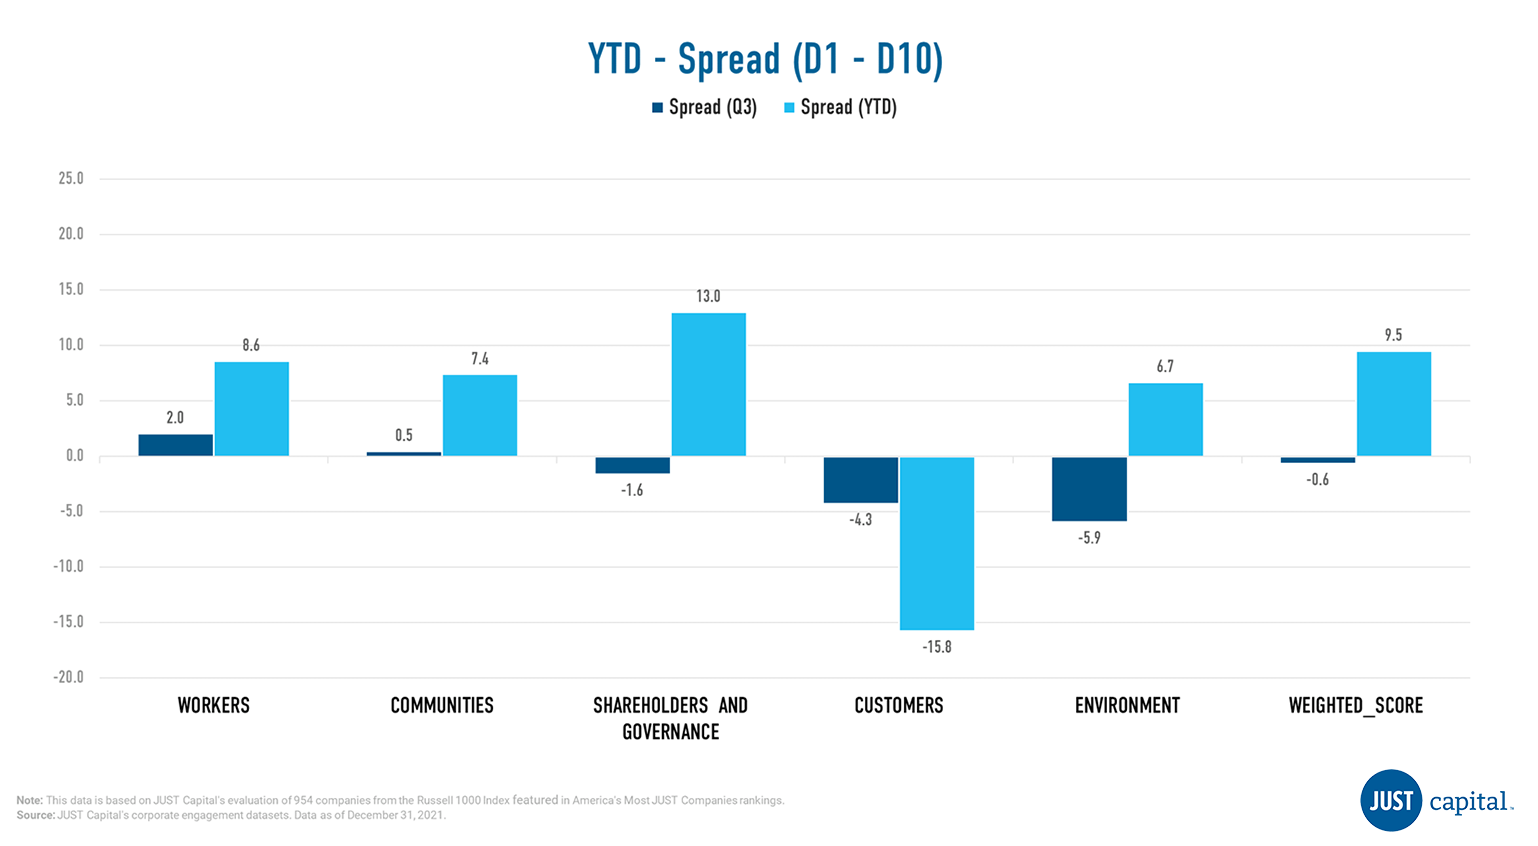
Shown below is the Year-to-Date (YTD) and Q3 performance, which is quantified by the spread between the top and bottom deciles of all the stakeholders and the overall weighted score.
The Workers stakeholder measures a company across five Issues:
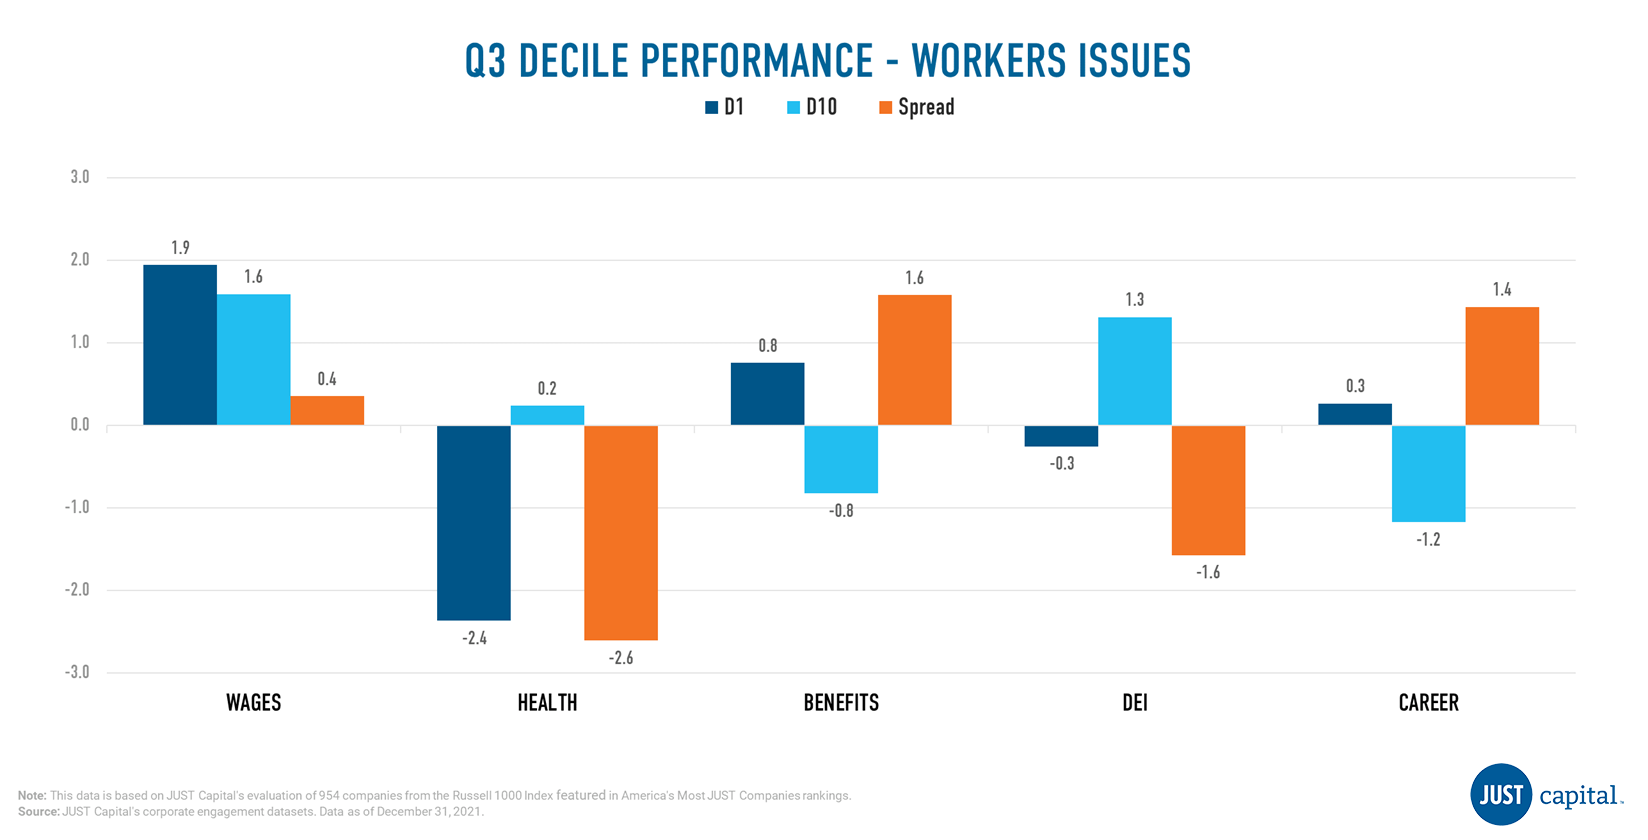
In Q3, we saw three out of five Worker Issues outperform. Underperformance in Health and DEI was driven by negative performance from both top and bottom decile companies.
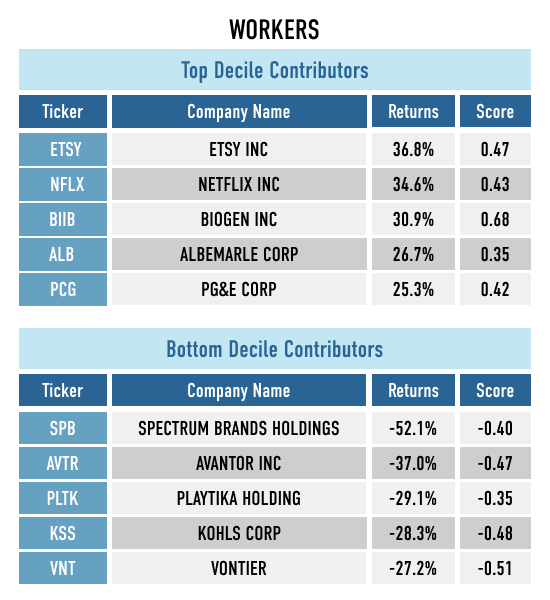
Shown below are the top and bottom five contributors to the top decile (D1), the top-ranked companies as measured by their Workers score, and the bottom decile (D10), the lowest-ranked companies as measured by their Worker score.
The Communities stakeholder measures a company across four Issues:
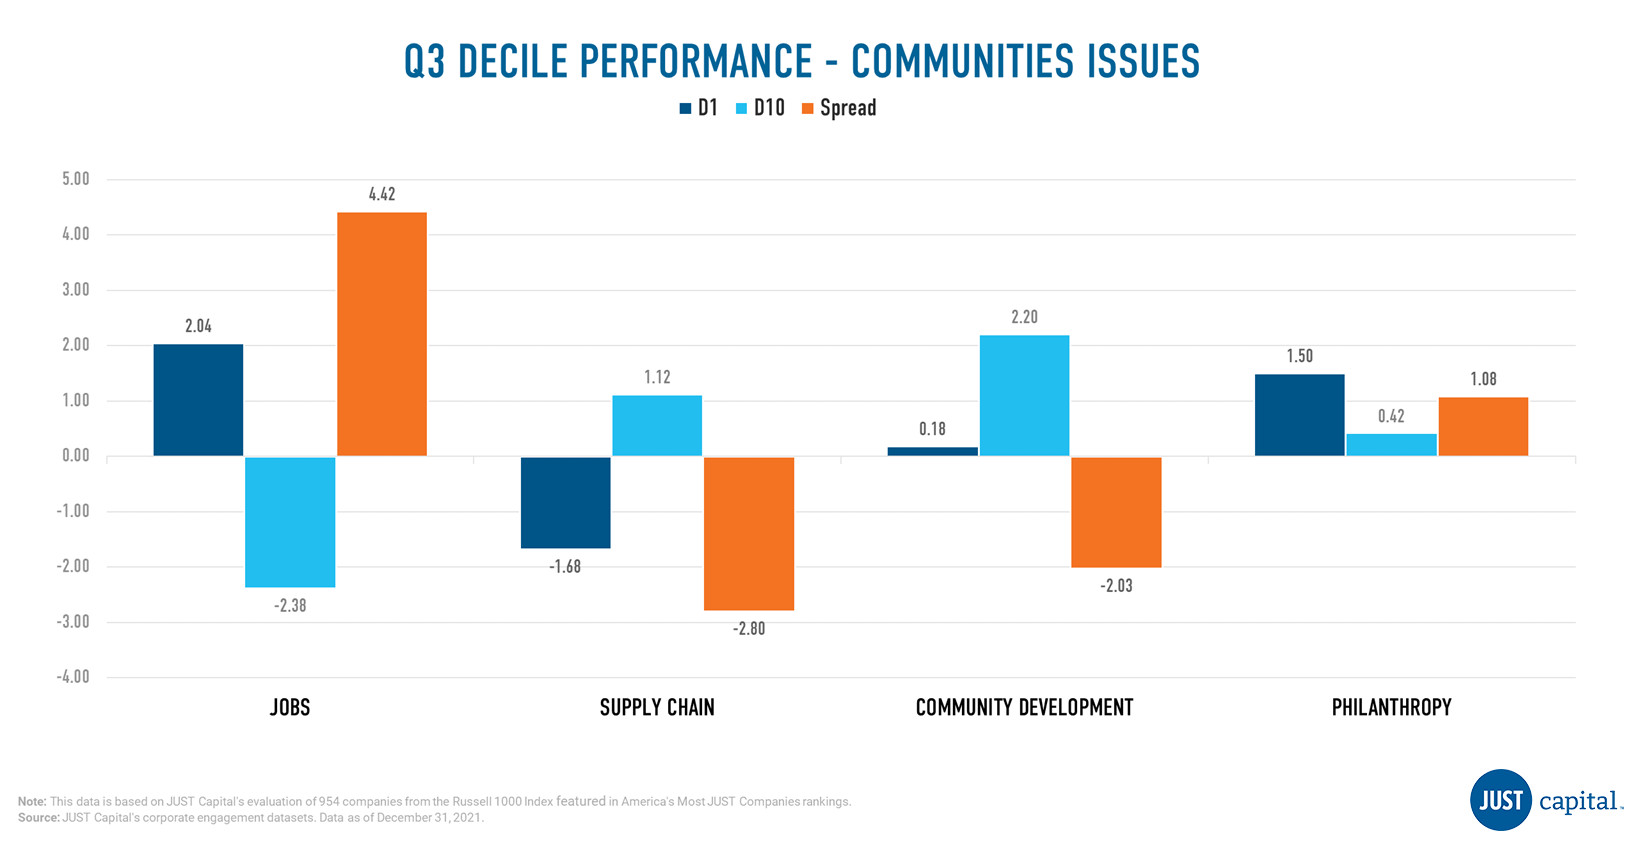
Jobs and Philanthropy within Communities were positive contributors to the stakeholder’s performance whereas Supply Chain and Community Development didn’t add to performance.
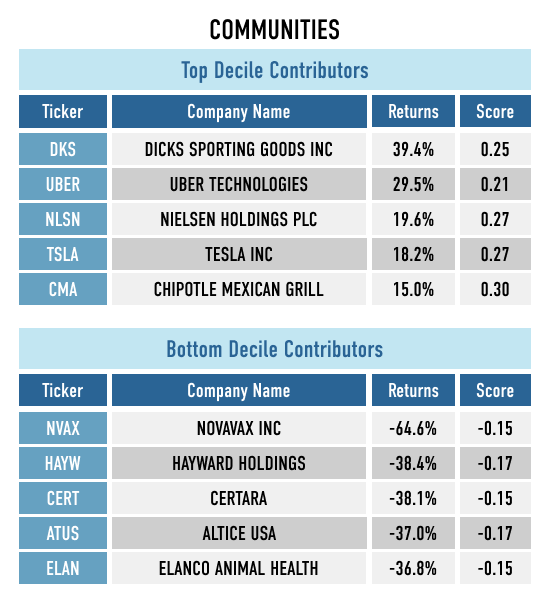
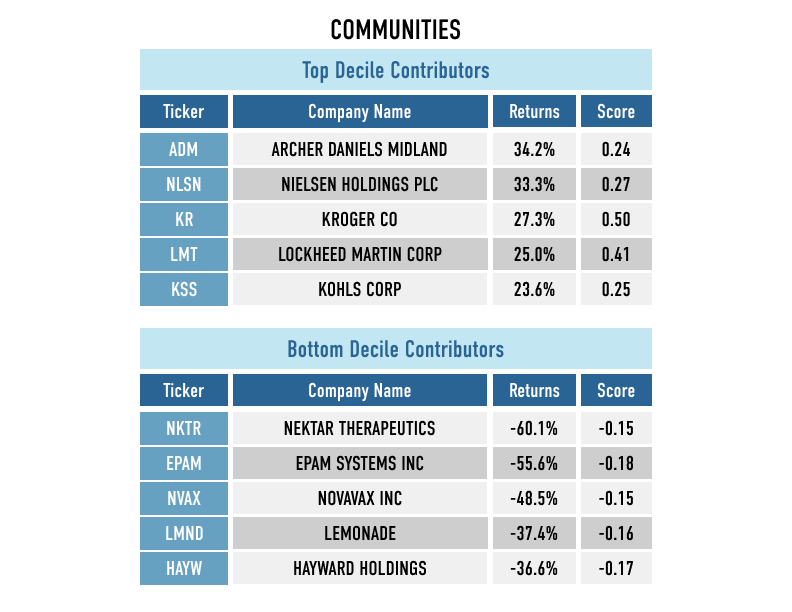
Shown below are the both top and bottom five contributors to the top decile (D1), the best-ranked companies as measured by their Communities score, and the bottom decile (D10), the worst-ranked companies as measured by their Communities score.
The Shareholders and Governance stakeholder measures a company across three Issues:
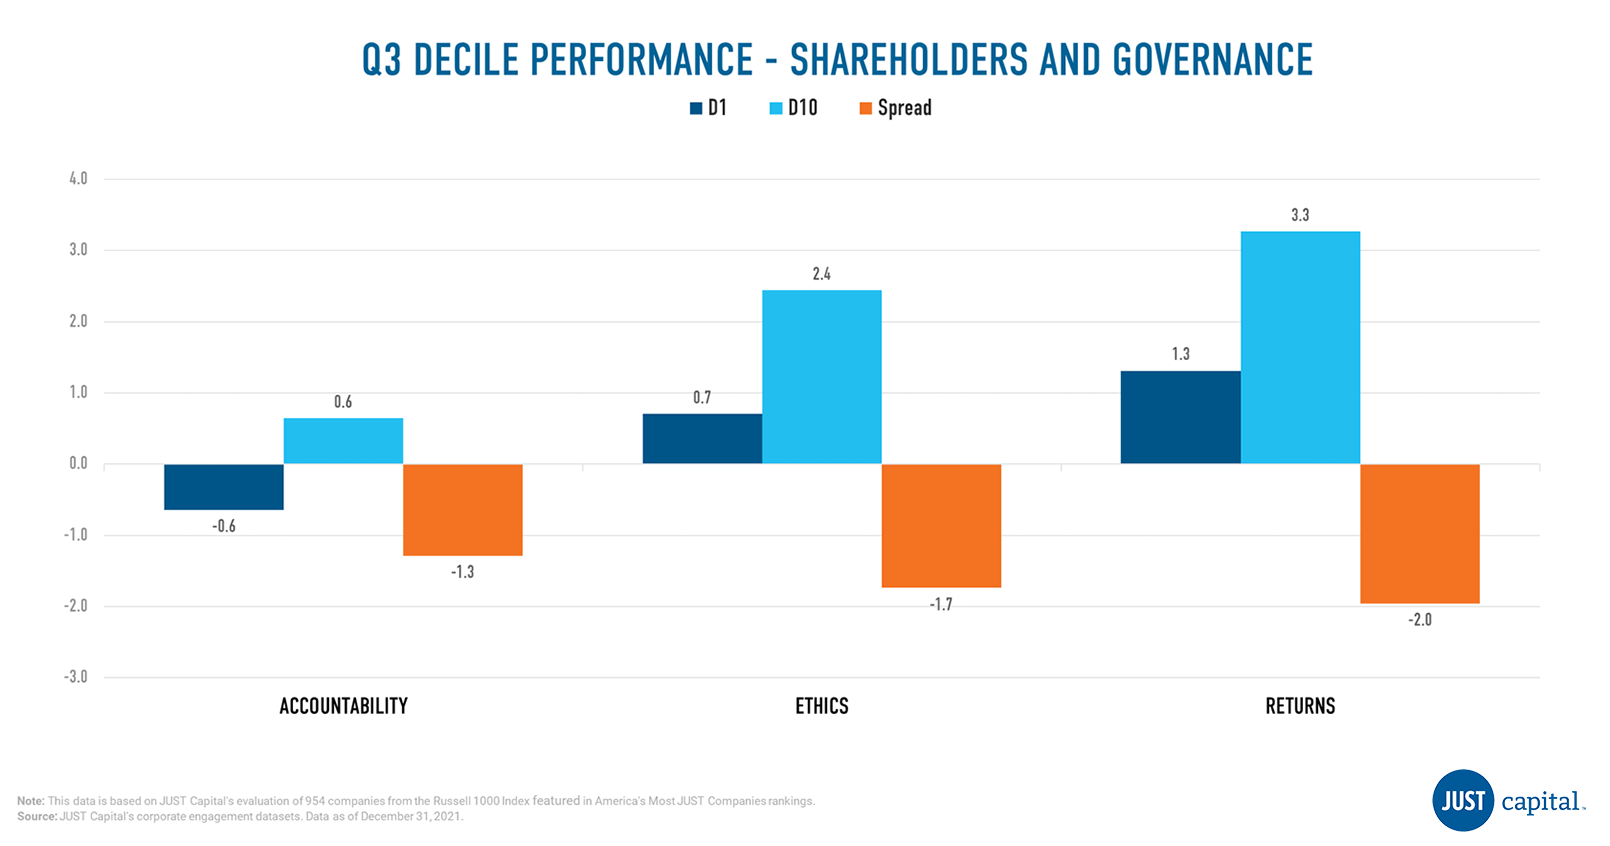
In Q3 we saw the Returns issue under-perform the other Shareholder and Governance issues, with a long-short spread of -2%.
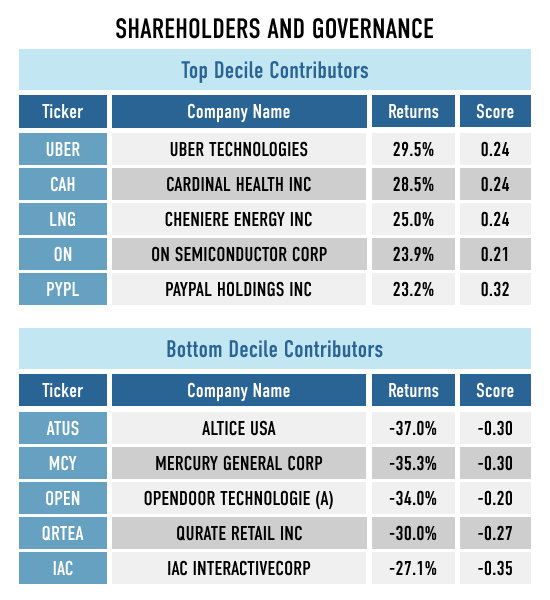
Shown below are the both top and bottom five contributors to the top decile (D1), the best-ranked companies as measured by their Shareholders and Governance score, and the bottom decile (D10), the worst-ranked companies as measured by their Shareholders and Governance score.
The Customers stakeholder measures a company across four Issues:
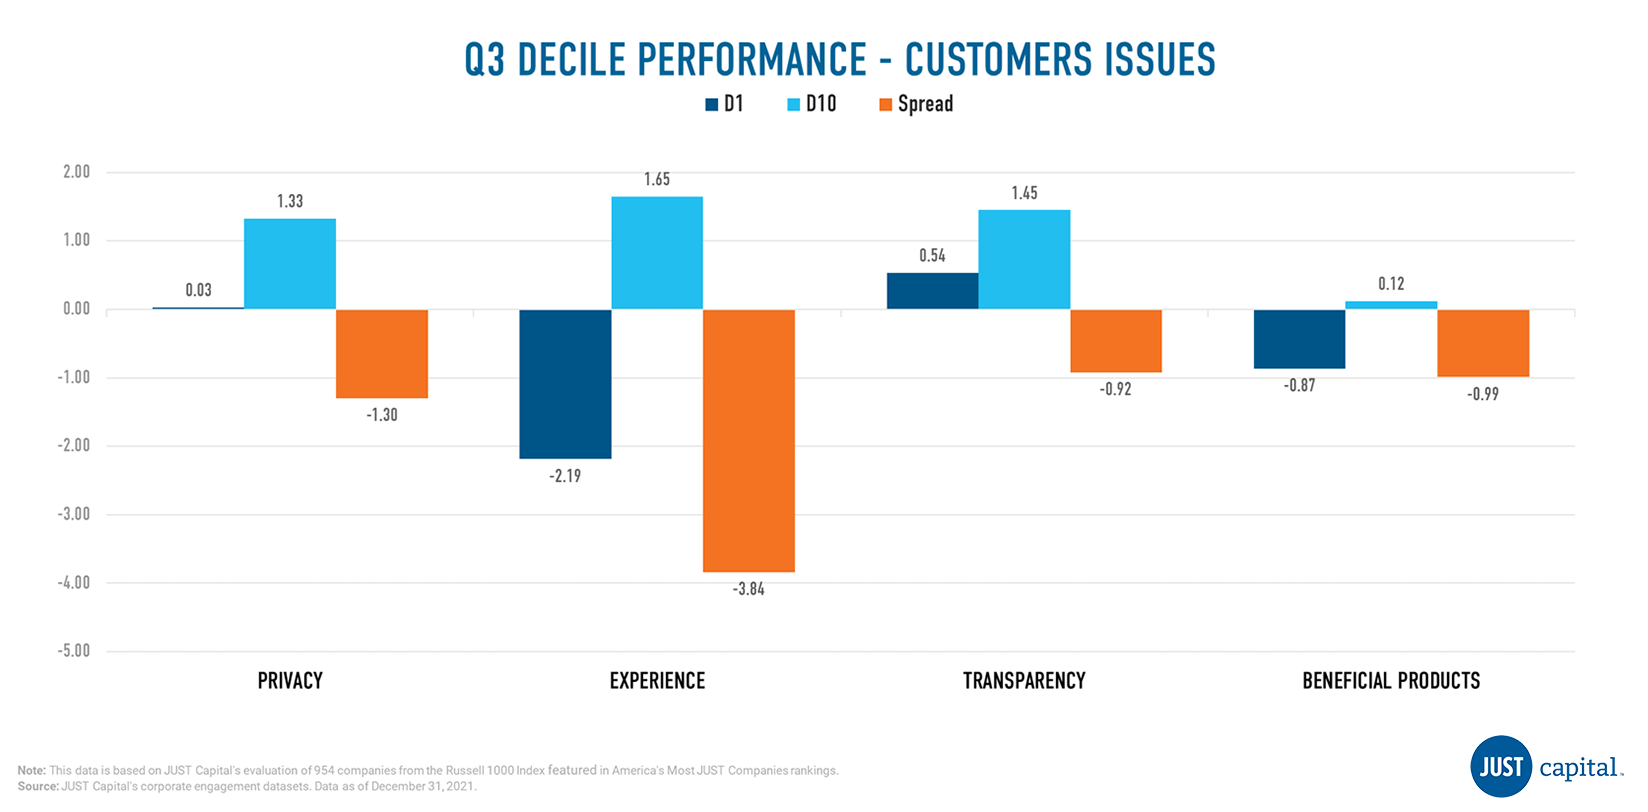
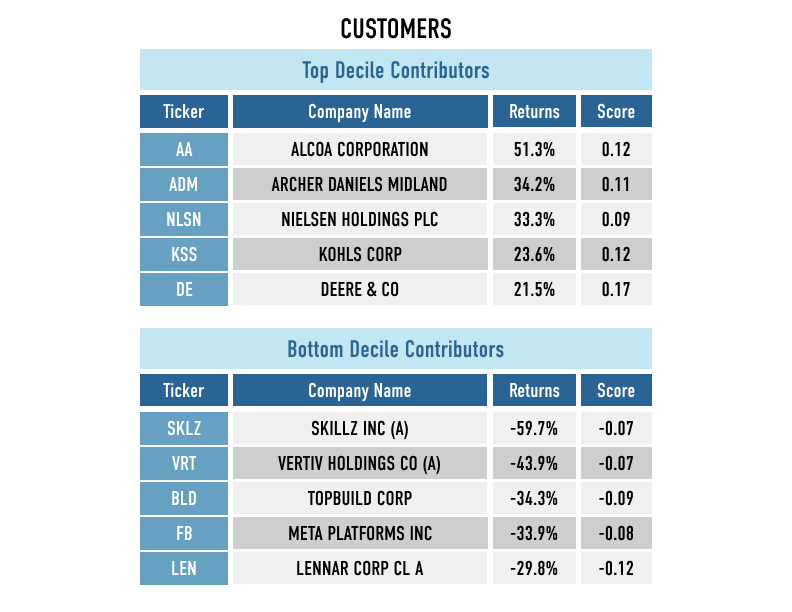
In Q3, we saw the Experience underperform the other Customer Issues, with a long-short spread of 3.8%. Beneficial Products, Privacy, and Transparency also were negative contributors to Customer performance.
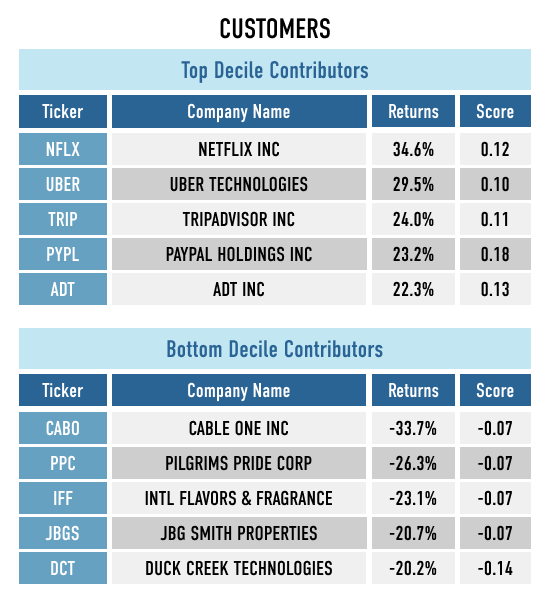
Shown below are the both top and bottom five contributors to the top decile (D1), the best-ranked companies as measured by their Customer score, and the bottom decile (D10), the worst-ranked names as measured by Customer score.
The Environment stakeholder measures a company across four Issues:
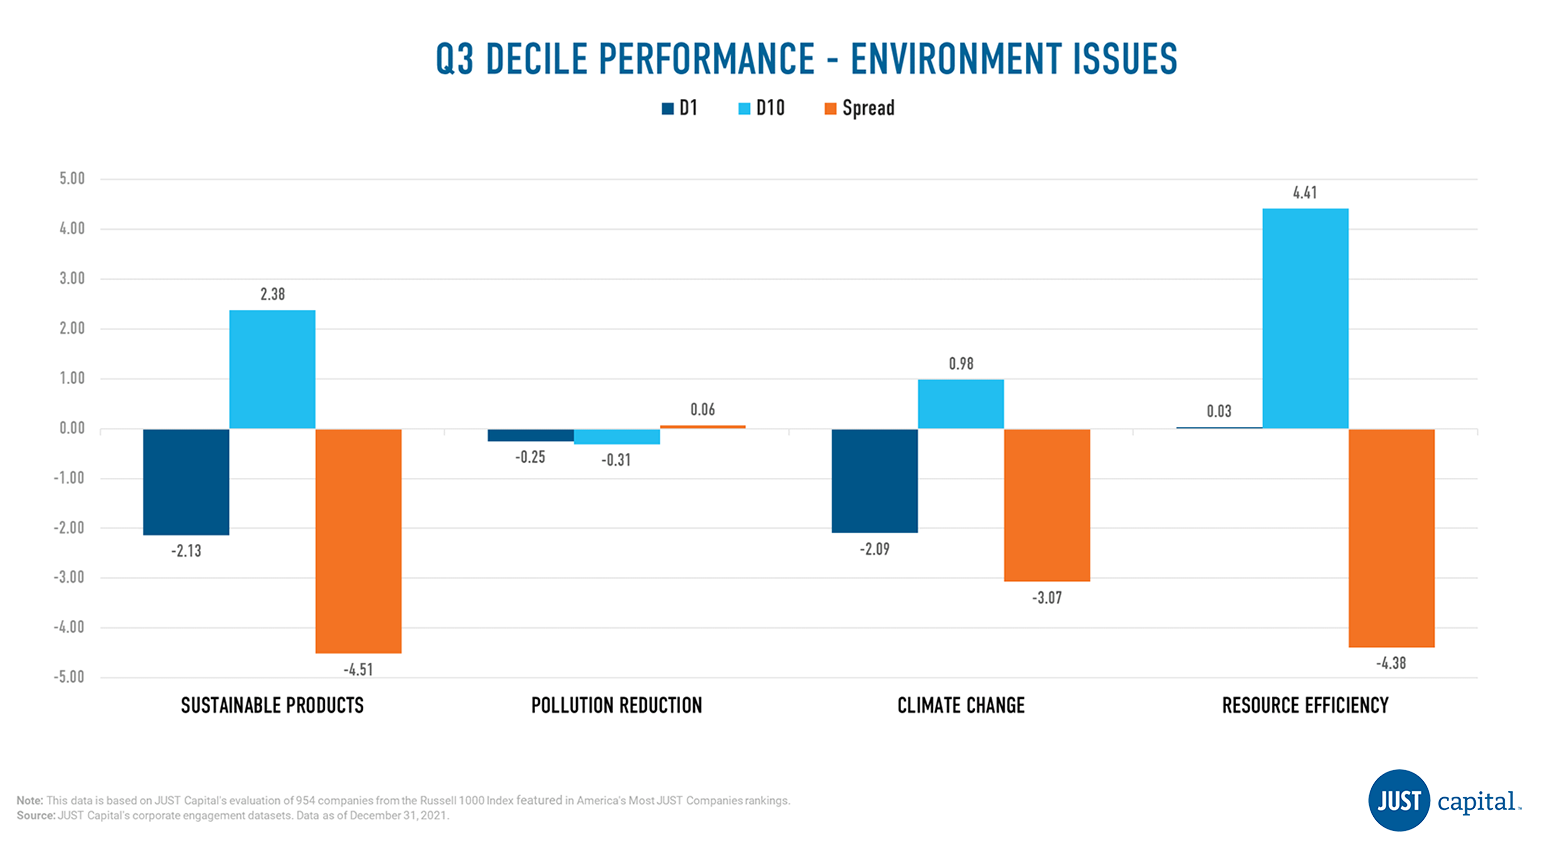
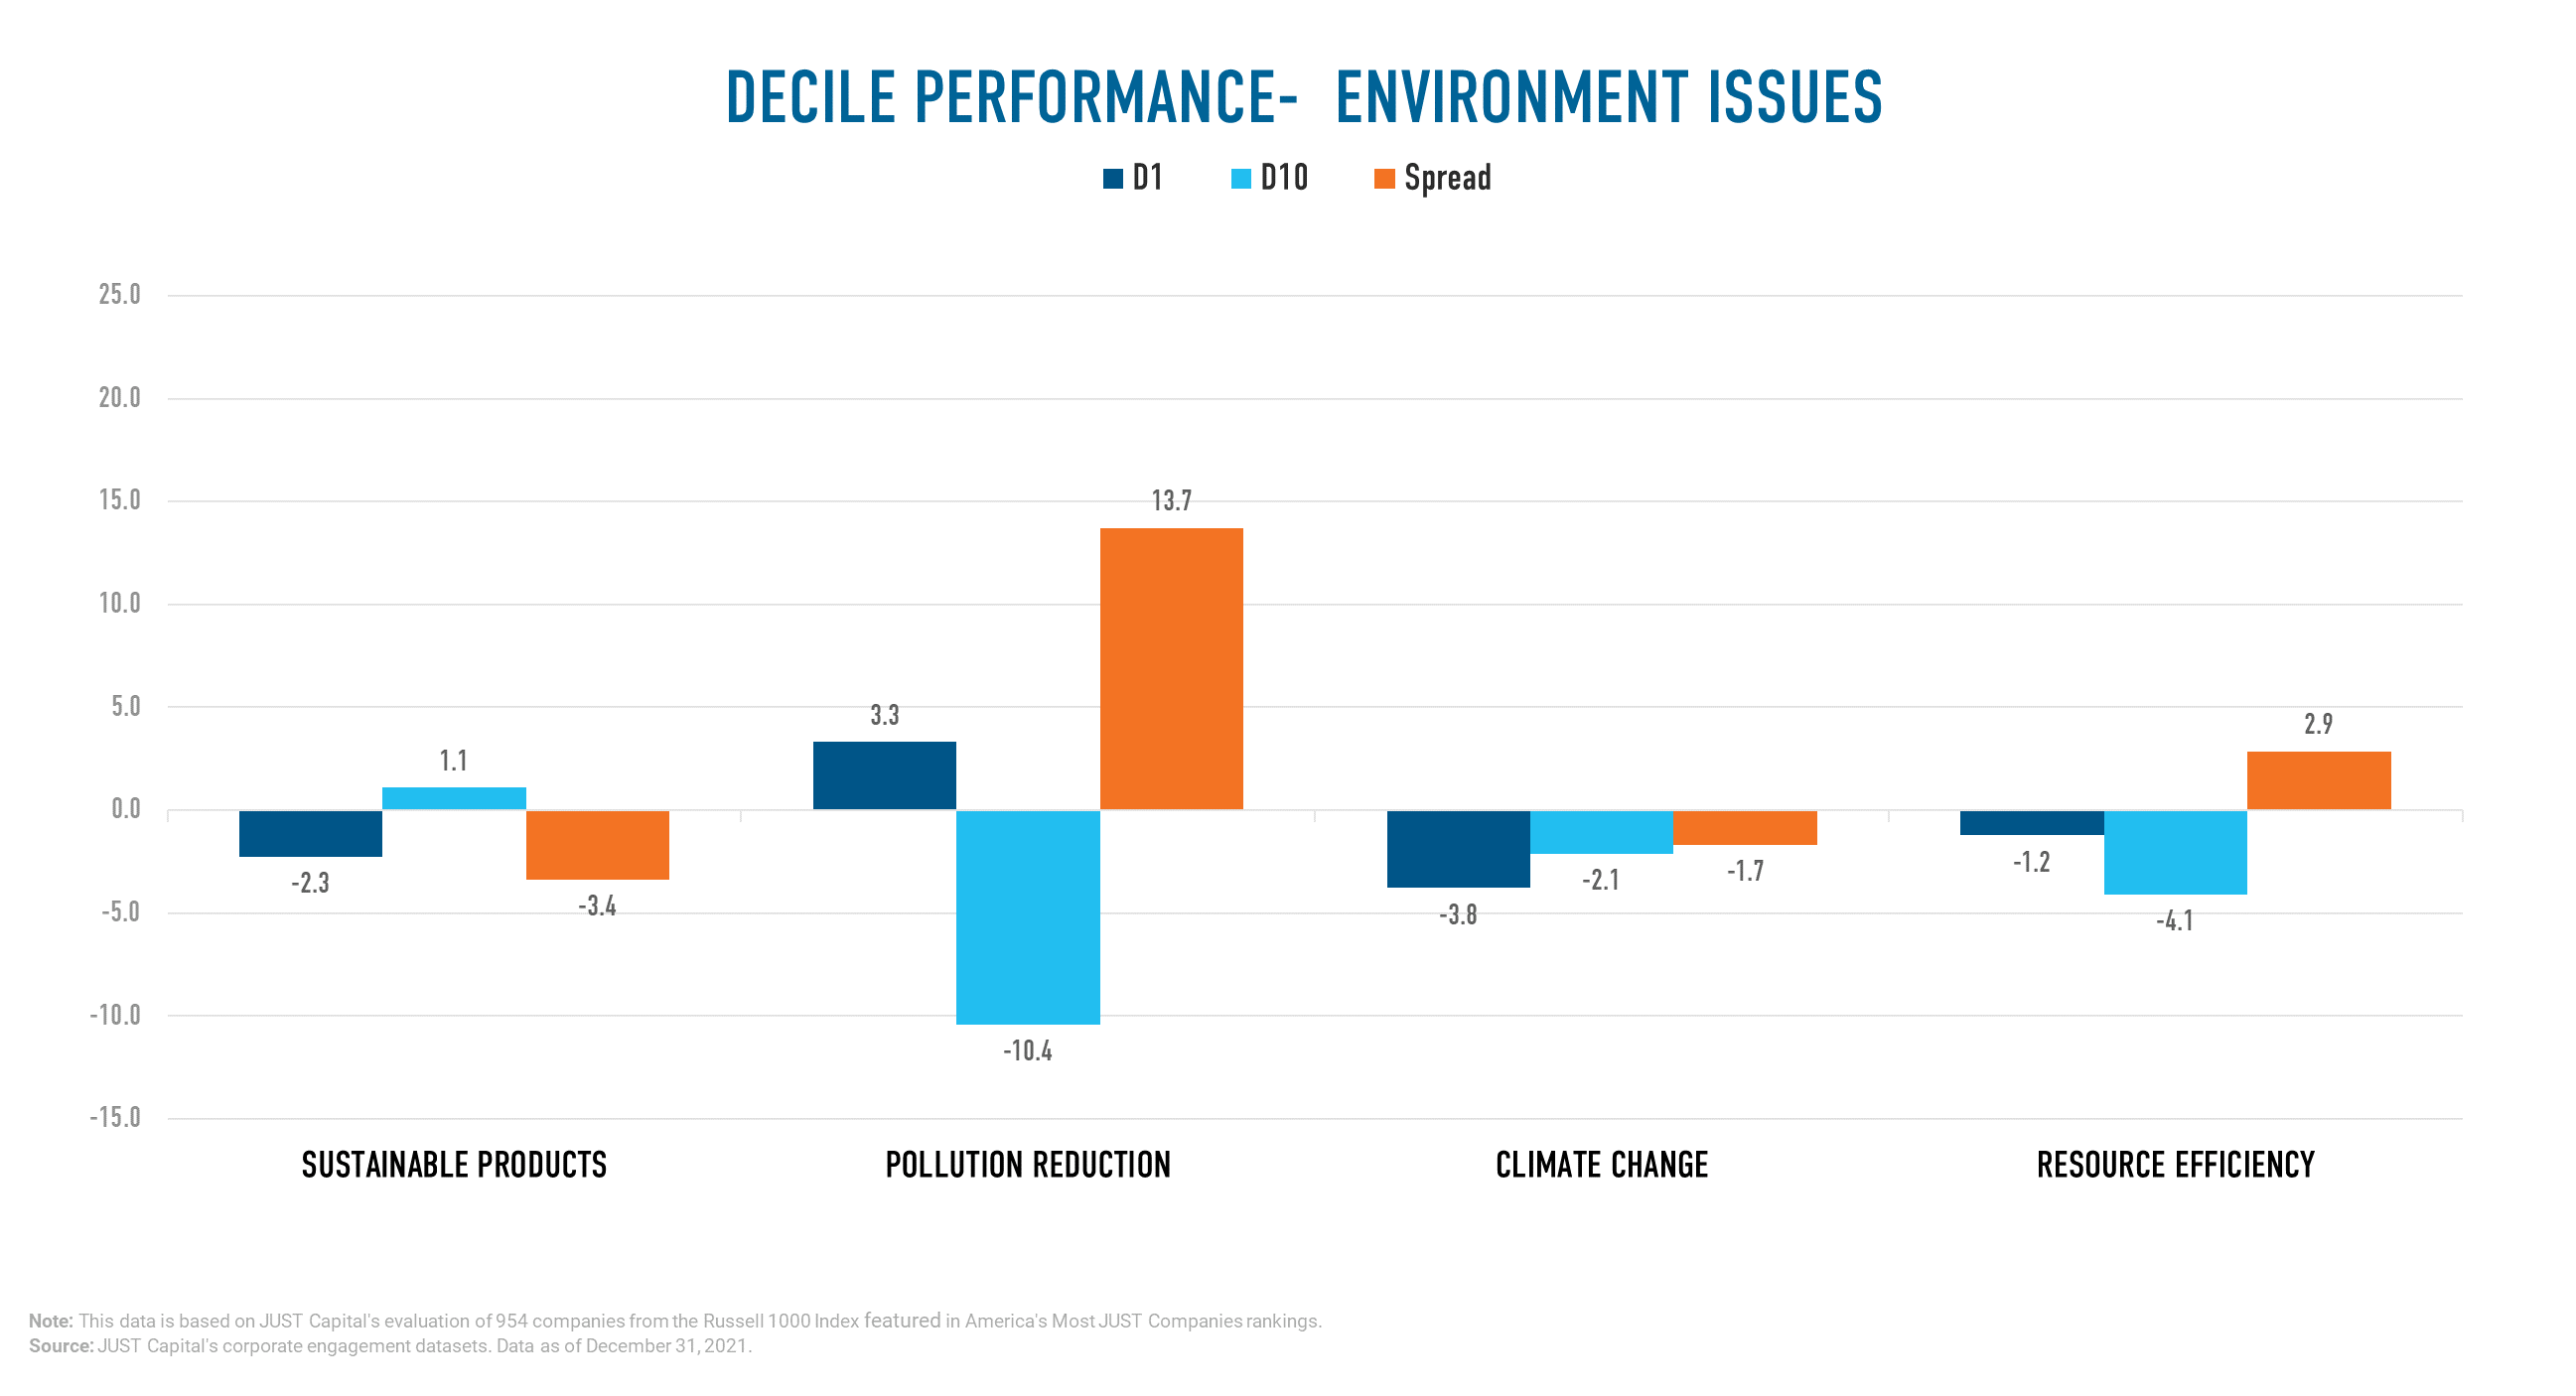
In Q3, we saw Pollution Reduction outperform other Environment Issues. Resource Efficiency, Sustainable Products and Climate Change delivered negative performance in this quarter.
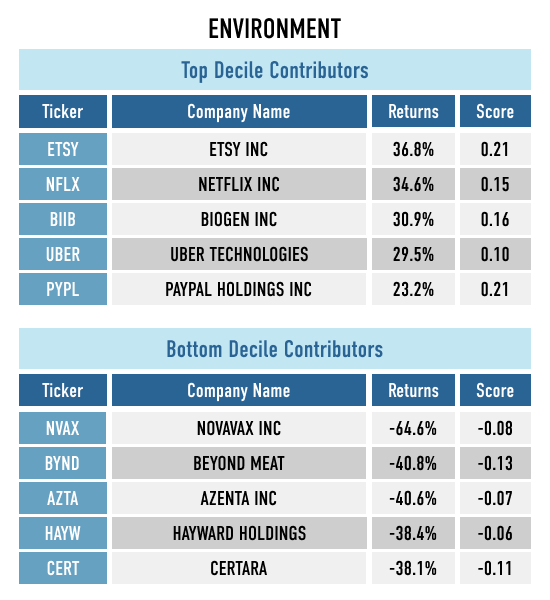
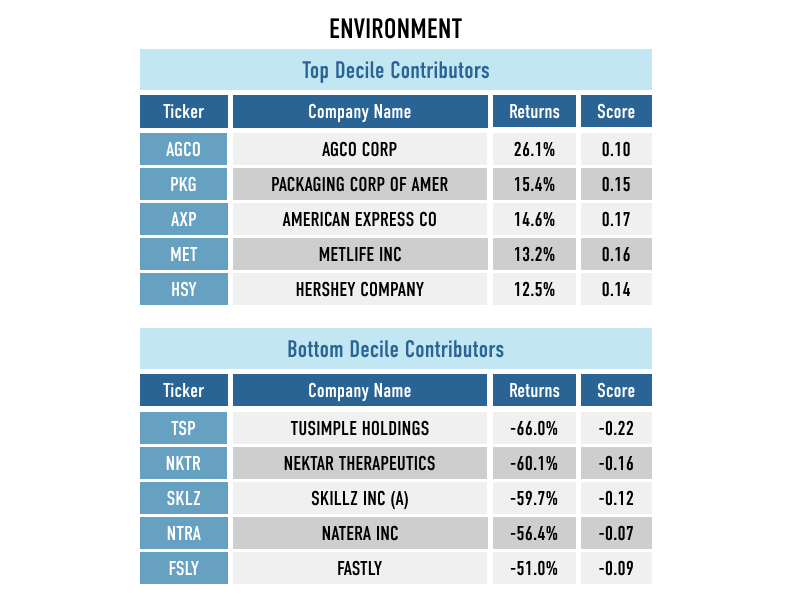
Shown below are the both top and bottom five contributors to the top decile (D1), the best-ranked companies as measured by their Environmental score, and the bottom decile (D10), the worst-ranked companies as measured by their Environment score.
We monitor the performance of these stakeholders and Issues on a long-short basis. The long and short portfolios are selected based on the factor scores as the top and bottom deciles within the universe of companies we track in the Russell 1000. Top decile (D1) companies are those that rank highest based on the factor score, and bottom decile (D10) companies are those that rank lowest based on the factor score.
D1 Performance is computed as:
(Equally weighted average of returns of stocks in D1 bucket) – (Equally weighted average of returns of all stocks within the Universe)
D10 Performance is computed as:
(Equally weighted average of returns of stocks in D10 bucket) – (Equally weighted average of returns of all stocks within the Universe)
Spread is computed as:
D1 Performance – D10 Performance
As companies navigate their commitments to stakeholder capitalism as strategy beyond shareholder primacy faces a resurgence of political blowback, it’s worth considering how the corporations we’ve found to be “just” are actually performing.
To do that, we’re taking a look at how the JUST U.S. Large Cap Diversified Index (JULCD) and JUST 100 Total Returns Index (JUONETR) have been performing against their Russell 1000 benchmark, as well as how leading companies perform against their less just peers at the bottom of JUST Capital’s Rankings of America’s Most JUST Companies. What we’ve found is that companies that prioritize all their stakeholders – we measure performance for Workers, Customers, Communities, Shareholders, and the Environment – not only don’t suffer consequences for investments beyond short-term profit maximization, they even tend to outperform their peers.
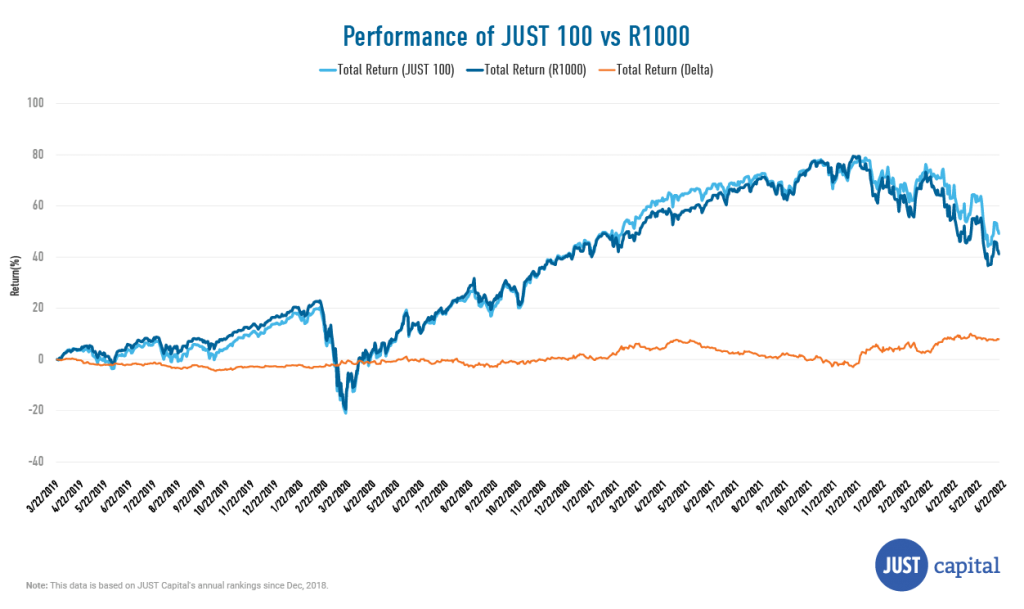
Below, we show the performance of the top (D1) and bottom (D10) deciles of JUST’s Rankings using our Overall Weighted Score and the Russell 1000 Equal Weighted Index from Jan 2018 to June 2022. D1 is composed of the top 10% of the companies we rank whereas D10 consists of the bottom 10%.
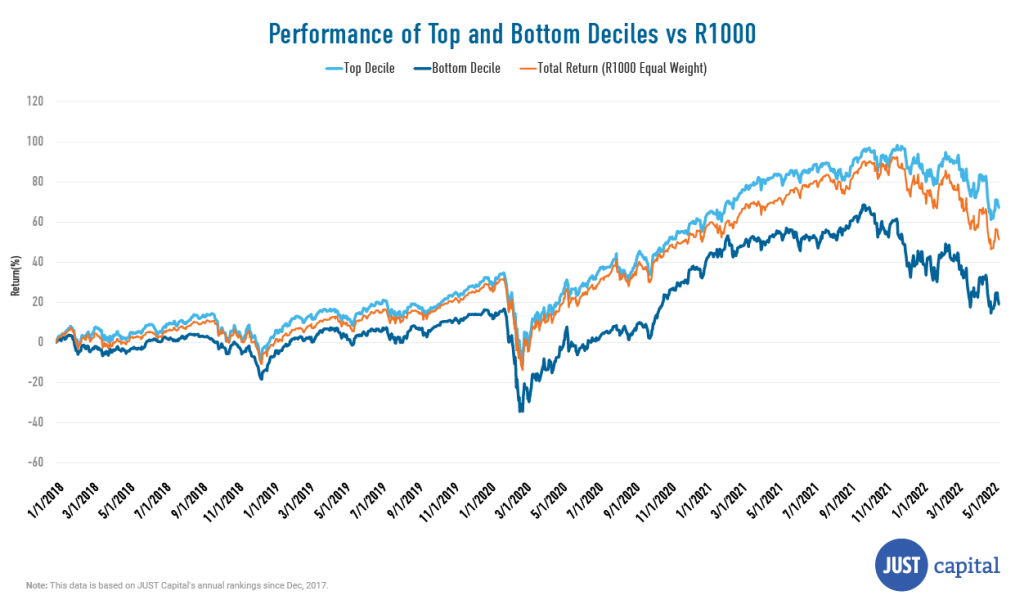
The JUST Overall Weighted Score takes into account the 20 core Issues identified through our survey research as top priorities for just business – including paying a living wage, creating a diverse, inclusive workplace, and helping combat climate change – across key business stakeholders. This score delivered a spread of 48.09% between D1 and D10 over the period ending June 30, 2022.
D1, with returns of 67.12%, has outperformed the R1000 Equal Weighted Index (returns of 51.26%) by 15.86%. D10, which has returns of 19.02%, has underperformed the Russell 1000 Equal Weighted Index (returns of 51.26%) by 32.24%.
Using the Rankings and the Overall Score we have created JUST Capital’s investable indexes and financial products, which enable investors to implement our research and methodology and drive dollars toward just companies. These indices have demonstrated the investor case for just business behavior, showing that the companies prioritizing these core Issues can be more resilient over the long term.
Our flagship index, the JULCD, began live trading in November 2016 and tracks the top 50% of Russell 1000 companies ranked by JUST Capital by industry, and is constructed to match its industry weights. It has outperformed the benchmark since inception by 7.53% as of June 30, 2022.
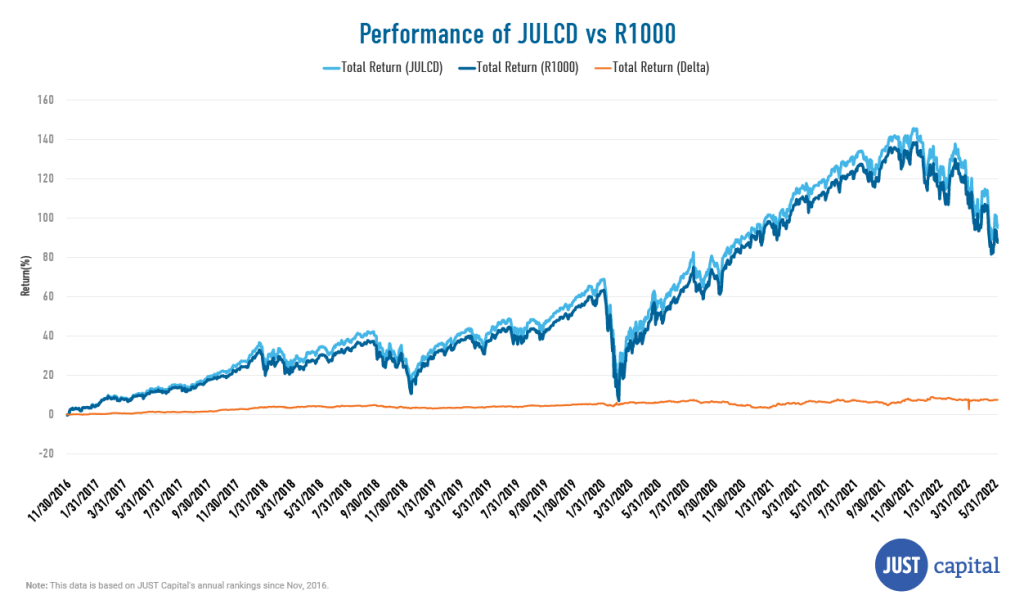
The JULCD Index also provides the basis for the Goldman Sachs JUST U.S. Large Cap ETF (JUST ETF), which seeks to provide investment results that closely correspond, before fees and expenses, to the performance of the JULCD.
The second live index that we have created is the JUONETR, which was constructed to track JUST Capital’s top-performing companies. It is an equal weighted index that launched in March 2019 and includes the top 100 Russell 1000 companies ranked by JUST Capital in its annual Rankings.
The JUST 100 Index has outperformed the benchmark since inception by 8.01% as of June 30, 2022.
The Investor Solutions team at JUST Capital continues to expand the suite of products tracking our in-depth company research and polling of the American public. We firmly believe that together we can create a more just and equitable marketplace that works for all Americans. Please reach out using this request form below if you have an interest in partnering with us to launch the next stakeholder-driven strategy.
Report by Director of Quantitative Research & Analytics Mona Patni.
In quant investing, factors form the basis of performance. Here, we evaluate the stakeholder and issue scores that Jusr Capital computes for Russell 1000 companies as factors and see if the signal based on the score can translate into alpha over the period being considered.
When we say stakeholder performance, we are measuring the financial performance of firms in the top 10% of each stakeholder group (D1), compared to the bottom 10% of this group (D10). The top 10% of Workers, for example, means the companies with the top 10% of scores for Workers, i.e. the best companies for workers. We then see if these signals are useful in separating one group of stocks from another by sharing the quarterly performance of the portfolios. We then apply this approach to the Issues that comprise each stakeholder. In both cases, we will refer to the portfolios by the stakeholder or Issue they represent.
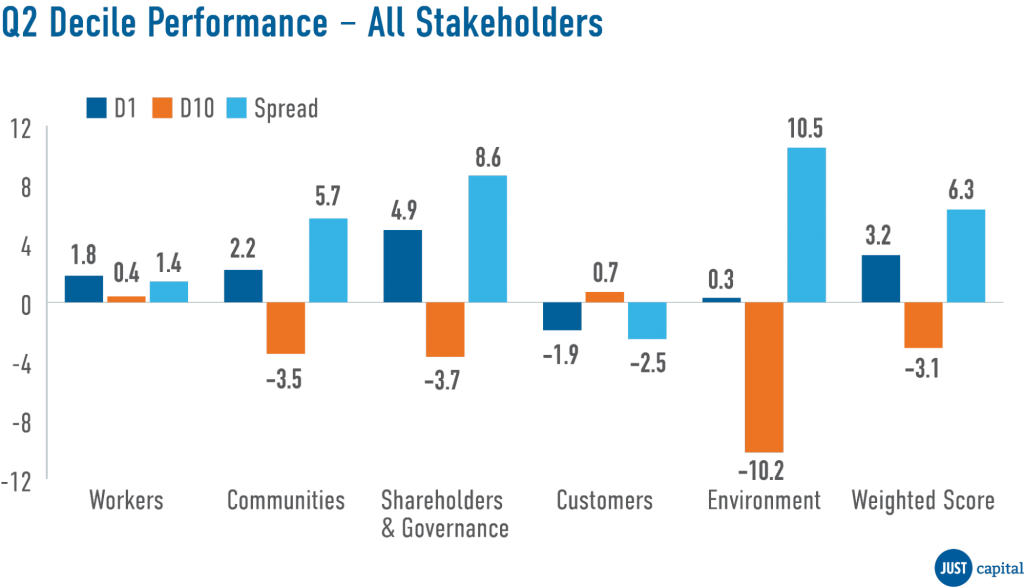
In Q2 2022, Just Capital found that four of the five stakeholders we track delivered positive performance, excluding Customers. The Environment stakeholder delivered the best performance over this period, with a long-short spread of 10.5%. Within the Customers stakeholder, underperformance was driven by both deciles, with the top decile underperforming and bottom decile outperforming.
Just Capital’s Overall Weighted Score takes into account the 20 core Issues identified through our survey research as top priorities for just business – including paying a living wage, creating a diverse, inclusive workplace, and helping combat climate change – across key business stakeholders: Workers, Communities, Shareholders and Governance, Customers, and the Environment. This Overall Weighted Score delivered a spread of 6.3% over the period ending June 30, 2022.
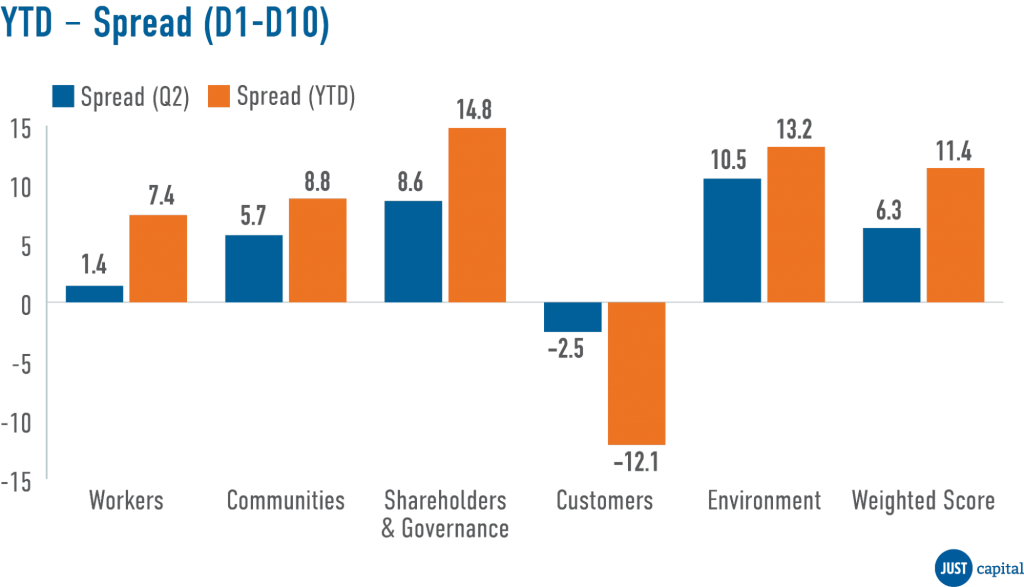
Shown below is the Year-to-Date (YTD) and Q2 performance, which is quantified by the spread between the top and bottom deciles of all the stakeholders and the overall weighted score.
The Workers stakeholder measures a company across five Issues:
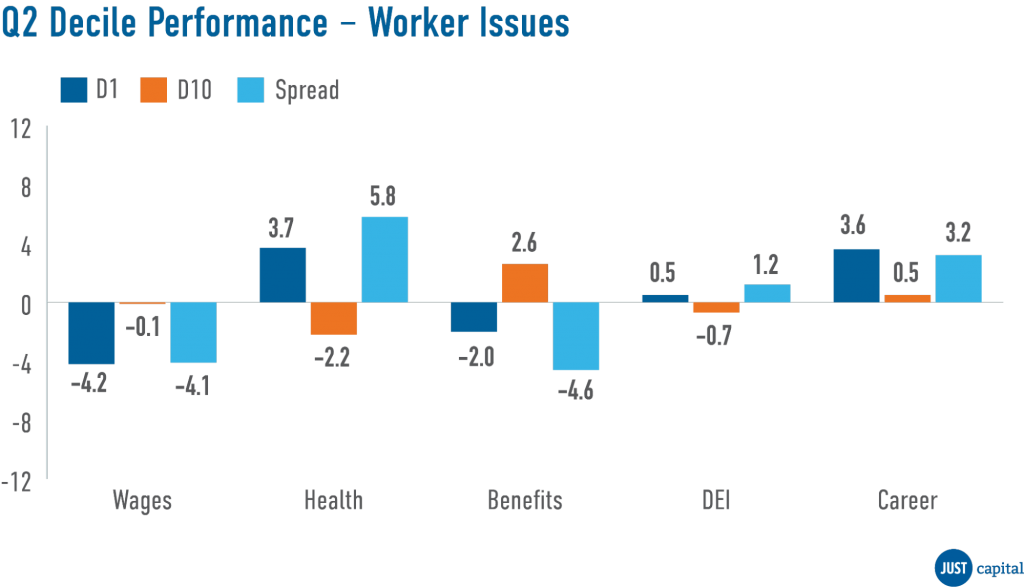
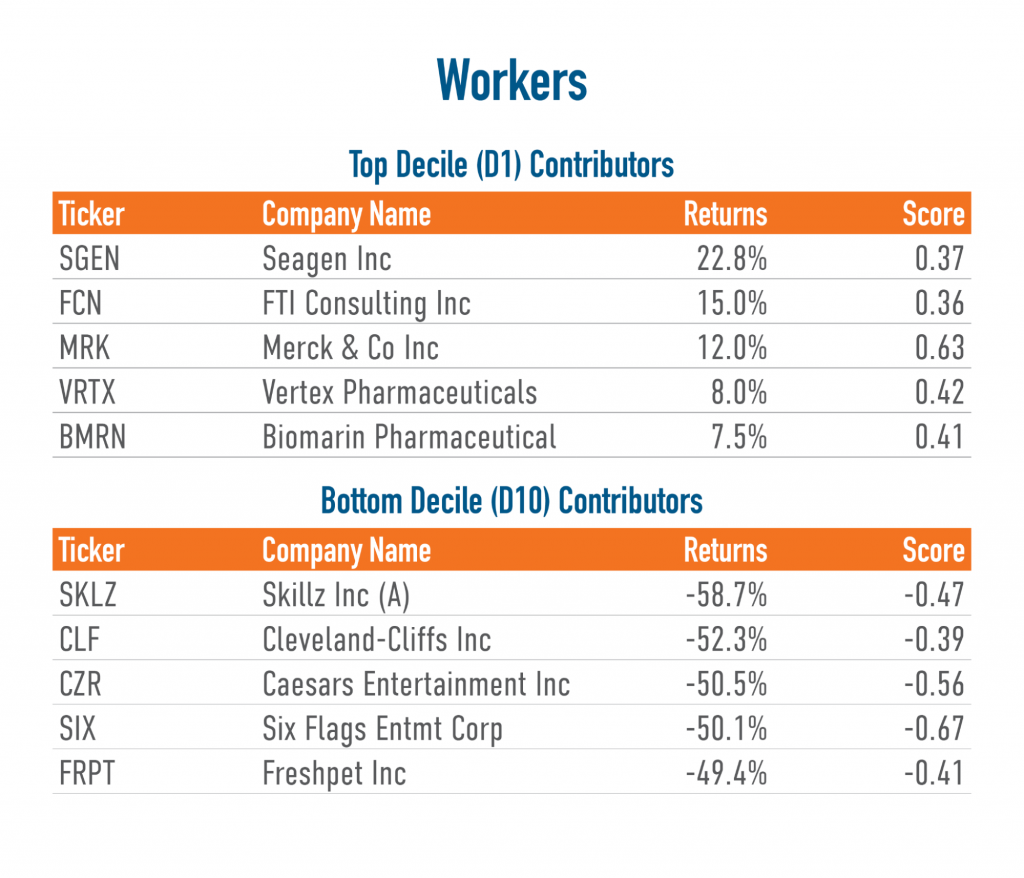
In Q2, we saw three out of five Worker Issues outperform. Underperformance in Benefits was driven by negative performance from both top and bottom decile companies and weak performance in Wages was driven by top decile companies.
Shown below are the top and bottom five contributors to the top decile (D1), the top-ranked companies as measured by their Workers score, and the bottom decile (D10), the lowest-ranked companies as measured by their Worker score.
The Communities stakeholder measures a company across four Issues:
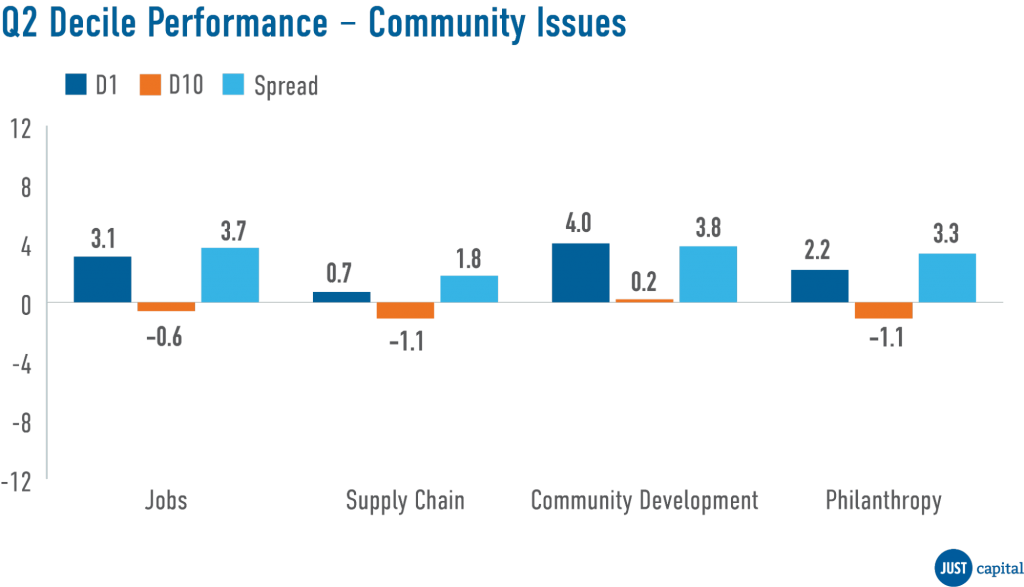
All issues within Communities were positive contributors to the stakeholder’s performance.
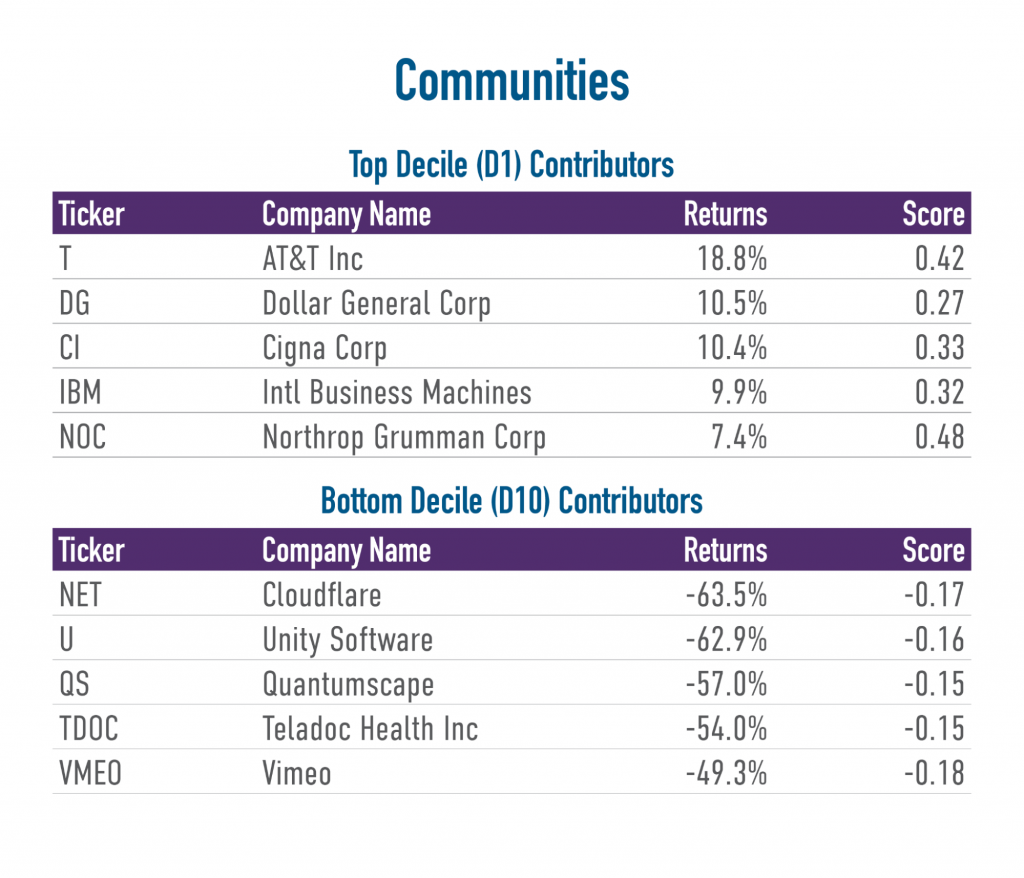
In Q2, we saw Community Development outperform other Issues within Communities. Shown below are the top and bottom five contributors to the top decile (D1), the top-ranked companies as measured by their Communities score, and the bottom decile (D10), the lowest-ranked companies as measured by their Communities score.
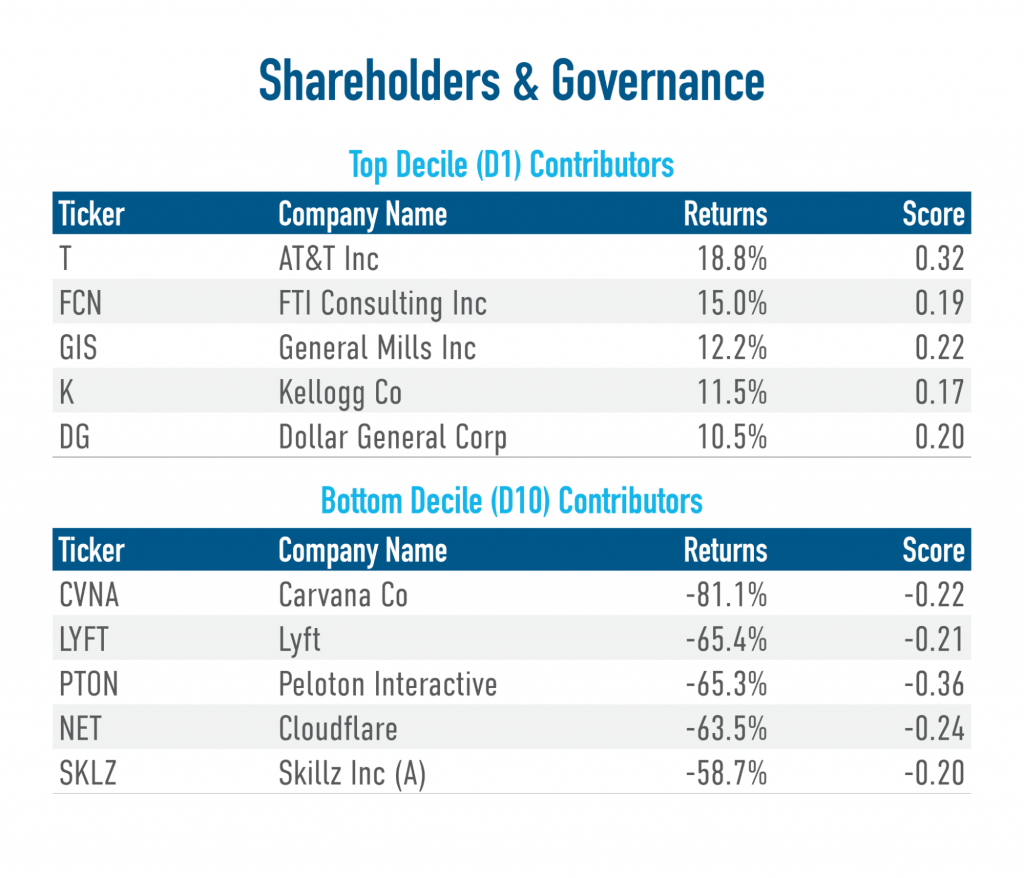
The Shareholders and Governance stakeholder measures a company across three Issues:
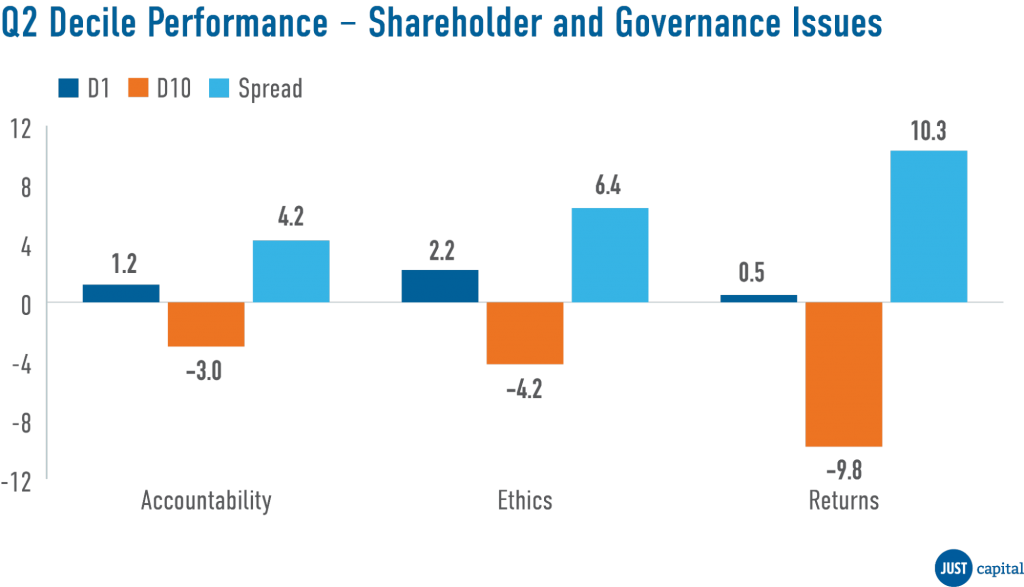
In Q2 we saw the Returns issue outperform the other Shareholder and Governance Issues, with a long-short spread of 10.3%.
Shown below are the top and bottom five contributors to the top decile (D1), the top-ranked companies as measured by their Shareholders and Governance score, and the bottom decile (D10), the lowest-ranked companies as measured by their Shareholders and Governance score.
The Customers stakeholder measures a company across four Issues:
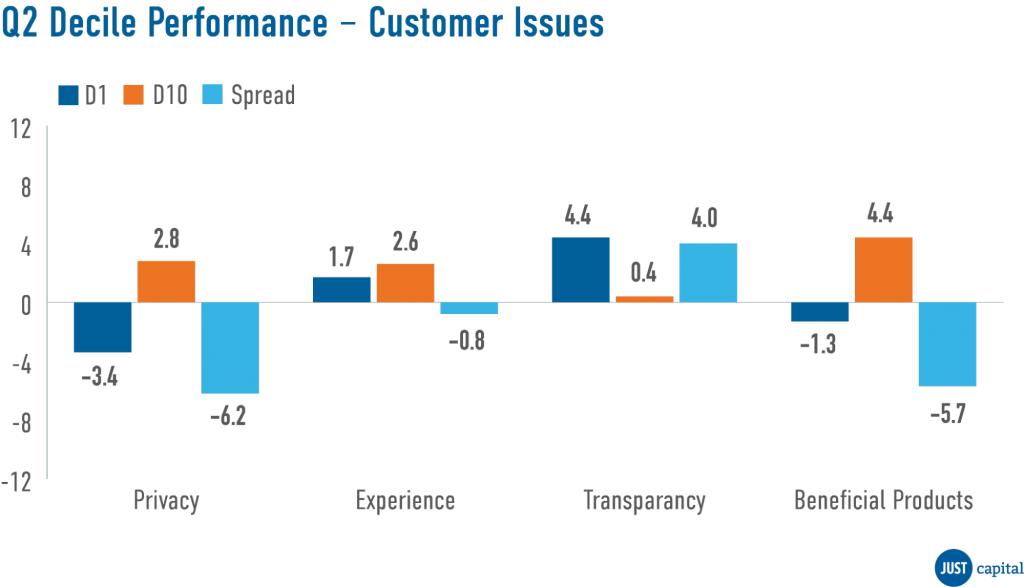
In Q2, we saw the Transparency outperform the other Customer Issues, with a long-short spread of 4%. Beneficial Products, Privacy, and Experience were negative contributors to Customer performance.
Shown below are the top and bottom five contributors to the top decile (D1), the top-ranked companies as measured by their Customer score, and the bottom decile (D10), the lowest-ranked names as measured by Customer score.
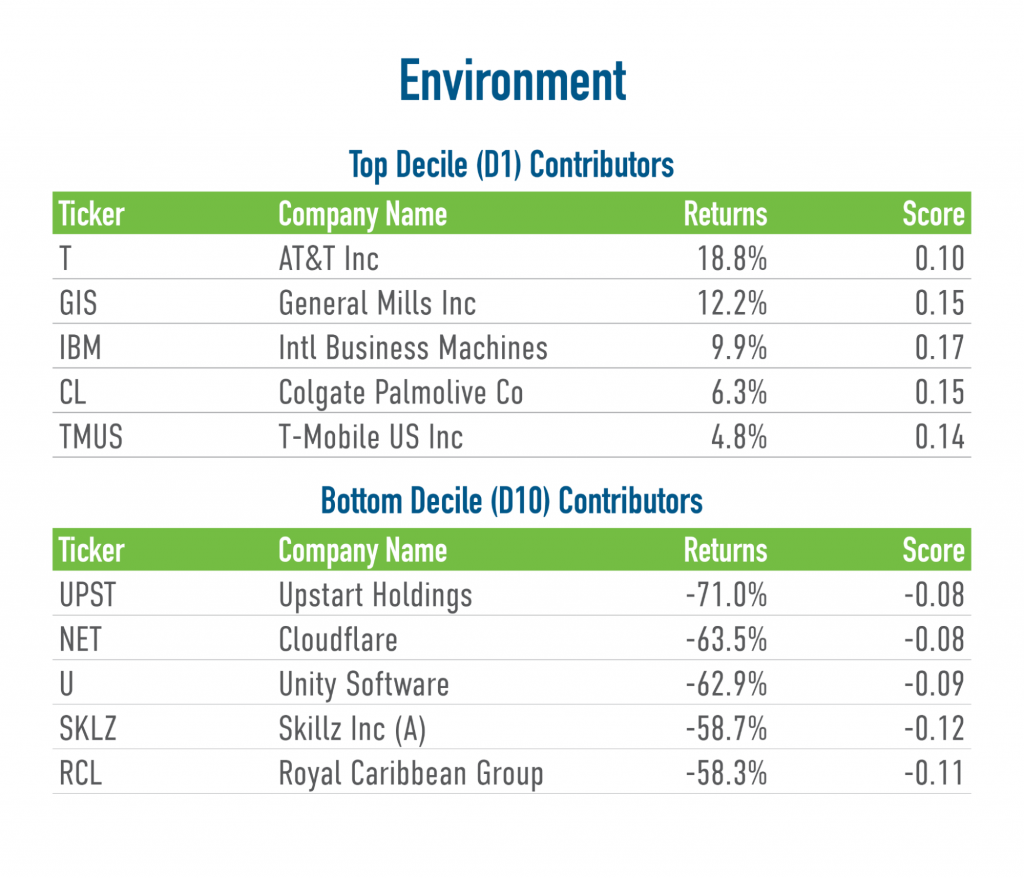
The Environment stakeholder measures a company across four Issues:
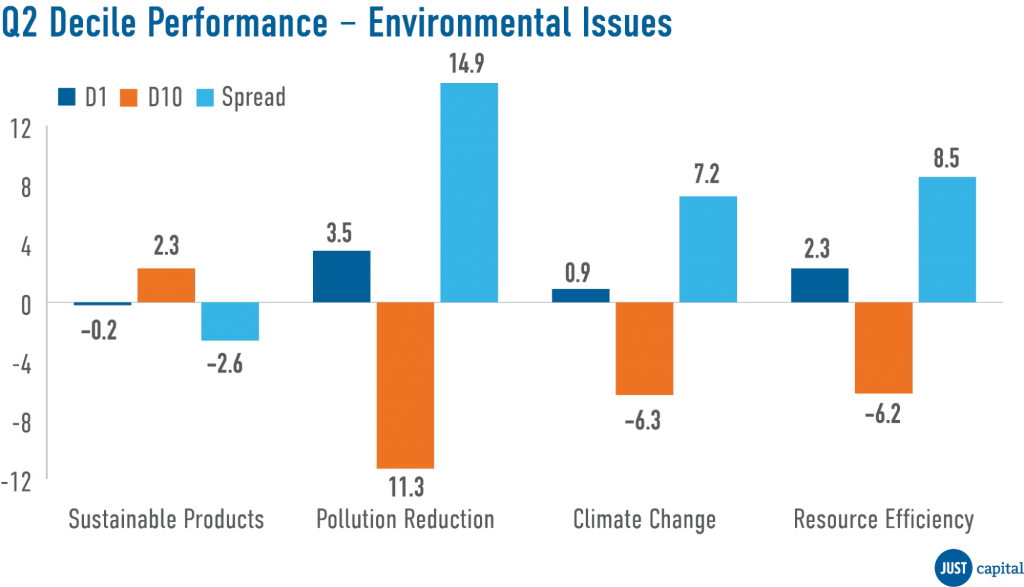
In Q2, we saw Pollution Reduction outperform other Environment Issues. Resource Efficiency and Climate Change were also positive, while Sustainable Products had negative performance.
Shown below are the top and bottom five contributors to the top decile (D1), the top-ranked companies as measured by their Environmental score, and the bottom decile (D10), the lowest-ranked companies as measured by their Environmental score.
We monitor the performance of these stakeholders and Issues on a long-short basis. The long and short portfolios are selected based on the factor scores as the top and bottom deciles within the universe of companies we track in the Russell 1000. Top decile (D1) companies are those that rank highest based on the factor score, and bottom decile (D10) companies are those that rank lowest based on the factor score.
D1 Performance is computed as (Equally weighted average of returns of stocks in D1 bucket) – (Equally weighted average of returns of all stocks within the Universe).
D10 Performance is computed as (Equally weighted average of returns of stocks in D10 bucket) – (Equally weighted average of returns of all stocks within the Universe).
Spread is computed as D1 Performance – D10 Performance.

Investors and regulators are increasingly looking for greater transparency and accountability from corporate America on environmental, social, and governance (ESG) issues. The U.S. Securities and Exchange Commission’s (SEC) recently proposed rules on standardized climate-related disclosures and ESG fund labeling come alongside a record amount of ESG-related shareholder proposals this proxy season. And these are moves that JUST Capital polling shows a majority of the American public across the political spectrum support – as partisan attacks on ESG continue to rise.
Against this backdrop, JUST was thrilled to welcome Cambria Allen-Ratzlaff to our team this week as our new Managing Director and Head of Investor Strategies. Cambria will be leading JUST’s investor stakeholder and financial markets strategy, cultivating industry partnerships and initiatives with key market actors in the asset owner, asset manager, and sustainable and impact investing communities. She comes to JUST from the $63 billion UAW Retiree Medical Benefits Trust, where she served as Corporate Governance Director and led the Trust’s global liquid markets portfolio corporate governance program and global proxy voting program.
Cambria has also co-chaired the Human Capital Management Coalition (HCMC) since 2013. The group of 36 institutional investors with over $8 trillion in assets under management works to elevate human capital management as a key driver of long-term shareholder value – advancing human capital on the SEC’s agenda and providing reporting guidance for companies among other efforts. Through this role, Cambria got to know JUST and followed our work from our very first poll of the American public to our recent analyses of human capital metrics disclosure.
We sat down with Cambria to hear her perspective on the growing focus on human capital in a shifting labor market, the future of ESG investing, and why it’s “becoming increasingly irresponsible” for investors to ignore ESG factors.
One of the topics we’ve been looking at closely is the evolving dynamic between labor and management over the course of the pandemic. Given your career, how have you been seeing it?
I’ll start with the investor perspective. That interest had already been growing among shareholders, but investors hadn’t really been vocal about how they were increasingly viewing human capital as a source of value creation in the firm versus merely a cost to be minimized. Unfortunately, we were seeing this posture toward the workforce play out in some of the companies we owned.
To us, this disconnect didn’t make sense, as the sources of value in companies – that is, the ways public companies create value for investors – has shifted tremendously over the past 50 years from property, plant, and equipment (a company’s physical assets) to intangible assets derived largely from human capital, which we define as the knowledge, motivation, skills, and experience of a company’s workforce. In 1975, intangibles accounted for less than 20% of the total market capitalization of the S&P 500. In 2005, seven years before we launched the Human Capital Management Coalition, we were already at 80%. Fast forward to 2020 – already, before everything shut down due to the pandemic, we’re now at 90%. And if you think of many of the types of companies that dominate the list of the largest companies in the U.S., you’re looking at companies where nearly the entire value of the company comes from intangible assets. So if human capital constitutes most or all of many of our largest investments, and we rely on the returns from those investments to pay workers’ pensions and healthcare, the relative success or failure of a company to manage its workforce well is going to matter to us. A lot.
Unfortunately, if investors aren’t vocal about what they want and what they expect from companies, it’s just not going to happen. In the U.S. markets, shareholders still reign supreme at the firm, and if investors and the market infrastructure around them are saying, “Hey, we want you to focus on quarterly returns,” then that’s what you’re going to get. You don’t study what’s not on the test, right? And the investor voice was the one that was missing here.
At the same time, we realized that the lack of information coming out of companies about how they were managing their people meant that we needed to better understand what was happening at our portfolio companies. How is management actually managing their talent?
So we took the time, and in 2017 filed the petition for rulemaking with the SEC urging higher-quality information on human capital metrics, policies, and processes as a way to jump-start the conversation on a regulatory level, as well as publicly state the investor case for why good human capital management is critical to investors and the overall economy. Ultimately, those efforts, along with those of other investors, members of Congress, the SEC’s own Investor Advisory Committee, and numerous other stakeholder groups, led to broader engagement on human capital. Really, we were educating the market and asking some pretty basic, commonsense questions.
And then COVID hits. Some folks – those who have jobs that can be done remotely, and that are traditionally higher-paid – are home and, faced with this very real and visceral reality of a pandemic, are thinking about whether their current work is truly working out for them. You have people working in health care, many of whom had already faced staffing reductions that were increasing workloads, increasing health and safety risks and stagnant wages, and now they’re basically our front line. We don’t make this through it without them. And then you have the other “essential workers” – the people who have been working in low-wage, low-agency jobs – but jobs that provide us with food and critical supplies. And many of them are working with limited or no access to PPE. And finally, you have folks who are out of work altogether, many of whom were also working low-wage, low-agency jobs. So COVID has created this massive shock to the economy and our entire social fabric, and now we’re beginning to expect more out of our employers.
I don’t have data for this – I’d love for JUST to do this – but my guess is that companies that always treated their employees well have performed better during the pandemic on a number of workforce factors like retention – which translates into financial performance – than companies that were “low-road” employers. Either companies were prepared in that way or they weren’t. I’d imagine a lot of this has been a huge driver of the so-called “Great Resignation.”
Where do you see ESG investing headed? Do you think ESG is going to remain a niche investing strategy or become the norm going forward?
We’re certainly at an inflection point, and I think what we’re seeing is just a lot of frustration all-around. We need to make sure that investors are front and center and talking about this, and that incorporating information that may look novel to some traditionalists into the investment process is just a normal part of the process. They’re probably doing it already, and there’s really nothing special about it. In fact, it’s increasingly irresponsible to ignore these factors.
If you’re a bond analyst, for example, and you’re looking at utilities and not looking at environmental factors that could impact the performance of that utility in the context of risk, you’re probably not a great bond analyst. If you’re an asset manager focusing on oil and gas companies and you decide that you’re not going to incorporate climate risk analysis in, say, trying to understand whether the valuation of long-lived assets is reasonable or not in deciding between allocating capital to OilCo A or OilCo B, I don’t know if I’d want to leave my money with you. Probably not.
When folks typically use the term “ESG,” I think they’re really thinking more about the “E” and the “S,” and the conversation seems to have really forced a broader group of people to really focus more on the externalities – really, how does a company behave in the business environment in the face of all of these risks (and opportunities). It’s data that should go into analysis. It’s like, “OK, companies, are you going to have stranded assets in the future? The asset you say is going to be worth something in 40 years, if it’s underwater in 10 because of increased flooding, then it’s not worth anything to us.” We need that information to be able to make decisions. When we all took Econ 101, what was the textbook example of an externality? Pollution. Why? Because pollution creates costs that are not always borne by the producer, and there can be major financial risks associated with this. So what’s the issue?
I think that ultimately that perspective will prevail. Will people keep using the term ESG? I don’t know. You can argue that some people don’t like “sustainable investing,” some do, and some people don’t like “responsible investing,” some do. Perhaps we need a better and shared sense of what ESG means.
The world is not the same as it was 50 years ago. The sources of value are not the same. The risk profile is completely different. Technology was not as advanced, and the internet wasn’t a thing. So why would we cling to the past when the whole point of investing is to make informed decisions about what we expect will happen in the future?
What role would you like JUST to play during this inflection point?
One thing that I love about JUST is really leaning in on the workforce data and having a better understanding of what companies can be doing to create value for shareholders through investing in their workforce. It’s also being able to operationalize a lot of that data JUST is collecting and making sure that it is matched with where the demand is from the investor/owner perspective. That’s one of the main reasons I found JUST so attractive, and I feel coming from an asset owner background I’m bringing in that perspective.
I’m thinking about ways that JUST can really be a leader among asset owner and asset manager communities, and continue to raise JUST’s profile and just educate a broader group of investors and stakeholders about who we are and what we bring to the table.
Report by Director of Quantitative Research & Analytics Mona Patni.
In quant investing, factors form the basis of performance. Here, we evaluate the stakeholder and issue scores that JUST Capital computes for Russell 1000 companies as factors and see if the signal based on the score can translate into alpha over the period being considered. We use the scores to form D1 (best ranked companies) and D10 (worst ranked companies) portfolios and see if these signals are useful in separating one group of stocks from another by sharing the quarterly performance of the portfolios.
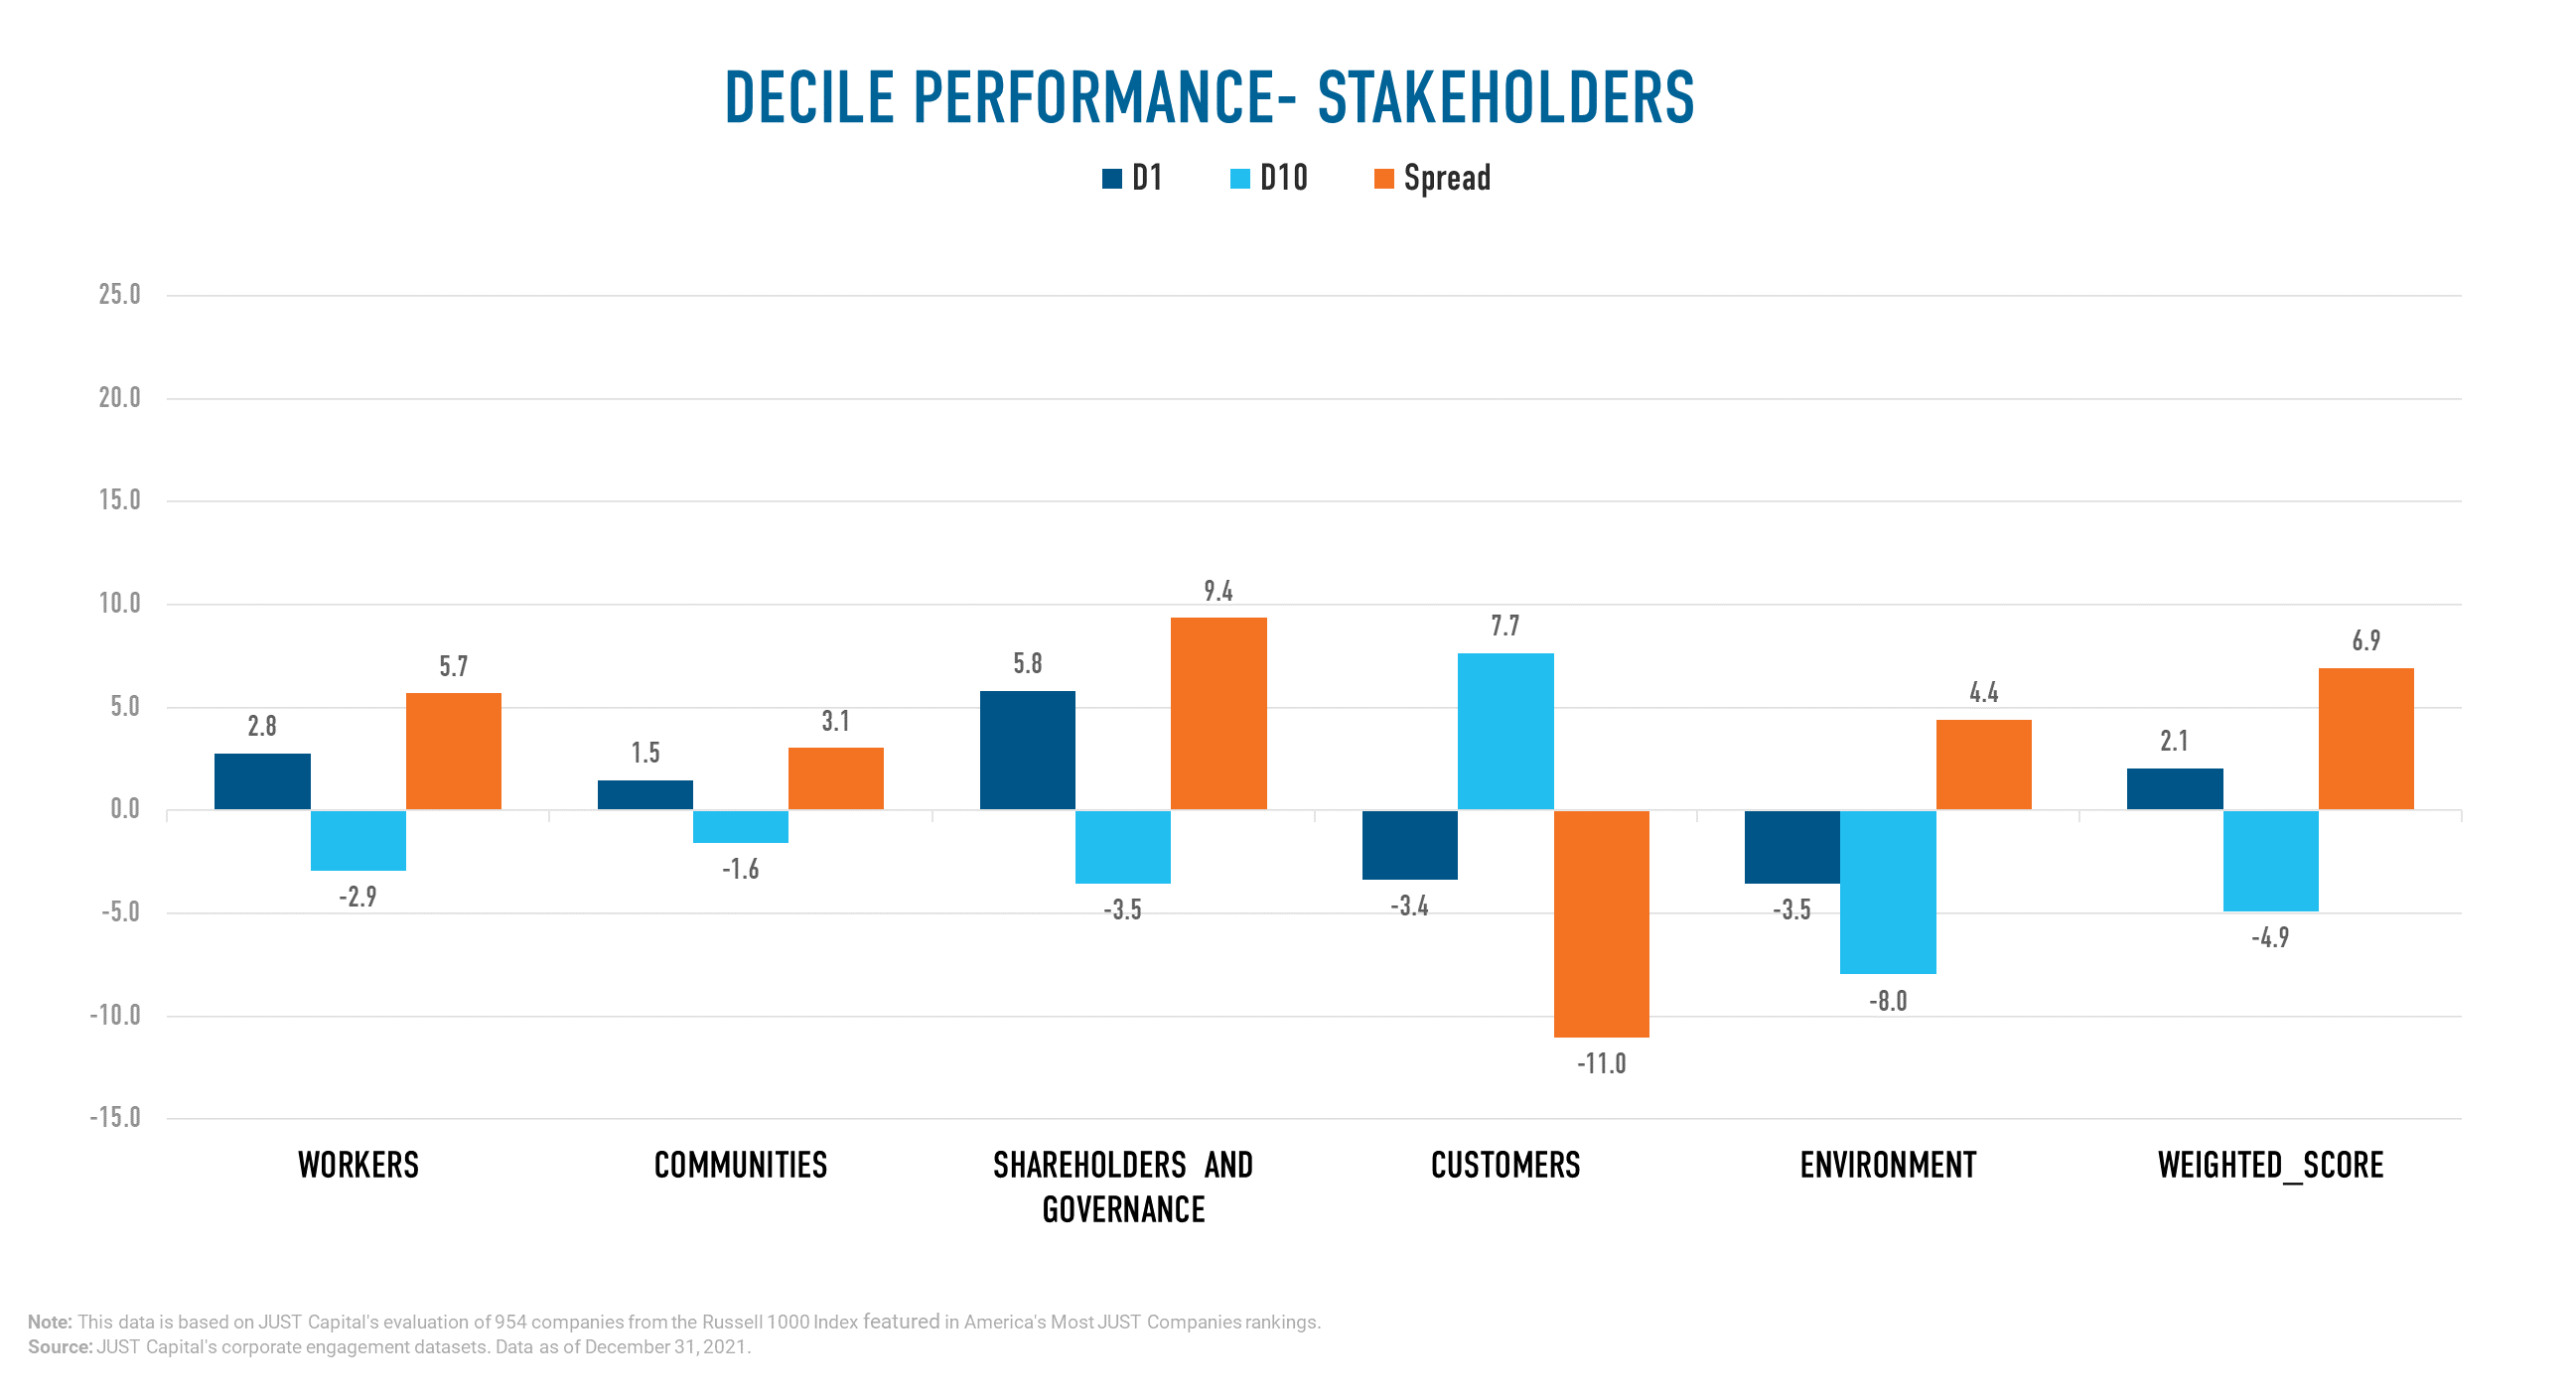
In Q1 2022 JUST Capital found that four of the five stakeholders we track delivered positive performance, excluding Customers. The Shareholders and Governance stakeholder delivered the best performance over this period with a long-short spread of 9.36%. Within the Customers stakeholder, underperformance was driven by both deciles, with the top decile underperforming and bottom decile outperforming.
JUST Capital’s Overall Weighted Score takes into account the 20 core Issues determined through our survey research – including paying a living wage, creating a diverse, inclusive workplace, and helping combat climate change – across key business stakeholders: Workers, Communities, Shareholders and Governance, Customers, and Environment. This Overall Weighted Score had the second highest long-short spread over the period ending March 31, 2022.
The Workers stakeholder measures a company across five Issues:
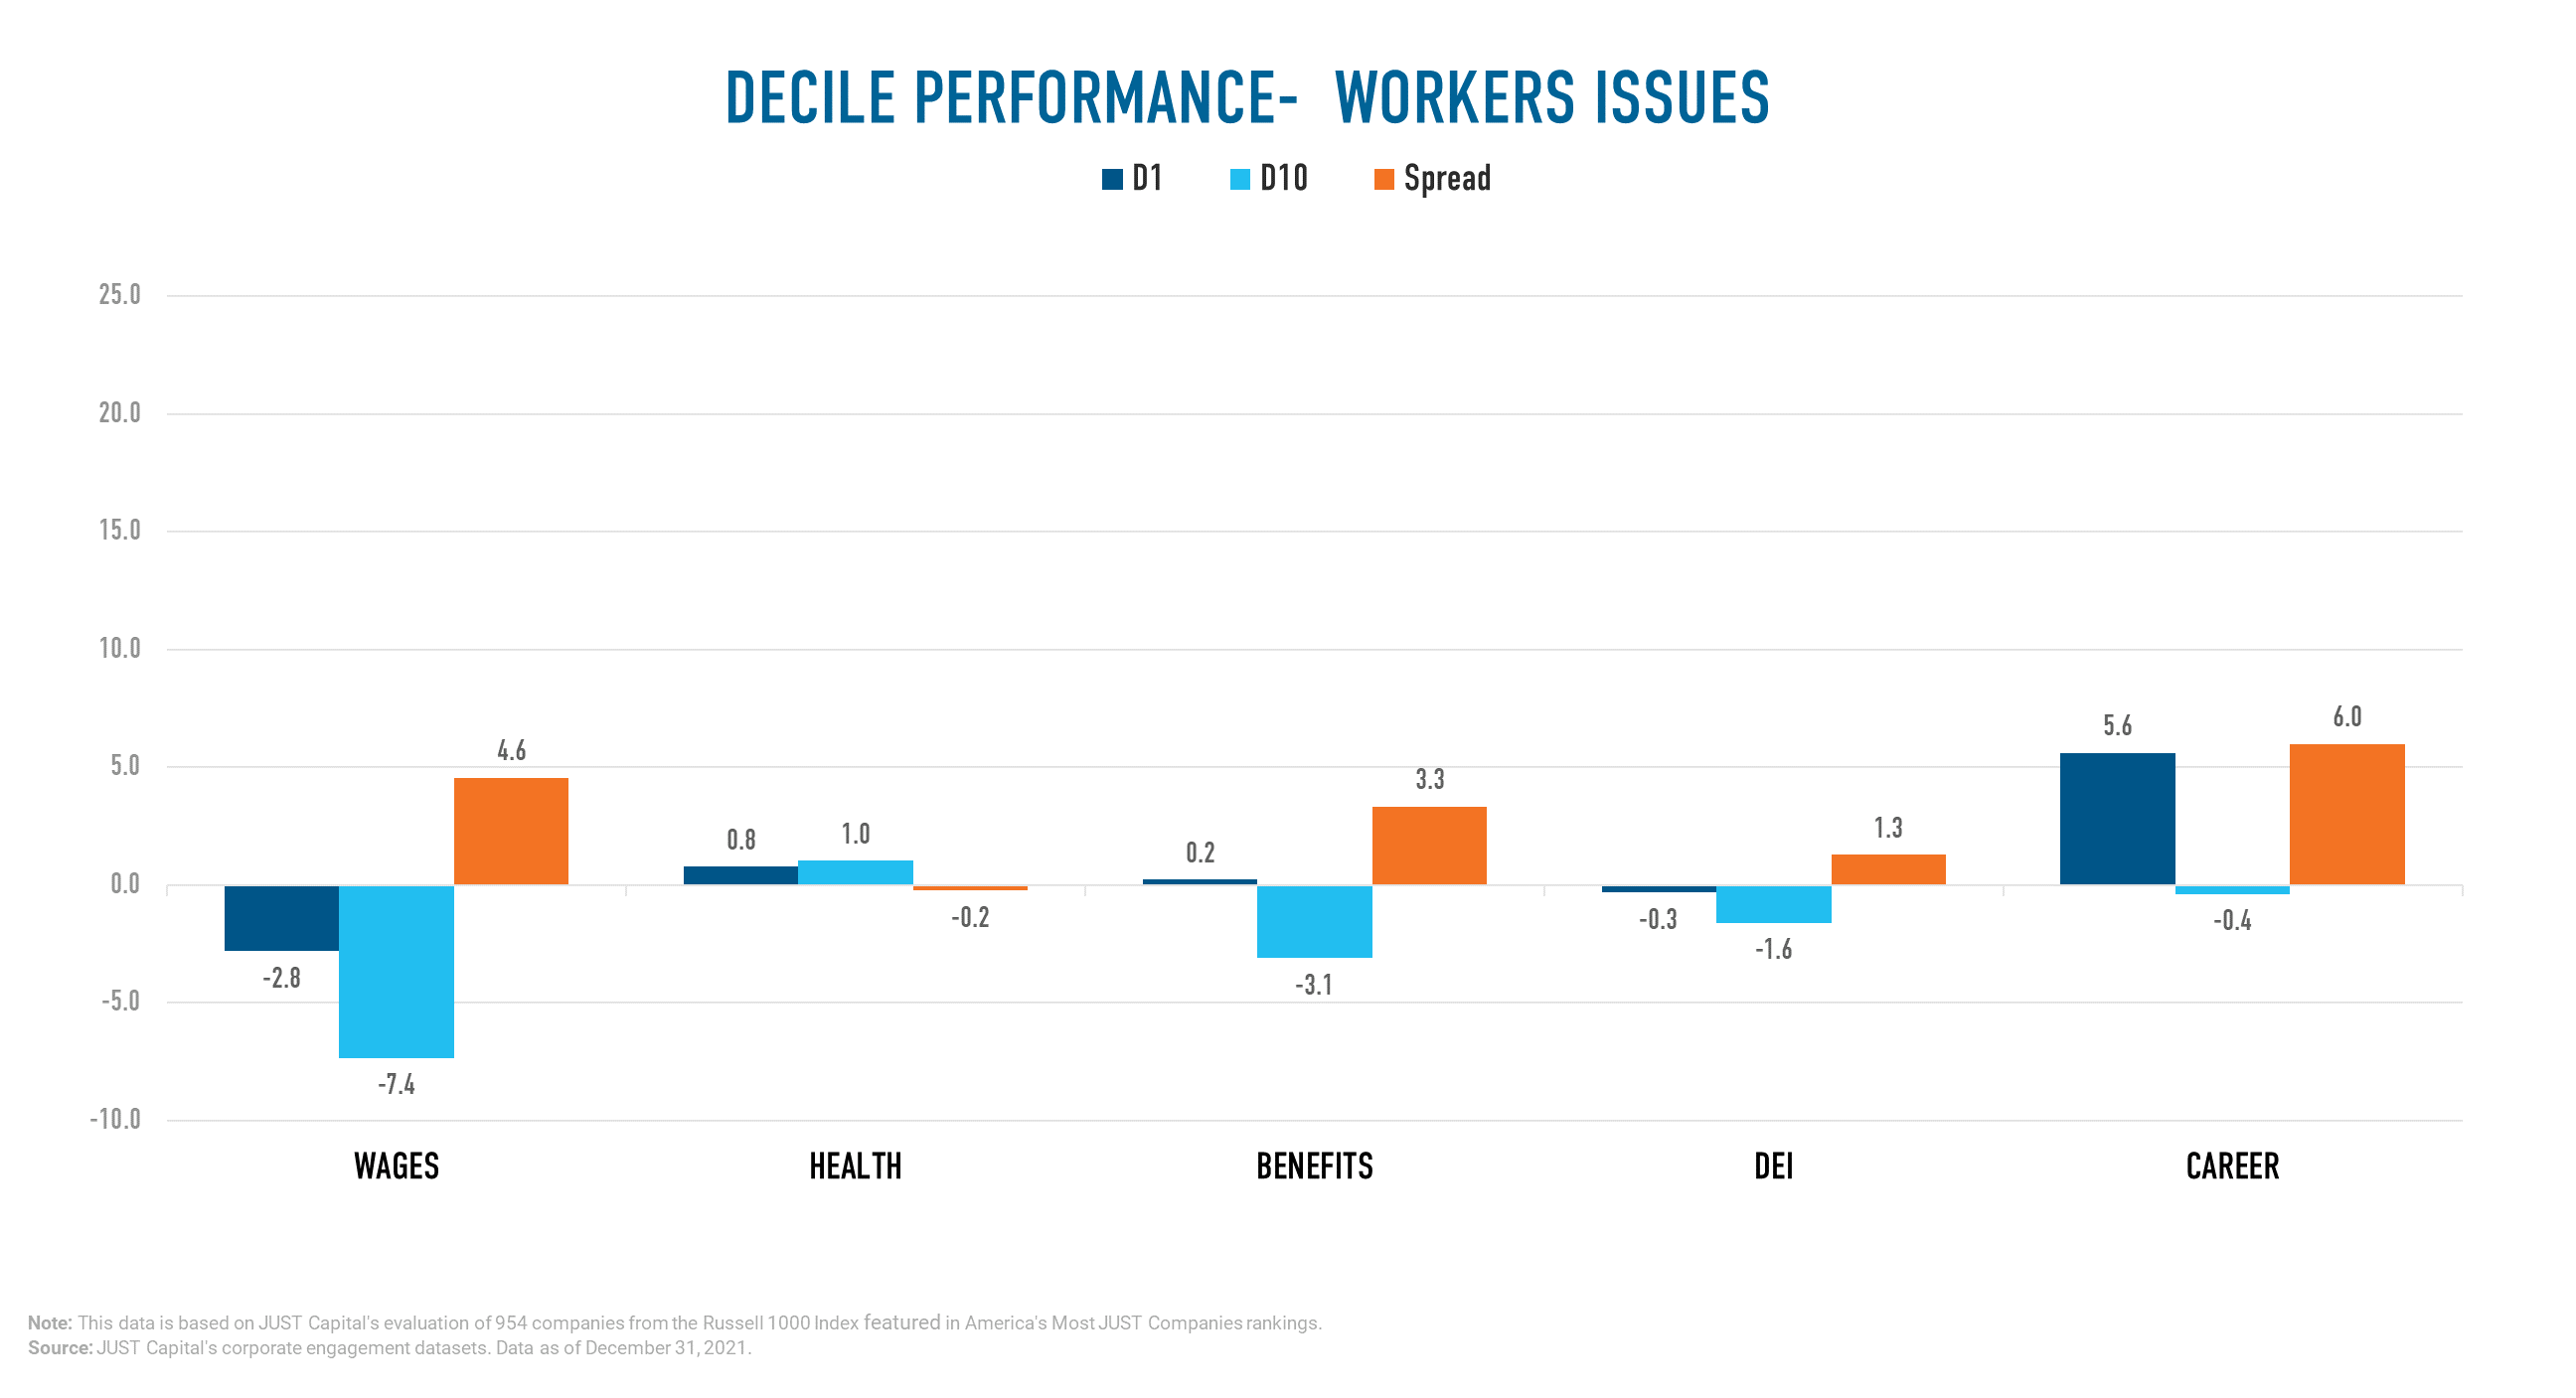
Year to date (YTD), we saw every Worker Issue besides Health outperform. Underperformance in Health was driven by negative performance from the bottom decile companies.
Shown below are the both top and bottom five contributors to the top decile (D1), the best-ranked companies as measured by their Workers score, and the bottom decile (D10), the worst-ranked companies as measured by their Worker score.
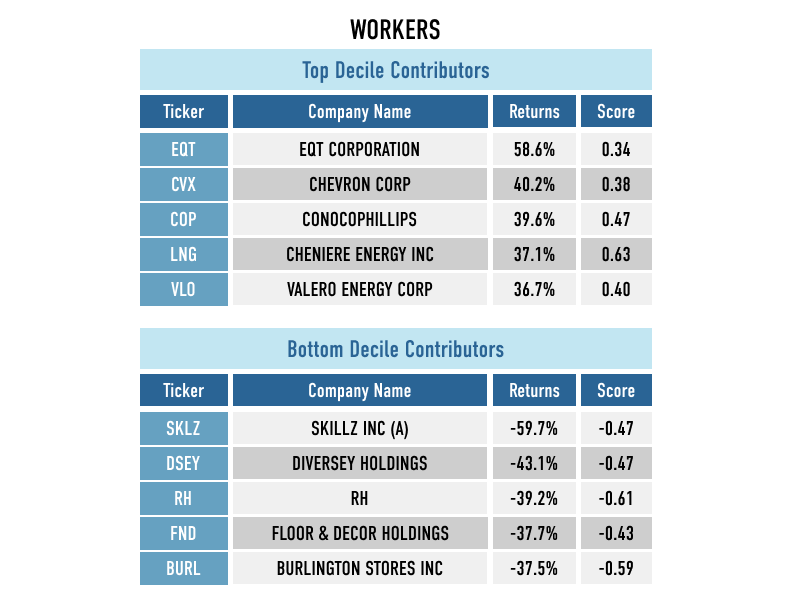
Interestingly, four out of top five contributors to D1 worker performance were all in the energy sector. We have seen energy names do well YTD, driven by improving demand and the Russia-Ukraine war’s curtailing supply and drawdown in inventories.
Among the top detractors, the mobile gaming platform Skillz was the biggest negative contributor.
The Communities stakeholder measures a company across four Issues:
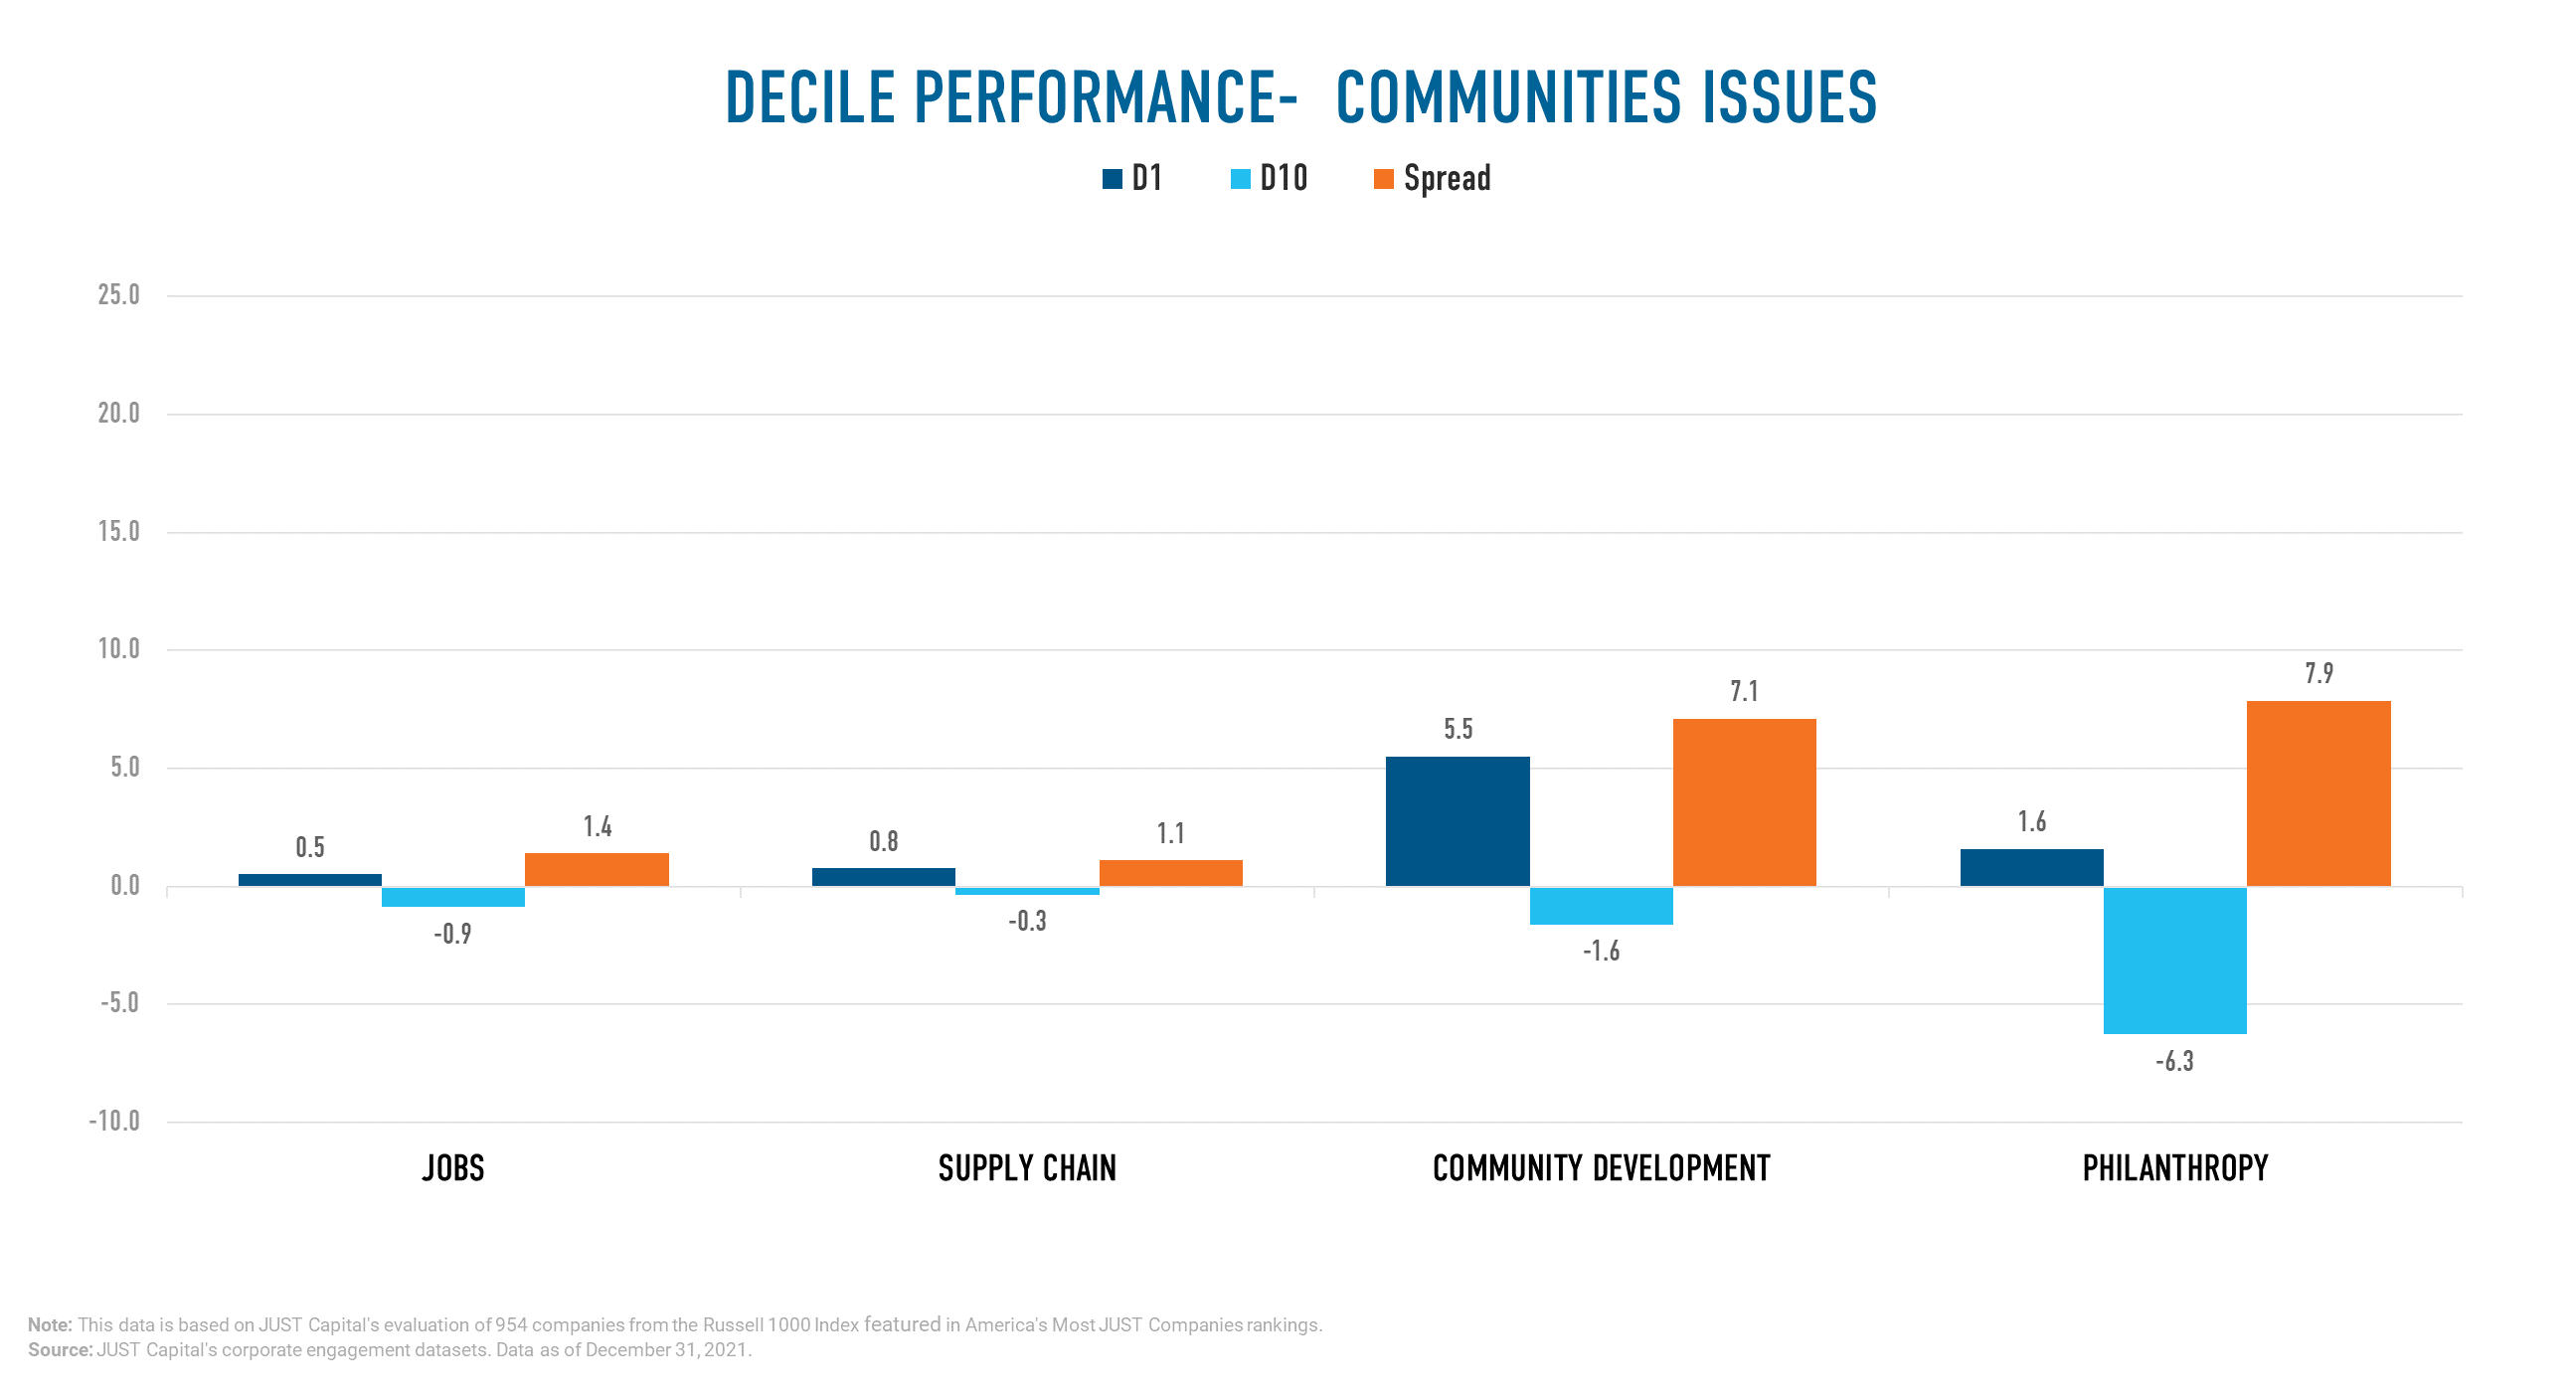
All issues within Communities were positive contributors to the stakeholder’s performance.
YTD we saw Philanthropy outperform other Issues within Communities. Shown below are the both top and bottom five contributors to the top decile (D1), the best-ranked companies as measured by their Communities score, and the bottom decile (D10), the worst-ranked companies as measured by their Communities score.
The Shareholders and Governance stakeholder measures a company across three Issues:
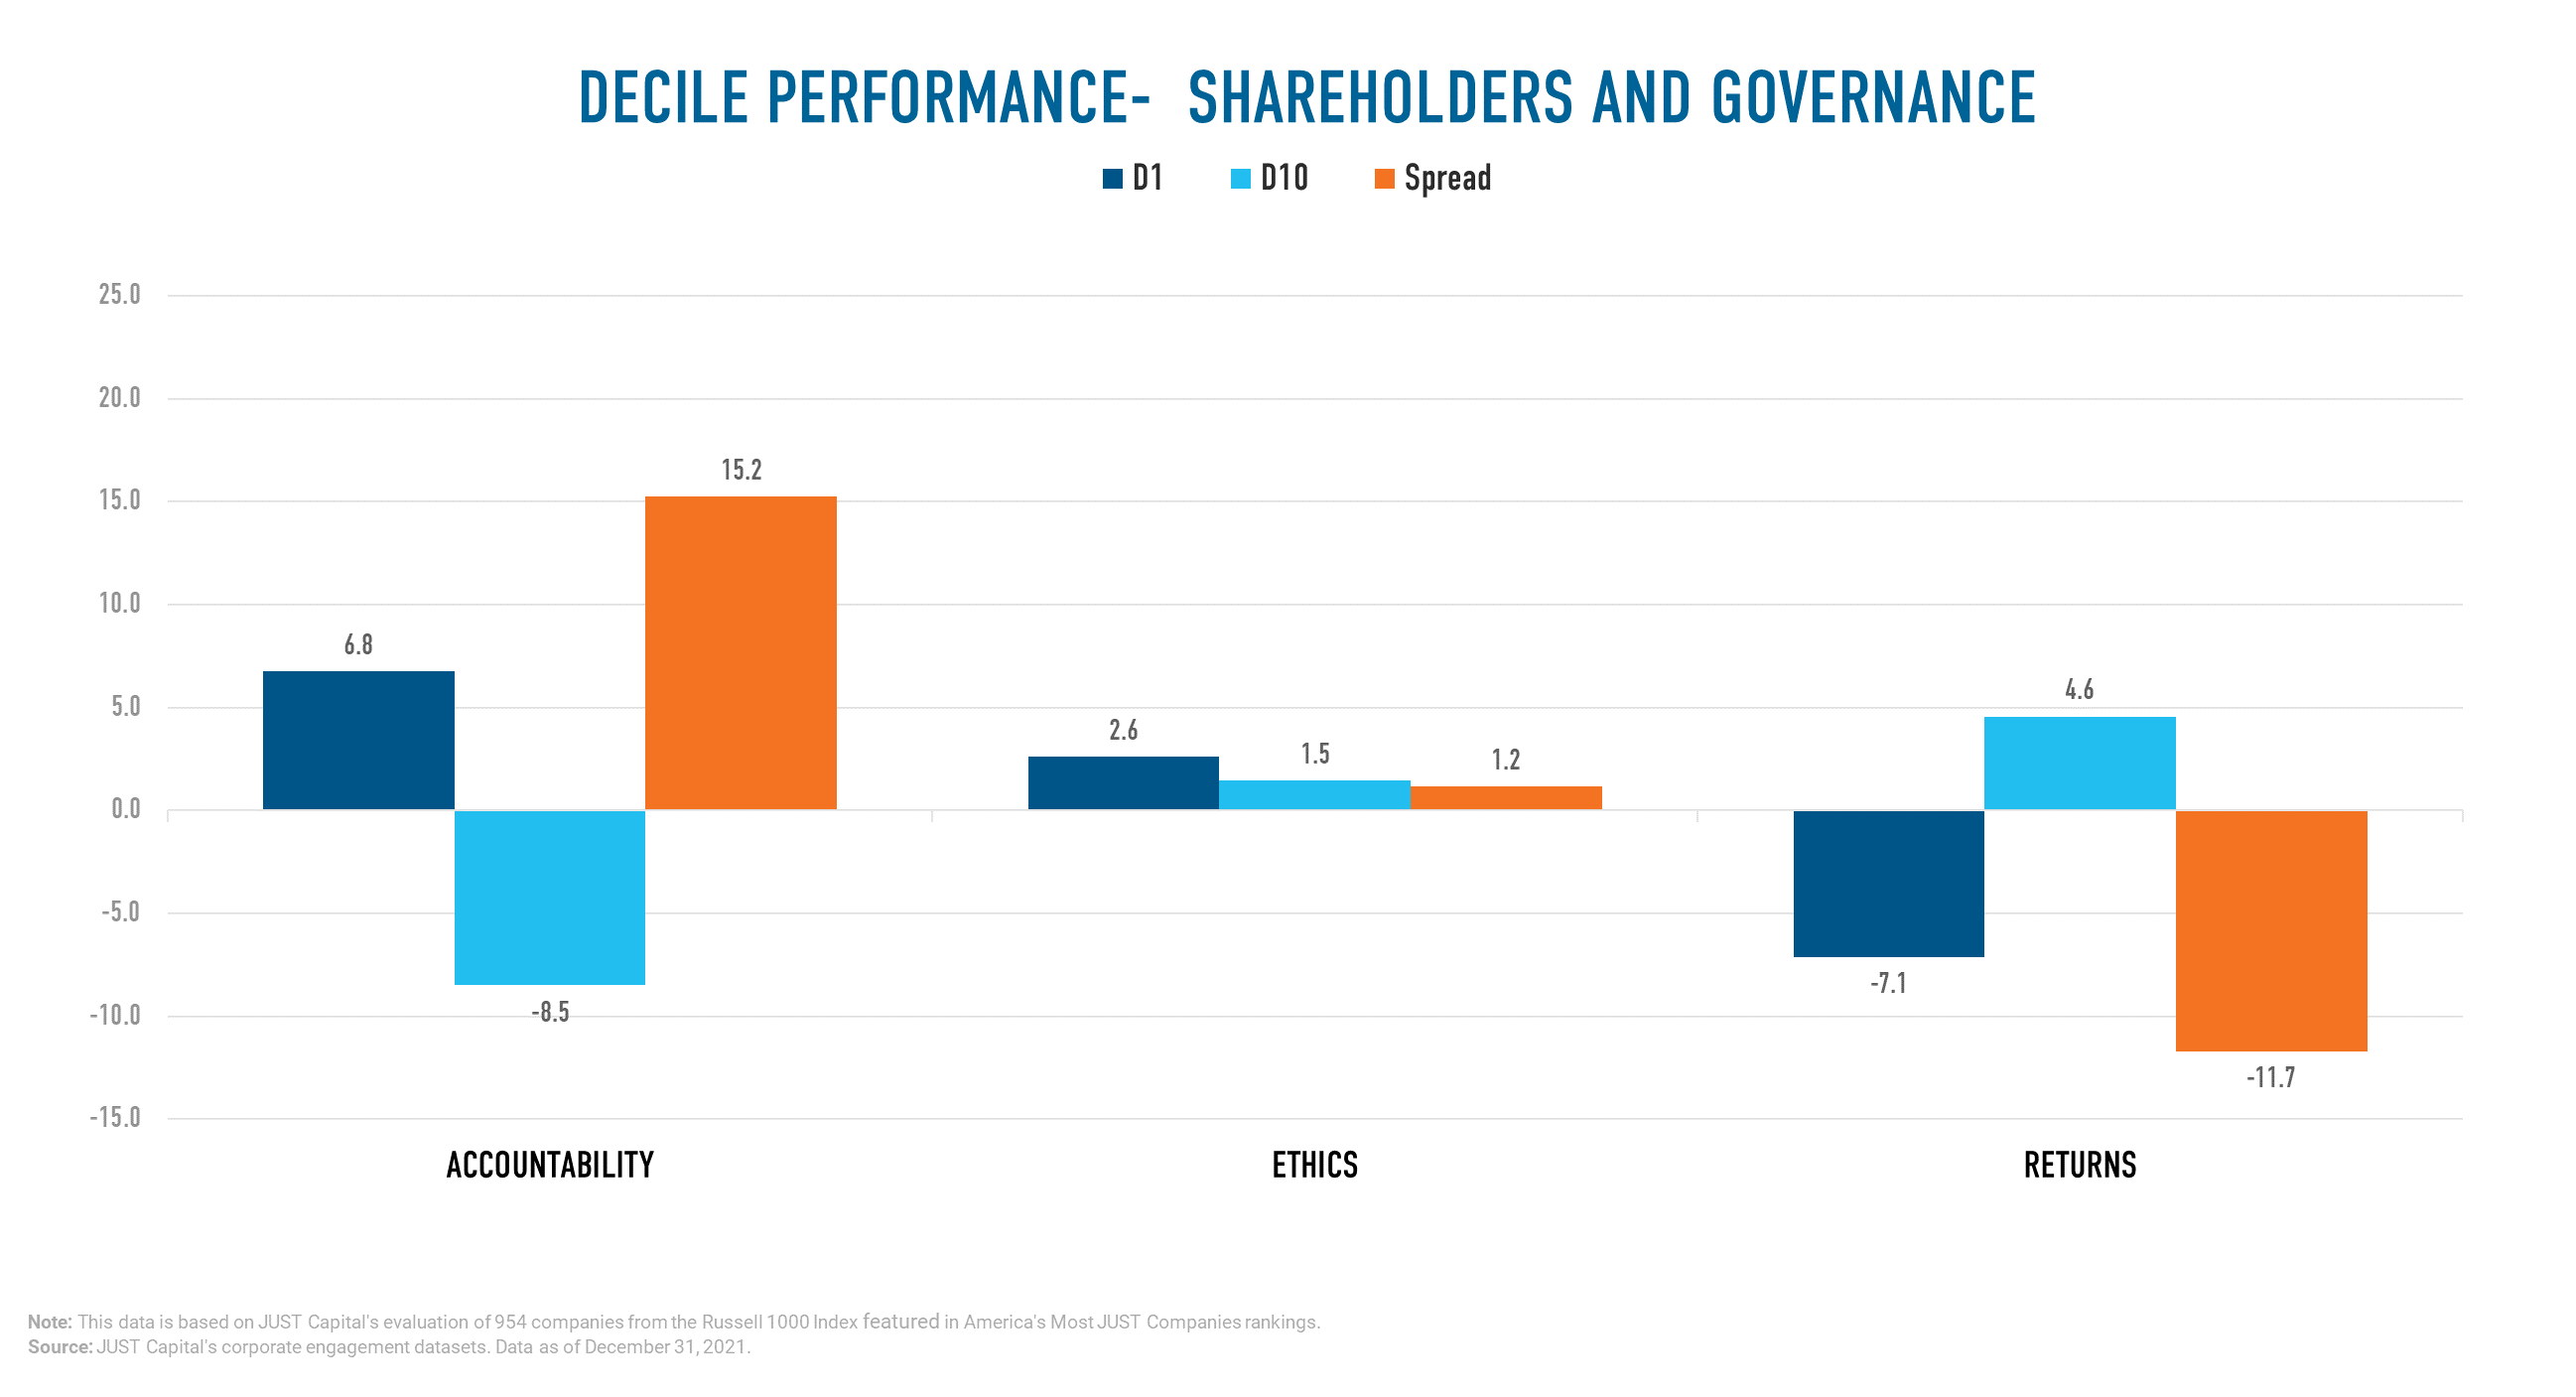
YTD we saw Accountability outperform the other Shareholder and Governance Issues, with a long-short spread of 15.24%. Returns was a negative contributor to performance, and Ethics exhibited close to neutral performance.
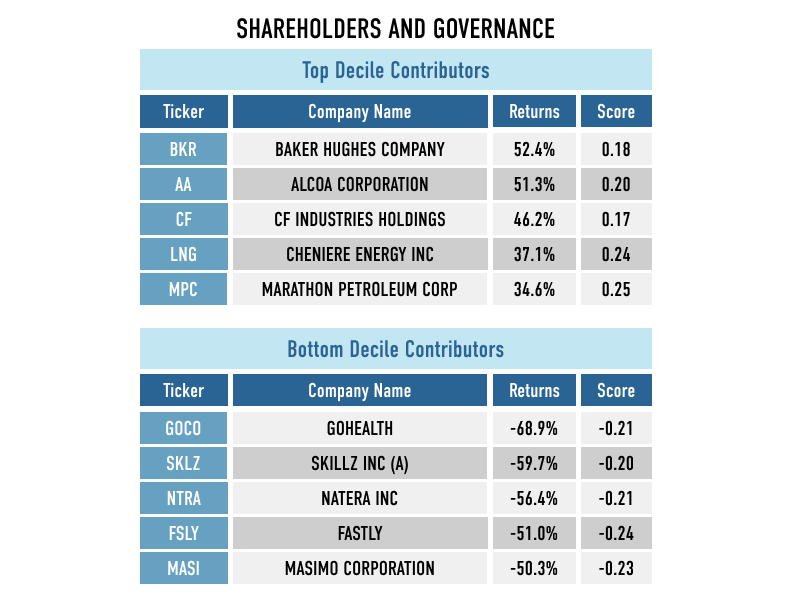
Shown below are the both top and bottom five contributors to the top decile (D1), the best-ranked companies as measured by their Shareholders and Governance score, and the bottom decile (D10), the worst-ranked companies as measured by their Shareholders and Governance score.
The Customers stakeholder measures a company across four Issues:
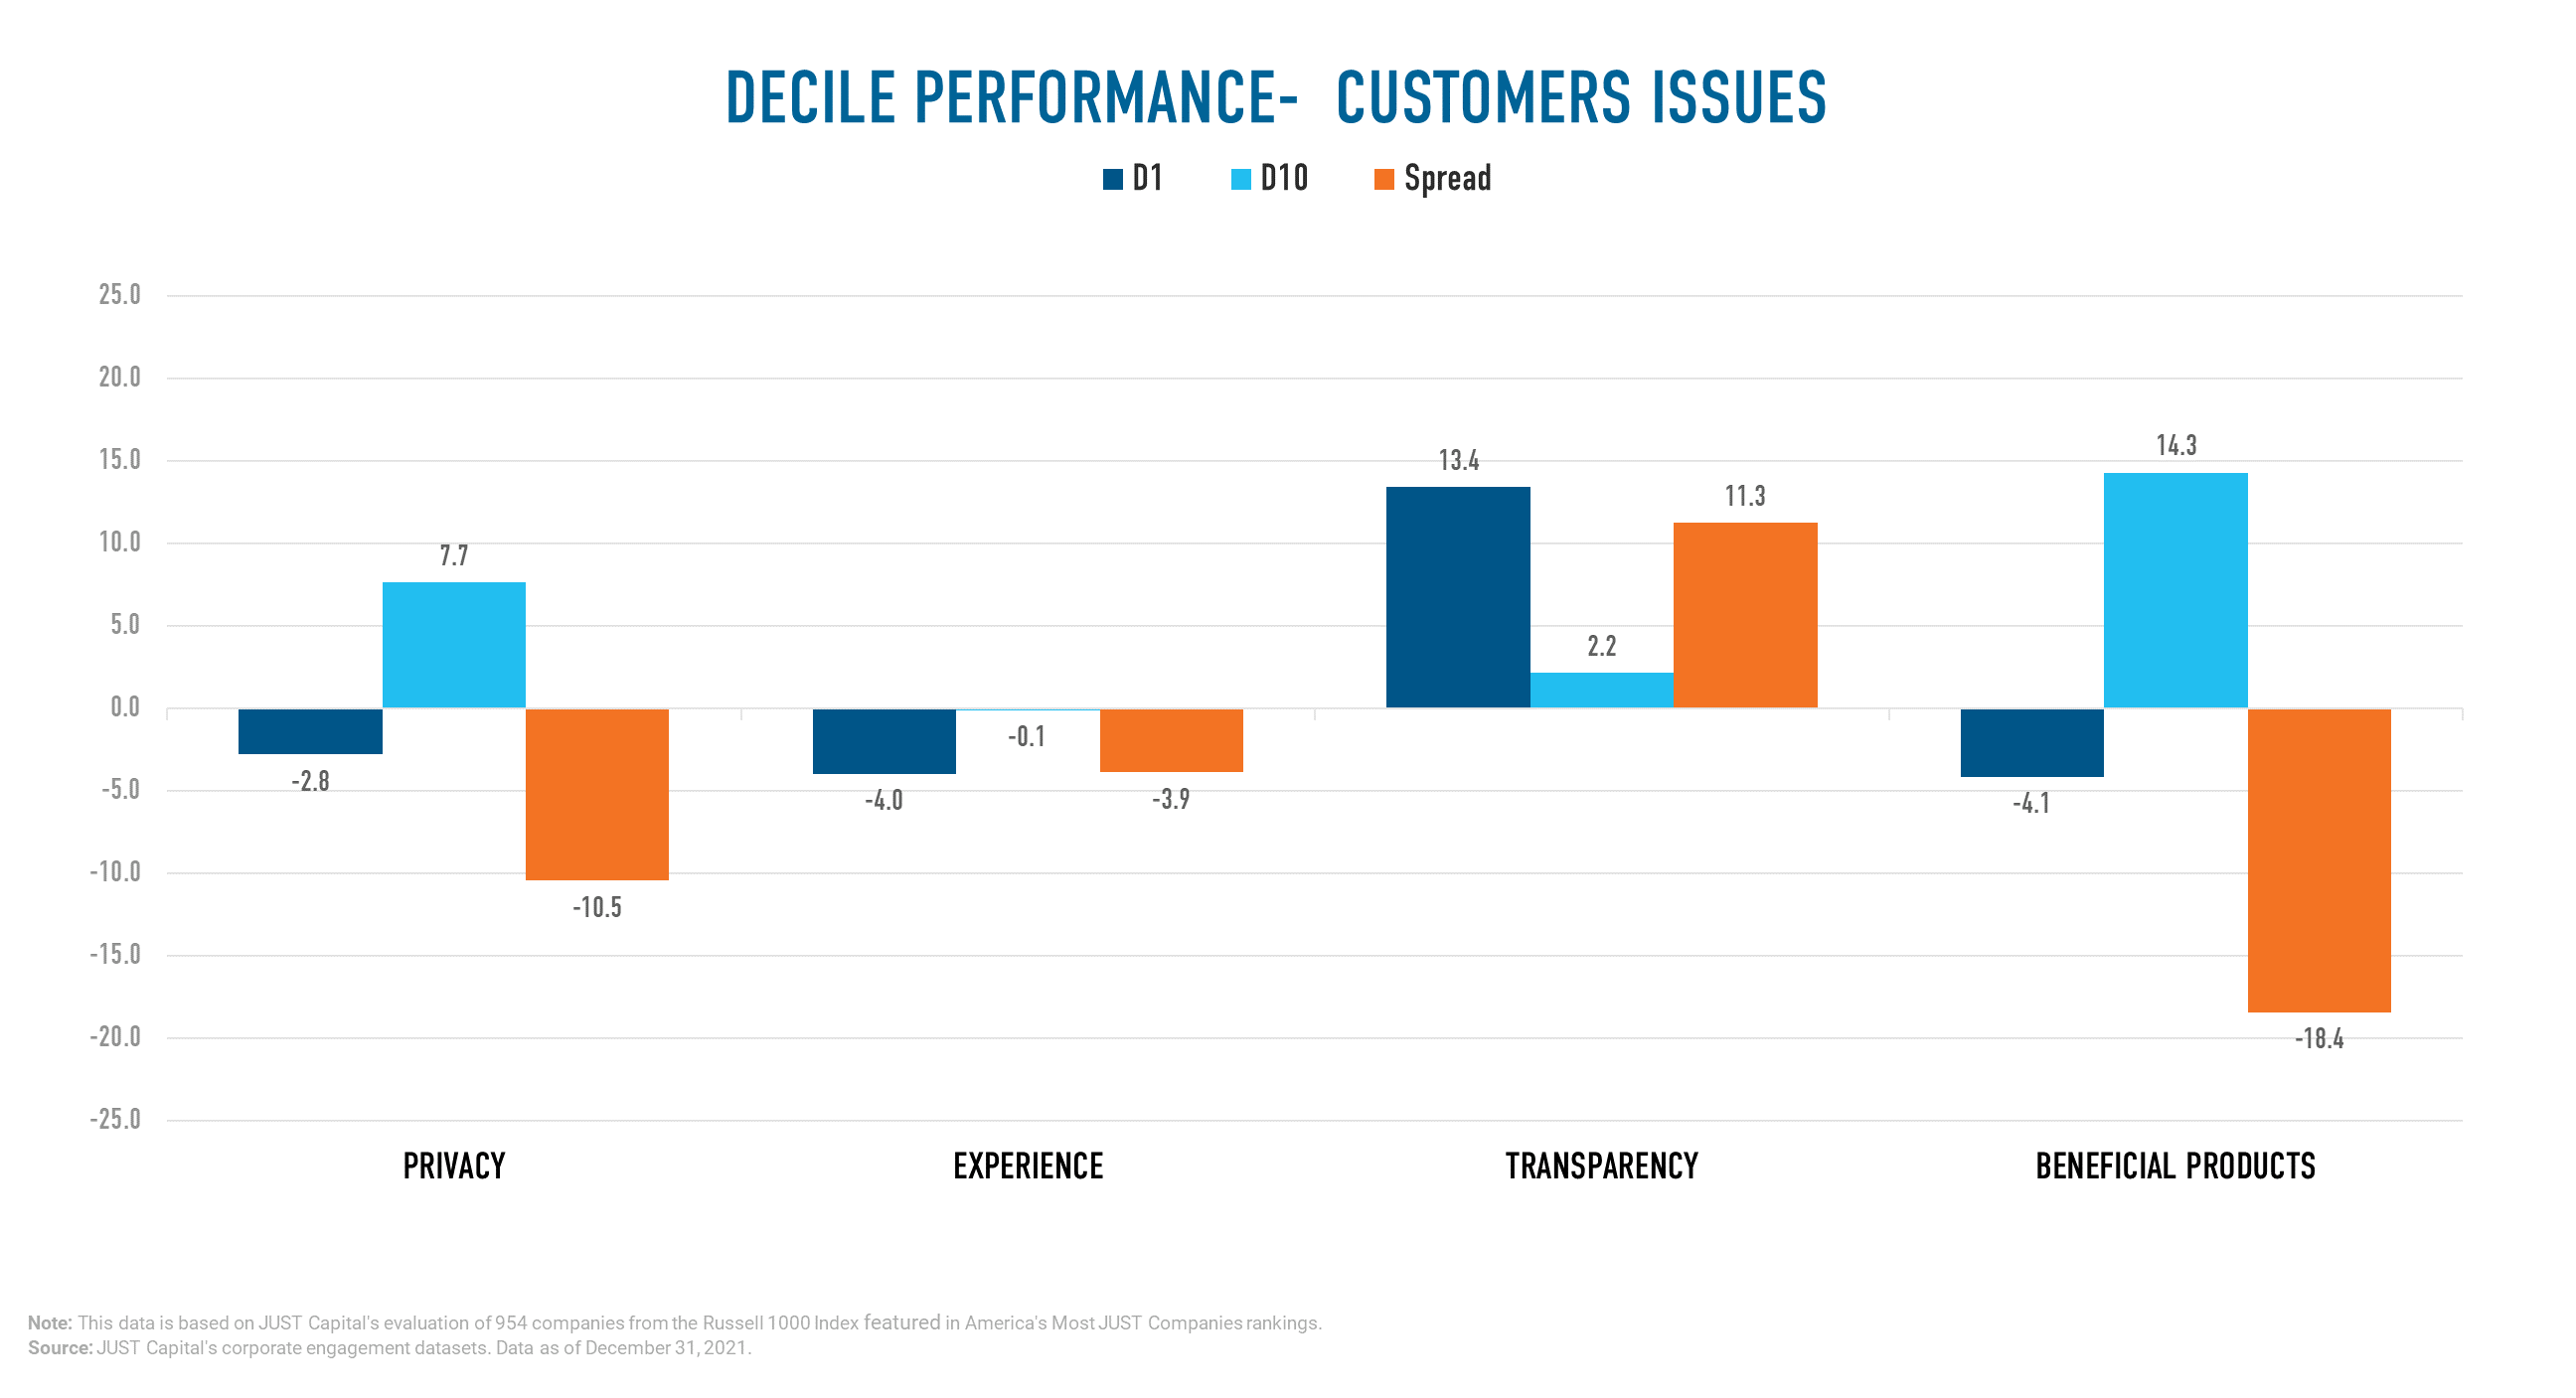
YTD we saw the Transparency outperform the other Customer Issues with a long-short spread of 11.26%. Beneficial Products, Privacy, and Experience were negative contributors to Customer performance.
Shown below are the both top and bottom five contributors to the top decile (D1), the best-ranked companies as measured by their Customer score, and the bottom decile (D10), the worst-ranked names as measured by Customer score.
The Environment stakeholder measures a company across four Issues:
YTD we saw Pollution Reduction outperform other Environment Issues. Resource Efficiency was also positive, while Sustainable Products and Climate Change had negative performance.
Shown below are the both top and bottom five contributors to the top decile (D1), the best-ranked companies as measured by their Environmental score, and the bottom decile (D10), the worst-ranked companies as measured by their Environmental score.
Computation Methodology
We monitor the performance of these stakeholders and Issues on a long-short basis. The long and short portfolios are selected based on the factor scores as the top and bottom deciles within the universe of companies we track in the Russell 1000. Top decile (D1) companies are those that rank highest based on the factor score, and bottom decile (D10) companies are those that rank lowest based on the factor score.
D1 Performance is computed as (Equally weighted average of returns of stocks in D1 bucket) – (Equally weighted average of returns of all stocks within the Universe).
D10 Performance is computed as (Equally weighted average of returns of stocks in D10 bucket) – (Equally weighted average of returns of all stocks within the Universe).
Spread is computed as D1 Performance – D10 Performance.