
Written by Cambria Allen-Ratzlaff and Mona Patni
Today, we’re excited to celebrate a very special milestone. The JUST ETF – which we launched in 2018 in partnership with Goldman Sachs Asset Management to track the top 50% of Russell 1000 companies according to the priorities of the American public – is turning five.
Just’s mission is to demonstrate that just business is better business, by incentivizing America’s largest companies to deliver on the priorities of the public. And a key part of achieving that aim is to drive financial capital toward companies that best serve the needs and expectations of their workers, customers, communities, and the environment.
That capital comes from shareholders – from families saving for their kids’ college to large institutions safeguarding pensions and healthcare for our teachers, municipal workers, and police officers – who provide money to firms through equity and debt financing. This money is then used by companies to power their businesses. Without it, companies couldn’t create good jobs, build the best products and services, support strong communities, and continue to innovate and grow.
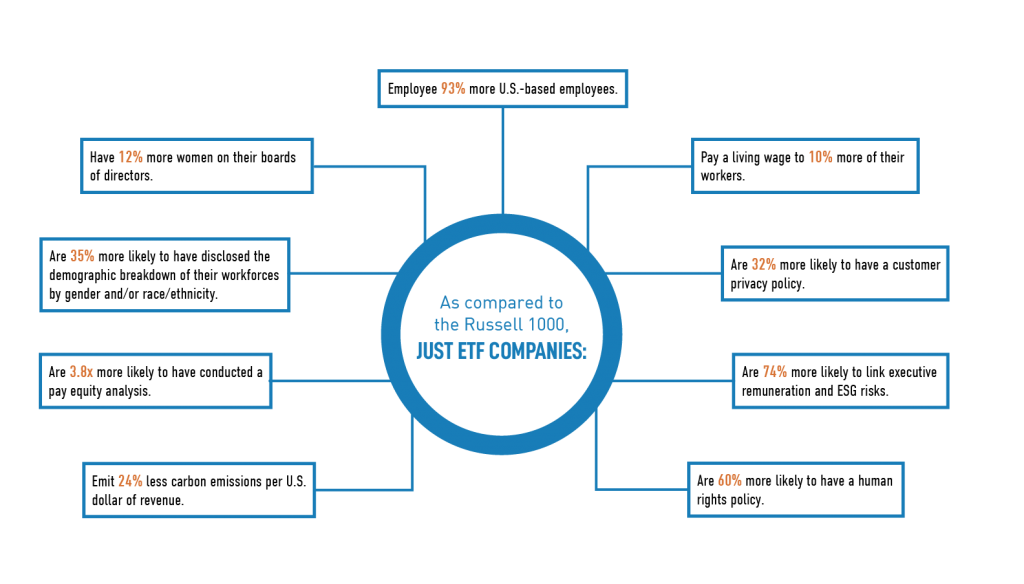
Financial capital has played a crucial role in developing America’s economy – including the growth of largest public companies in the Russell 1000, which collectively represent 93% of the U.S. public equity market. So what if we could measure how good individual companies are for America, using Americans’ own voices as the measuring stick – and then see how the companies that are best for workers, customers, communities, and the environment actually perform for their investors? In other words, can just companies create competitive value for shareholders, too?
The answer is a resounding yes. On June 7, 2018, we launched the Just ETF, powered by our proprietary Just U.S. Large Cap Diversified Index (JULCD). The JULCD represents the top half of companies in Just Capital’s Rankings of America’s Most JUST Companies, by industry, and has outperformed the Russell 1000 by 8.78% since inception through May 31, 2023. If you invested $100 in the fund at launch, you would have nearly $220 in your pocket today.
These companies not only outperform in the market but are leaders when it comes to the priorities of the American public. In our six years of survey research, we have found that Americans are remarkably united in what they want companies to prioritize: workers, wages, and jobs. Paying a fair and living wage is the most important priority across all demographic groups, followed by creating jobs in their communities. Americans also expect companies to behave ethically, serve their customers with beneficial, safe products, and act as responsible stewards of the environment and the communities in which they operate.
In this regard, the JUST ETF also delivers concrete impact. Companies in the JUST ETF are innovative and can quickly adapt in response to risks and opportunities impacting their businesses, while protecting and strengthening brand value.
The JUST ETF is a live accounting of how companies that deliver value for their workers, customers, communities, and the environment, deliver value for their shareholders, as well. These are the companies that understand they are of society, not apart from society.
As we look ahead to the next five years of the Just ETF and beyond, we remain committed to demonstrating the value of just corporate leadership, as defined by the voice of the American public.
The Investor Solutions team at Jist Capital continues to expand the suite of products tracking our in-depth company research and polling of the American public. We firmly believe that together we can create a more just and equitable marketplace that works for all Americans. Please reach out using this request form below if you have an interest in partnering with us to launch your next innovative large-cap public equity or fixed income strategy.
Note: Tracking Error of JUST ETF vs JUST U.S Large Cap Diversified (JULCD) Index is 0.1 as of March 31 2023 over 1 year.
The information contained herein is for informational purposes only without regard to any particular user’s investment objectives, risk tolerances or financial situation and does not constitute investment advice, nor should it be considered a solicitation or offering to investors residing outside the United States. JUST Capital makes no representation as to the advisability of investing in any investment fund or other vehicle. Shares of JUST are made only by prospectus. The addition, removal, or inclusion of a security in any JUST Capital index is not a recommendation to buy, sell, or hold that security, nor is it investment advice. The JUST Parties do not in any way sell, sponsor, support, promote, or endorse any securities based on the JULCD, or have any involvement in their operations or distribution. Prospective investors should not make a decision to invest in any investment fund or other vehicle based on the information contained in this website, and JUST Capital shall not be responsible or liable for any advice given to third parties or decisions to invest in any investment fund or other vehicle by you or third parties based on the information. Index performance does not reflect the deduction of any fees or expenses. Past results of the JUST U.S. Large Cap Diversified Index are no guarantee of future performance.
The JUST US Large Cap Diversified Index is calculated and maintained by FTSE Russell using the Russell 1000 Index as a starting universe, and aims to reflect the performance of a JUST Capital Foundation Inc. methodology. FTSE Russell does not sponsor, endorse, sell, or promote any investment vehicle that is offered by any third party that seeks to provide an investment return based on the performance of any index. It is not possible to invest directly in an index.
This report was written by Mona Patni, Director of Quantitative Research & Analytics.
After a year of volatility and uncertainty, U.S. stocks gained during the first quarter of 2023 in a surprise show of resilience despite a banking crisis, cryptocurrency meltdowns, and plenty of uncertainty around interest rates. The Russell 1000 index concluded a turbulent first quarter of 2023 to rise around 7%, while the tech-heavy Nasdaq Composite proved to be the real standout, soaring nearly 17%. With respect to sector performance, seven of the 11 large-cap sectors were higher, led by Technology and Communications while stocks in the energy and healthcare sectors lagged the most over the quarter.
Although the JUST Overall Weighted Score has outperformed the Russell 1000 by 50.67% from Jan 2018 to March 2023, JUST Capital found that all five stakeholders we track delivered negative performance in Q1 2023, primarily driven by negative contribution from the Financials sector. The Shareholders and Governance stakeholder delivered the best performance over this period with a long-short spread of -1.32%, while Communities stakeholder fared the worst at -9.11%. Within the Workers and Communities stakeholders, underperformance was driven by both deciles, with the top decile underperforming and bottom decile outperforming. For the remaining stakeholders, underperformance was driven by the bottom decile.
JUST Capital’s Overall Weighted Score takes into account the 20 core Issues determined through our survey research – including paying a living wage, creating a diverse, inclusive workplace, and helping combat climate change – across key business stakeholders: Workers, Communities, Shareholders and Governance, Customers, and Environment. This Overall Weighted Score had a negative long-short spread of -7.14% over the period ending March 31, 2023.
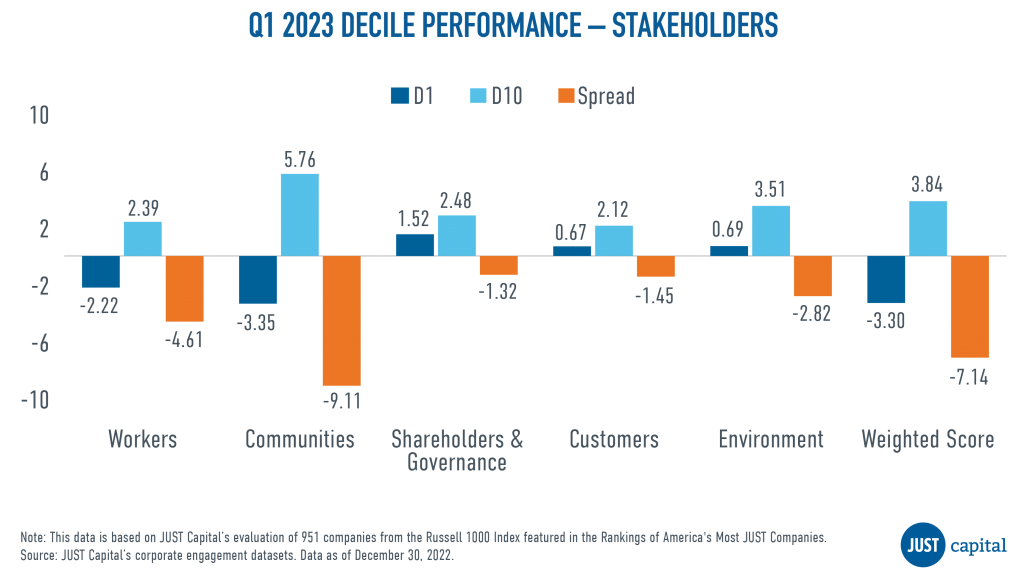
Negative contribution in the top decile of the Overall Weighted Score was driven primarily by both allocation and selection within the Financials sector. Overweight in Financials was driven by banks outperforming other industries on the Local Job Creation, Resource Efficiency, and Living Wage Issues, which together make up more than 33% of our model.
Owning stocks like First Republic Bank (-88.9%) and Comerica (-33.98%) didn’t help the performance of the top decile of the Overall Weighted Score. Following the failures of Silicon Valley Bank and Signature Bank, which led to broader concerns about industry liquidity, regional banks’ (especially First Republic Bank’s) stock price came under pressure due to exposure to venture capital and a large amount of uninsured deposits, similar to the failed banks. On the other hand, the bottom decile, which consists of low performers, counter-intuitively outperformed the Russell 1000. Negative contributions largely came from Industrials and Technology names. Bottom decile companies like Vontier (Industrials) and Universal Display Corp (Technology) rallied during this quarter.
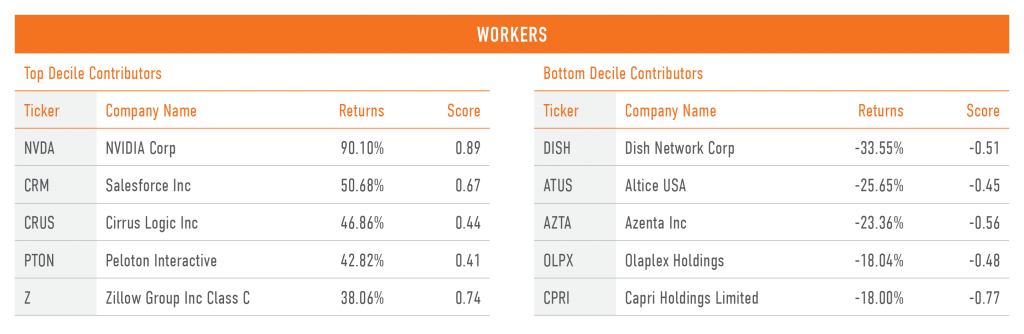
The Workers stakeholder measures a company across five Issues:
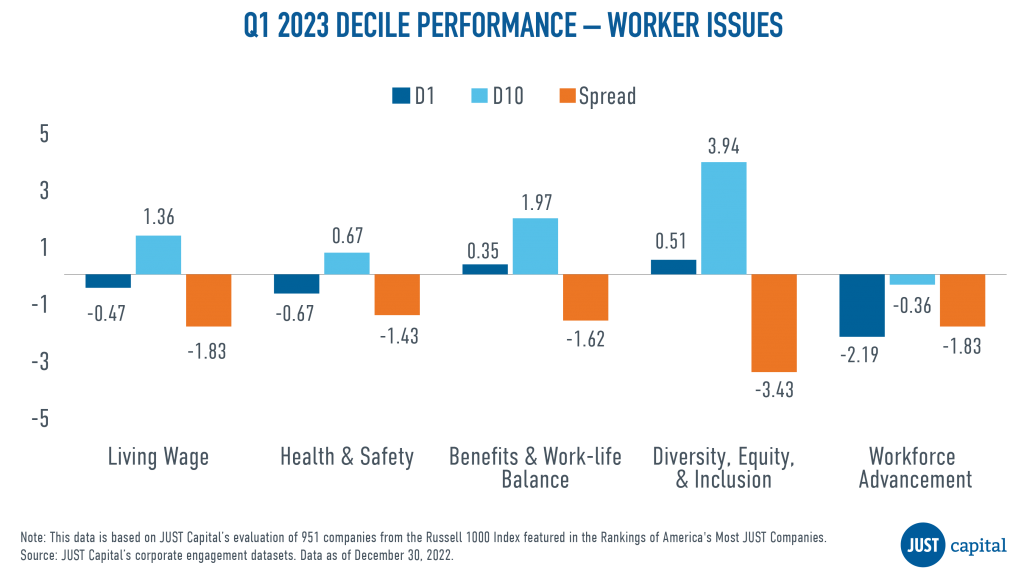
In Q1 2023, we saw all the Worker Issues underperform. Underperformance in Living Wage and Health & Safety was driven by negative performance from both top and bottom decile companies.
Shown below are the top and bottom five contributors to the top decile (D1), the top-ranked companies as measured by their Workers score, and the bottom decile (D10), the lowest-ranked companies as measured by their Worker score.
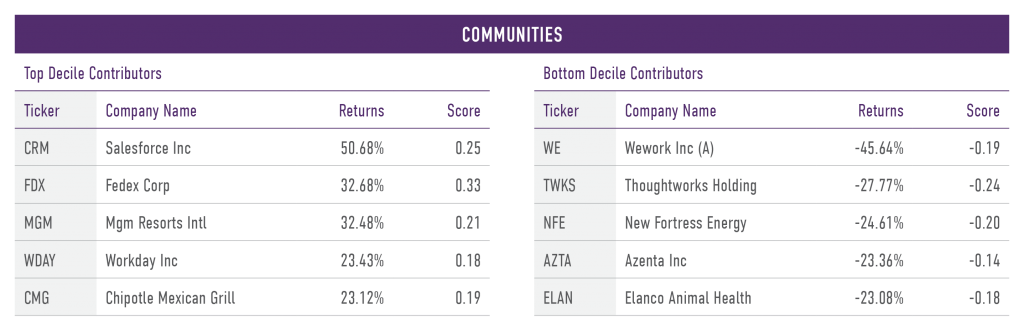
The Communities stakeholder measures a company across four Issues:
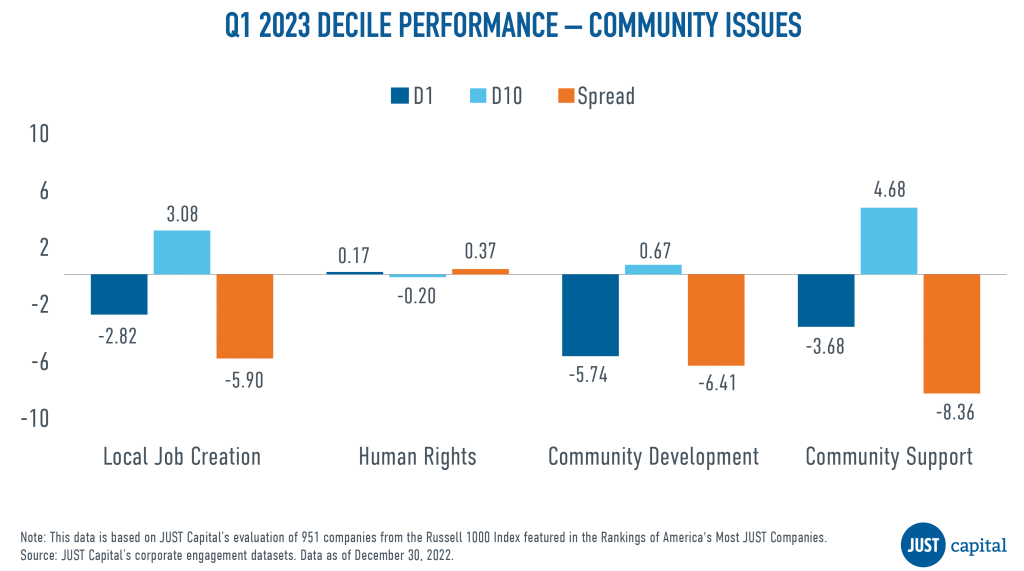
Community Support was the weakest performer followed by Community Development and Local Job Creation, with negative contribution coming from both top and bottom decile companies.
Shown below are the both top and bottom five contributors to the top decile (D1), the best-ranked companies as measured by their Communities score, and the bottom decile (D10), the lowest-ranked companies as measured by their Communities score.
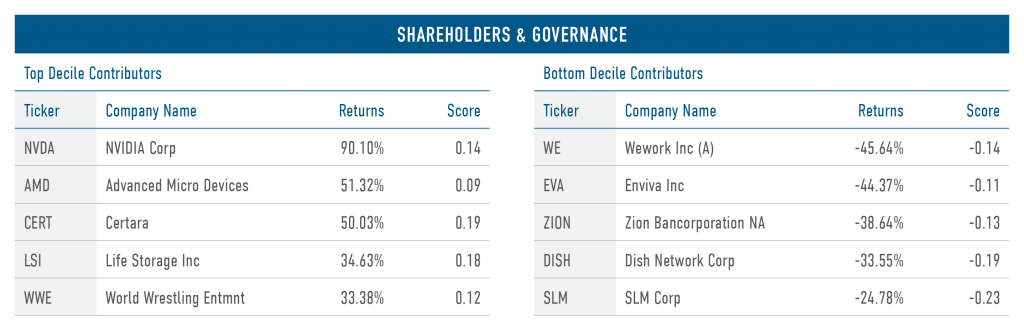
The Shareholders and Governance stakeholder measures a company across three Issues:
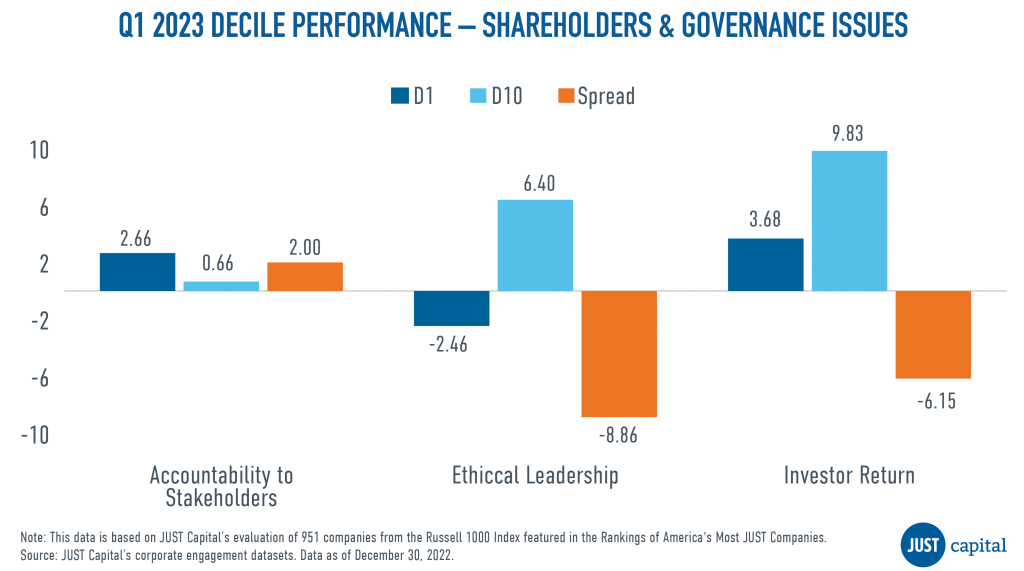
In Q1 we saw the Accountability to Stakeholders Issue deliver positive performance, with a long-short spread of 2%, whereas Ethical Leadership and Investor Return stakeholder performance was negative.
Shown below are both the top and bottom five contributors to the top decile (D1), the best-ranked companies as measured by their Shareholders and Governance score, and the bottom decile (D10), the lowest-ranked companies as measured by their Shareholders and Governance score.
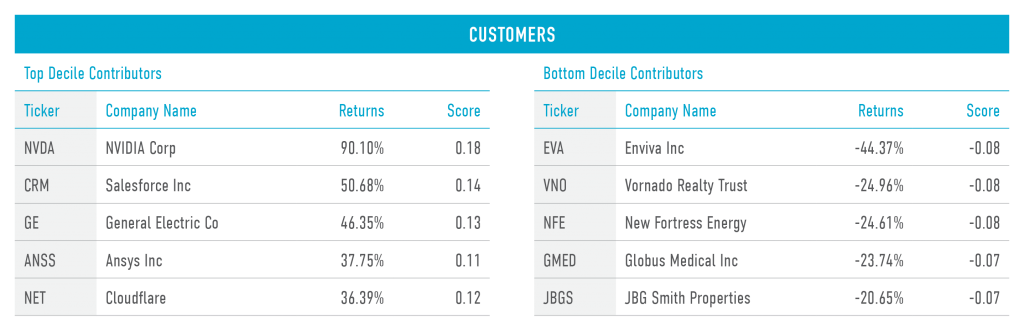
The Customers stakeholder measures a company across four Issues:
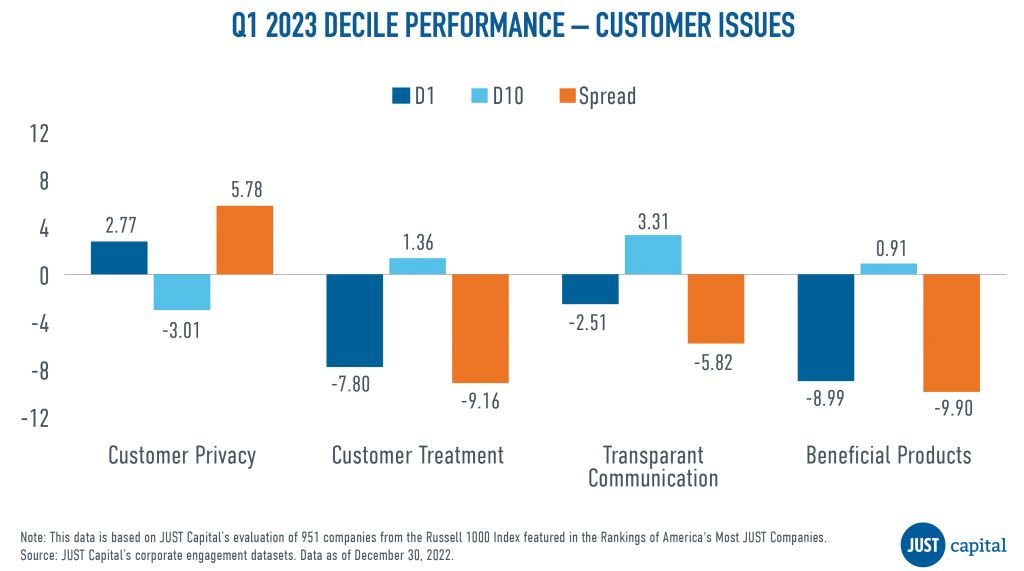
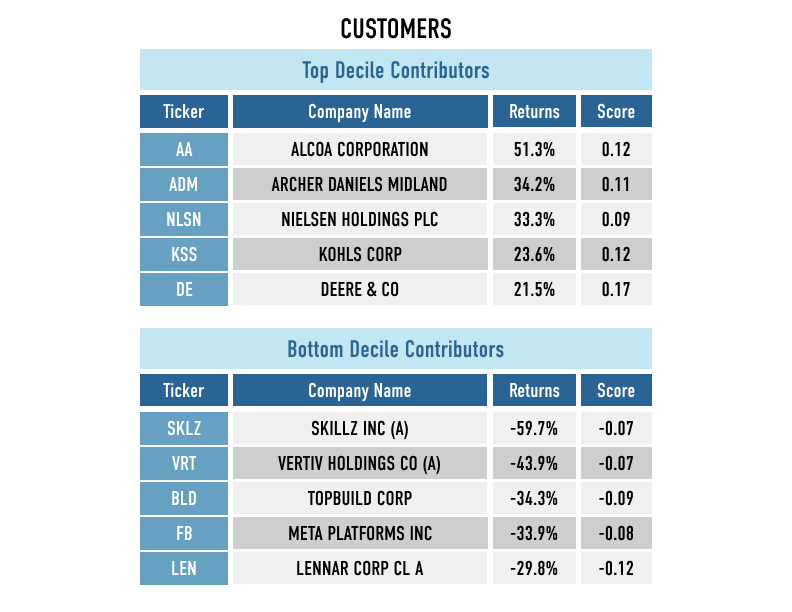
In Q1 2023, we saw Customer Privacy outperform the other Customer Issues, with a long-short spread of 5.78%. Beneficial Products, Customer Treatment, and Transparent Communication were negative contributors to Customer performance.
Shown below are the both top and bottom five contributors to the top decile (D1), the best-ranked companies as measured by their Customer score, and the bottom decile (D10), the lowest-ranked names as measured by Customer score).
The Environment stakeholder measures a company across four Issues:
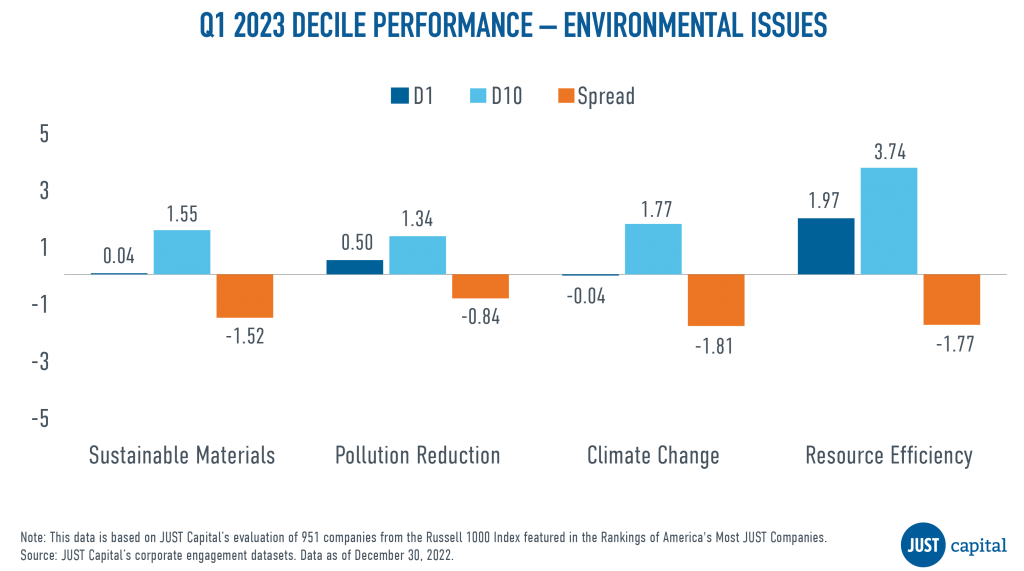
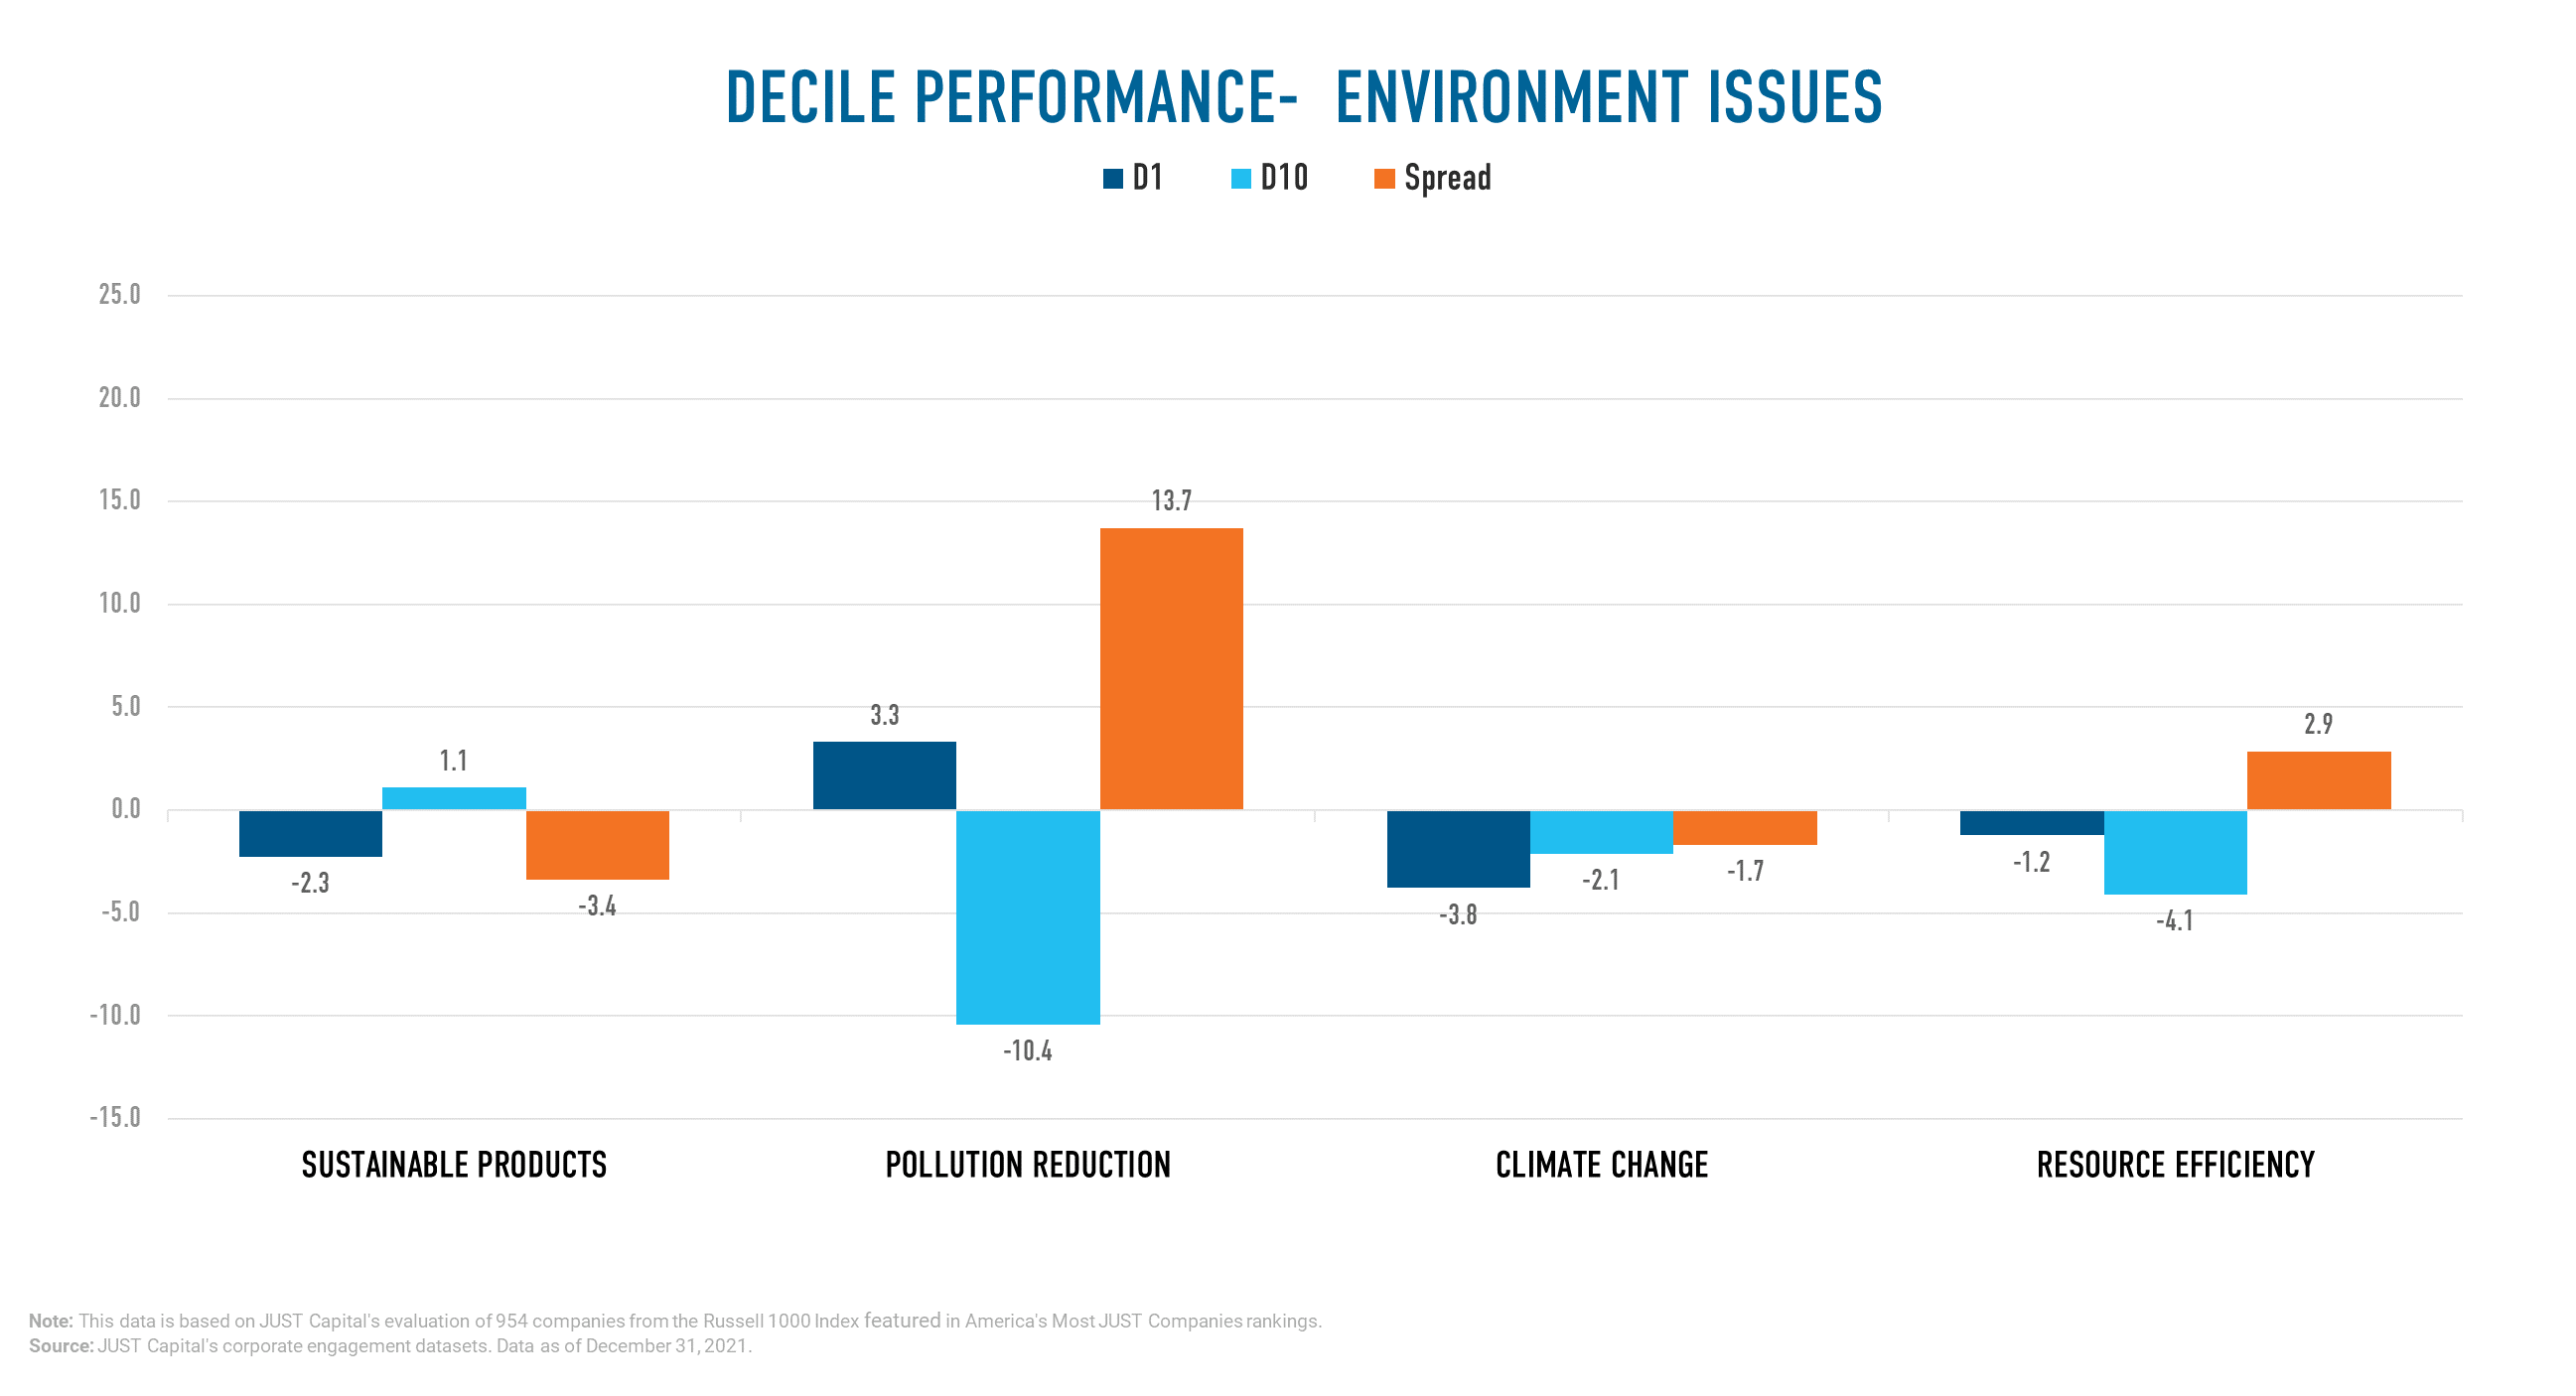
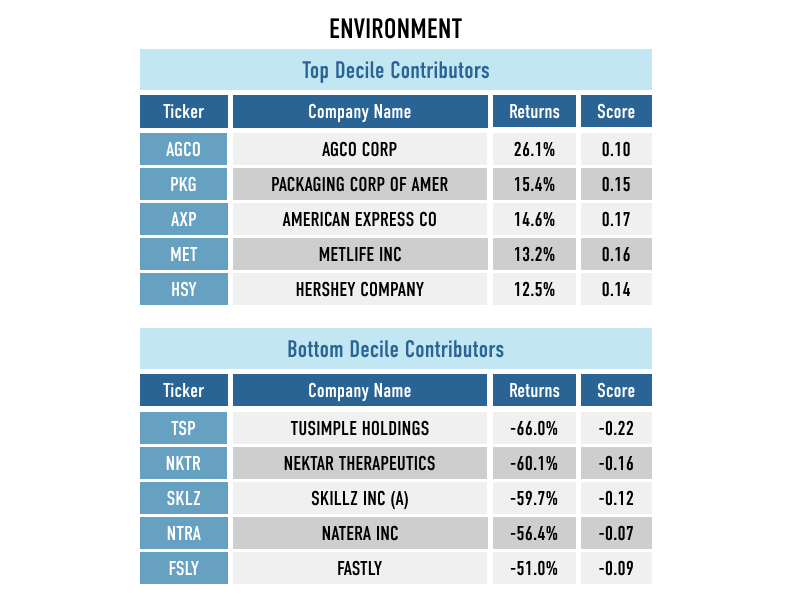
In Q1 2023, we saw all Environment Issues deliver negative performance with Pollution Reduction outperforming other Environment Issues. Resource Efficiency, Sustainable Materials, and Climate Change delivered negative performance in this quarter.
Shown below are the both top and bottom five contributors to the top decile (D1), the best-ranked companies as measured by their Environmental score, and the bottom decile (D10), the lowest-ranked companies as measured by their Environmental score.
Computation Methodology
We monitor the performance of these stakeholders and Issues on a long-short basis. The long and short portfolios are selected based on the factor scores as the top and bottom deciles within the universe of companies we track in the Russell 1000. Top decile (D1) companies are those that rank highest based on the factor score, and bottom decile (D10) companies are those that rank lowest based on the factor score.
D1 Performance is computed as:
(Equally weighted average of returns of stocks in D1 bucket) – (Equally weighted average of returns of all stocks within the Universe)
D10 Performance is computed as:
(Equally weighted average of returns of stocks in D10 bucket) – (Equally weighted average of returns of all stocks within the Universe)
Spread is computed as:
D1 Performance – D10 Performance
January 19, 2023
By Mona Patni
2022 was a challenging and volatile year for both stock and bond markets. The war in Ukraine,a 40-year high in inflation, historically aggressive Fed rate hikes, and growing concerns about economic and earnings recessions were the main sources of bond and equity markets’ struggles. However, the final quarter of the year did bring some relief with gains in Q4 but still resulted in the worst year for the S&P 500 index since the Global Financial Crisis.
By market capitalization, large-caps slightly out-performed small-caps in the fourth quarter, but modestly outperformed throughout 2022. Large-cap outperformance and small-cap underperformance throughout 2022 was driven by concerns about future economic growth and higher interest rates. Value stocks massively outperformed growth stocks all year and that trend continued in the fourth quarter. Underwhelming earnings weighed on tech stocks in the final three months of the year, while concerns about slowing economic growth combined with rising bond yields hit richly valued tech stocks throughout 2022.
On a sector level, 10 of the 11 S&P 500 sectors finished the fourth quarter with a positive return, although only two of the 11 ended 2022 with gains. Energy outperformed other sectors not just in the fourth quarter but for all of 2022.
In Q4 2022, in which both stocks and bonds saw solid gains, JUST Capital found that all five of the stakeholders we track delivered positive performance. The Environment stakeholder delivered the best performance over this period with a long-short spread of 13.48%, followed by Shareholders and Governance stakeholder. For all stakeholders other than Workers, top decile stocks outperformed and bottom decile stocks underperformed the universe average; for Workers, the bottom decile outperformed the universe average.
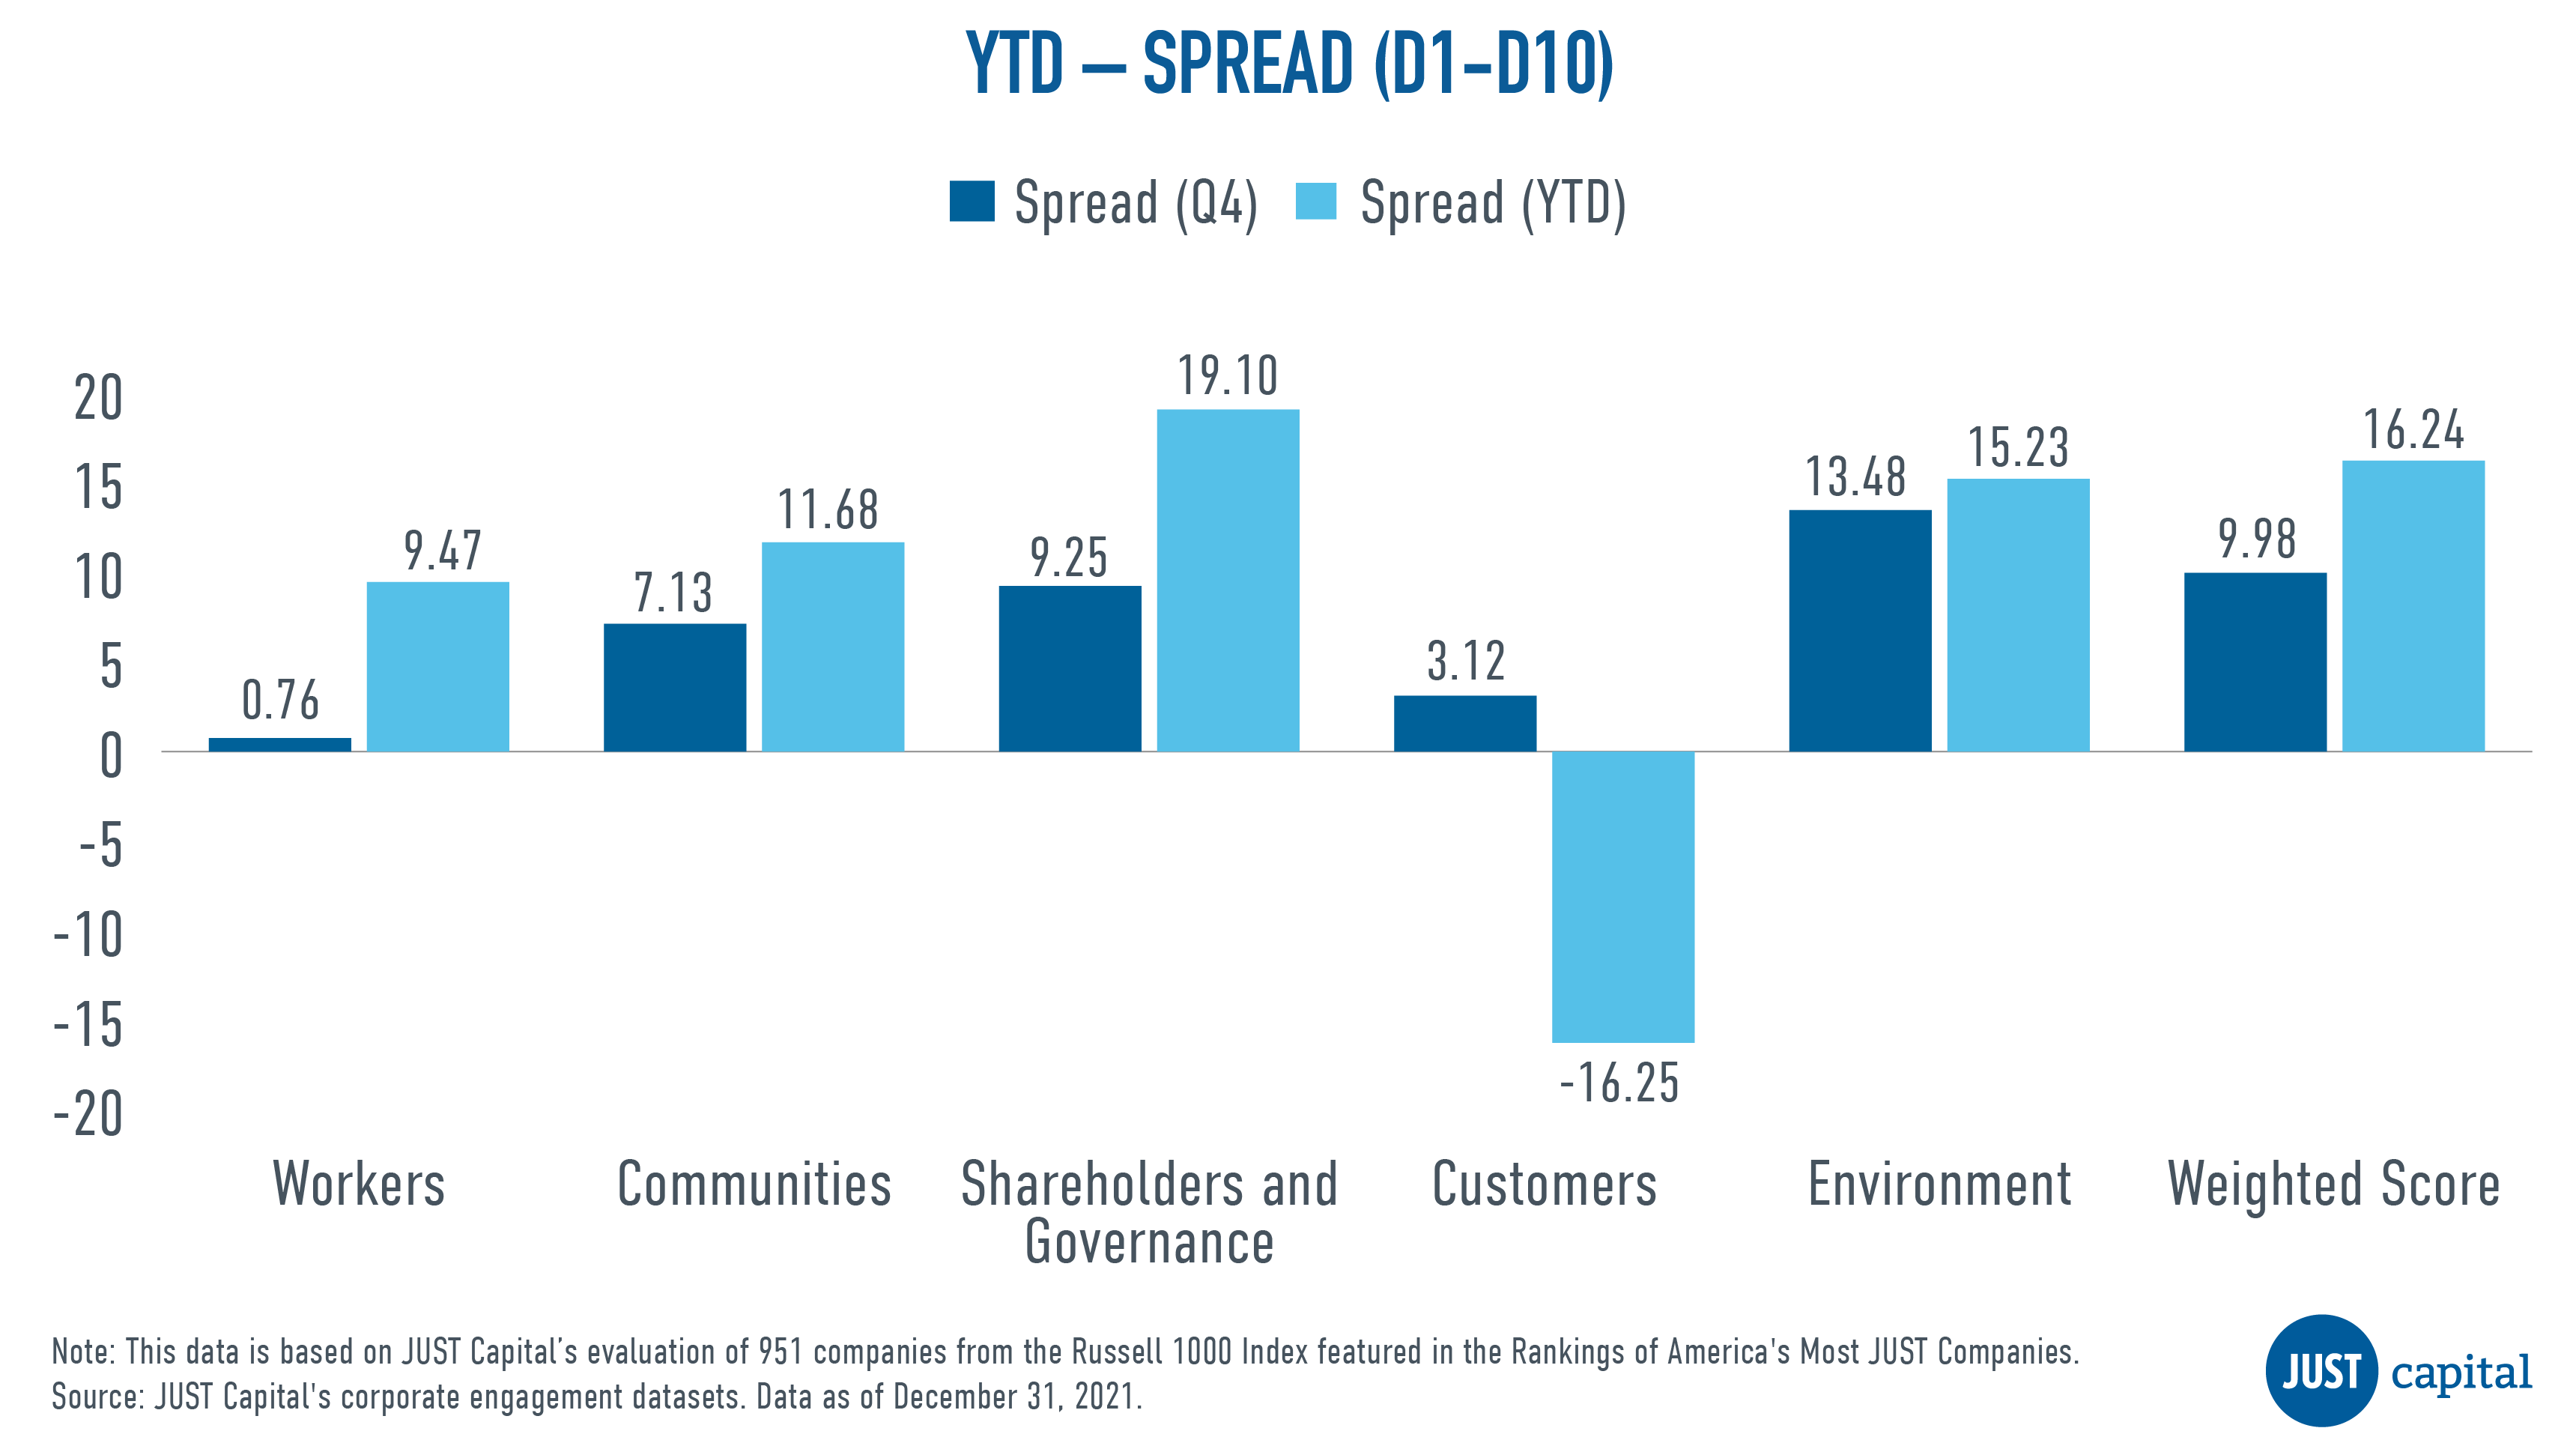
JUST Capital’s Overall Weighted Score takes into account the 20 core Issues determined through our survey research – including paying a living wage, creating a diverse, inclusive workplace, and helping combat climate change – across key business stakeholders: Workers, Communities, Shareholders and Governance, Customers, and the Environment. This Overall Weighted Score had a positive long-short spread of 9.98% in Q4 and delivered a 16.24% spread in 2022.
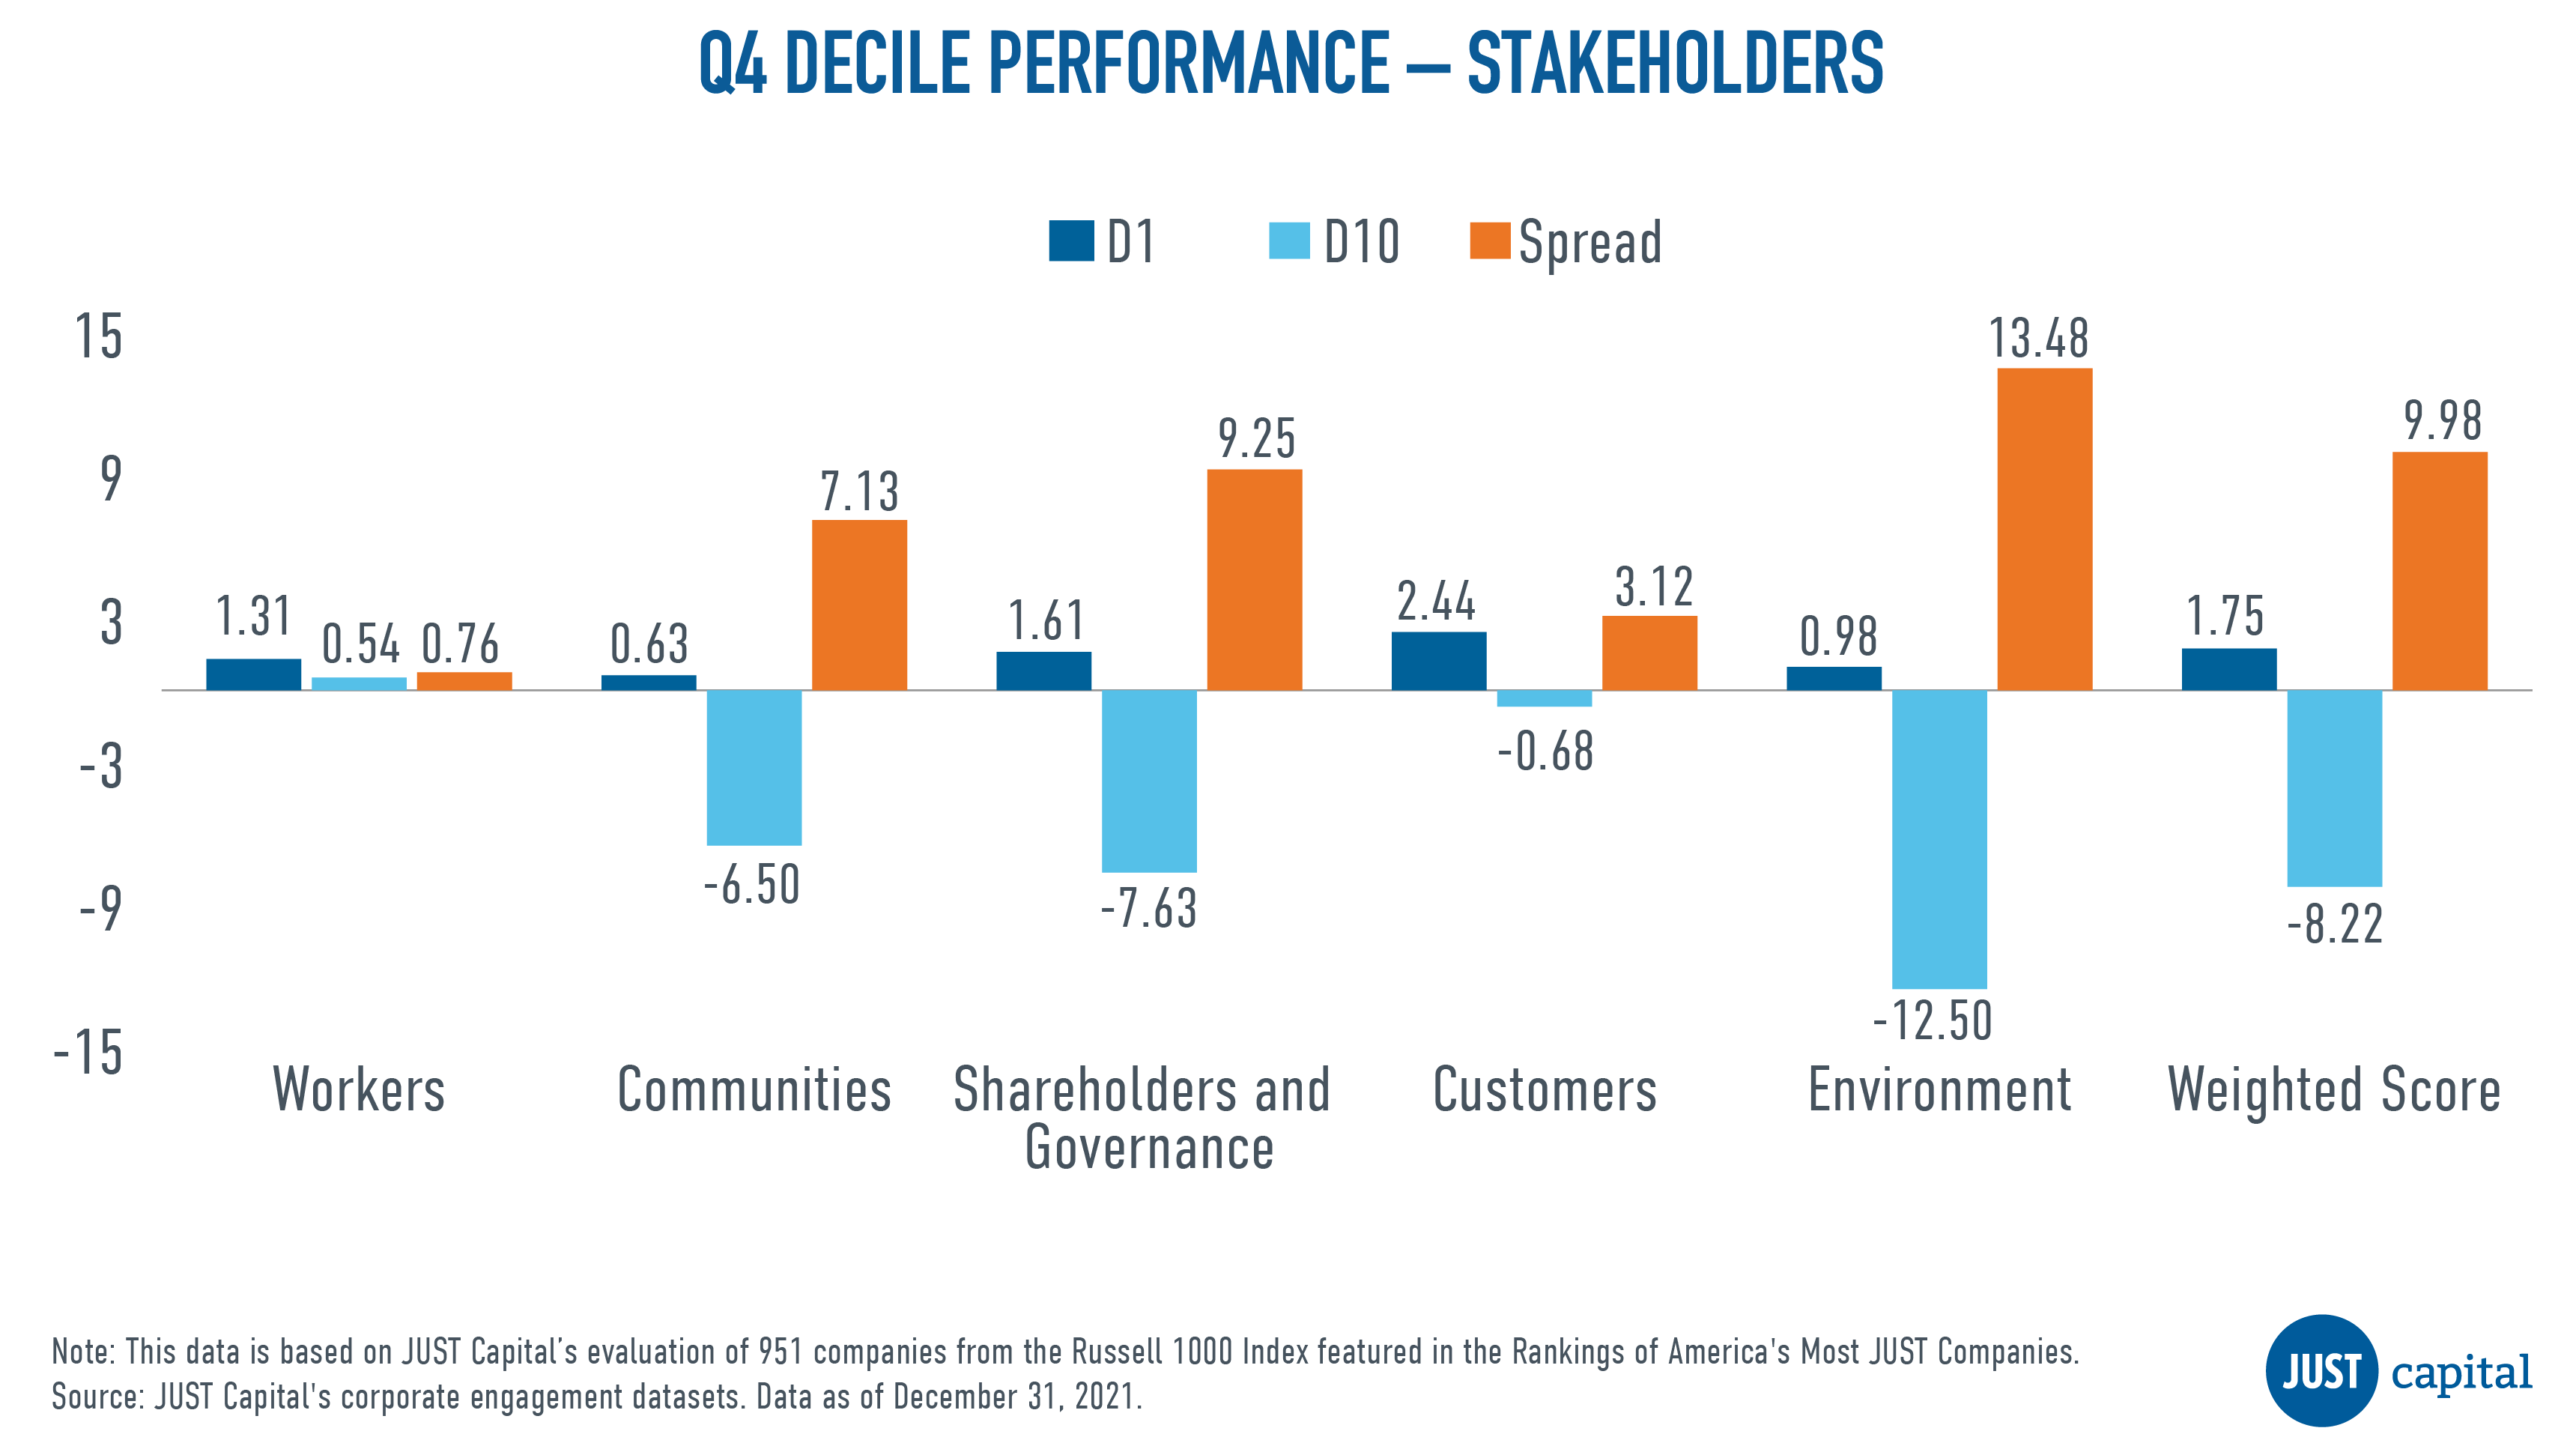
Shown below is the Year-to-Date (YTD) and Q4 performance, which is quantified by the spread between the top and bottom deciles of all the stakeholders and the overall weighted score.
The Workers stakeholder measures a company across five Issues:
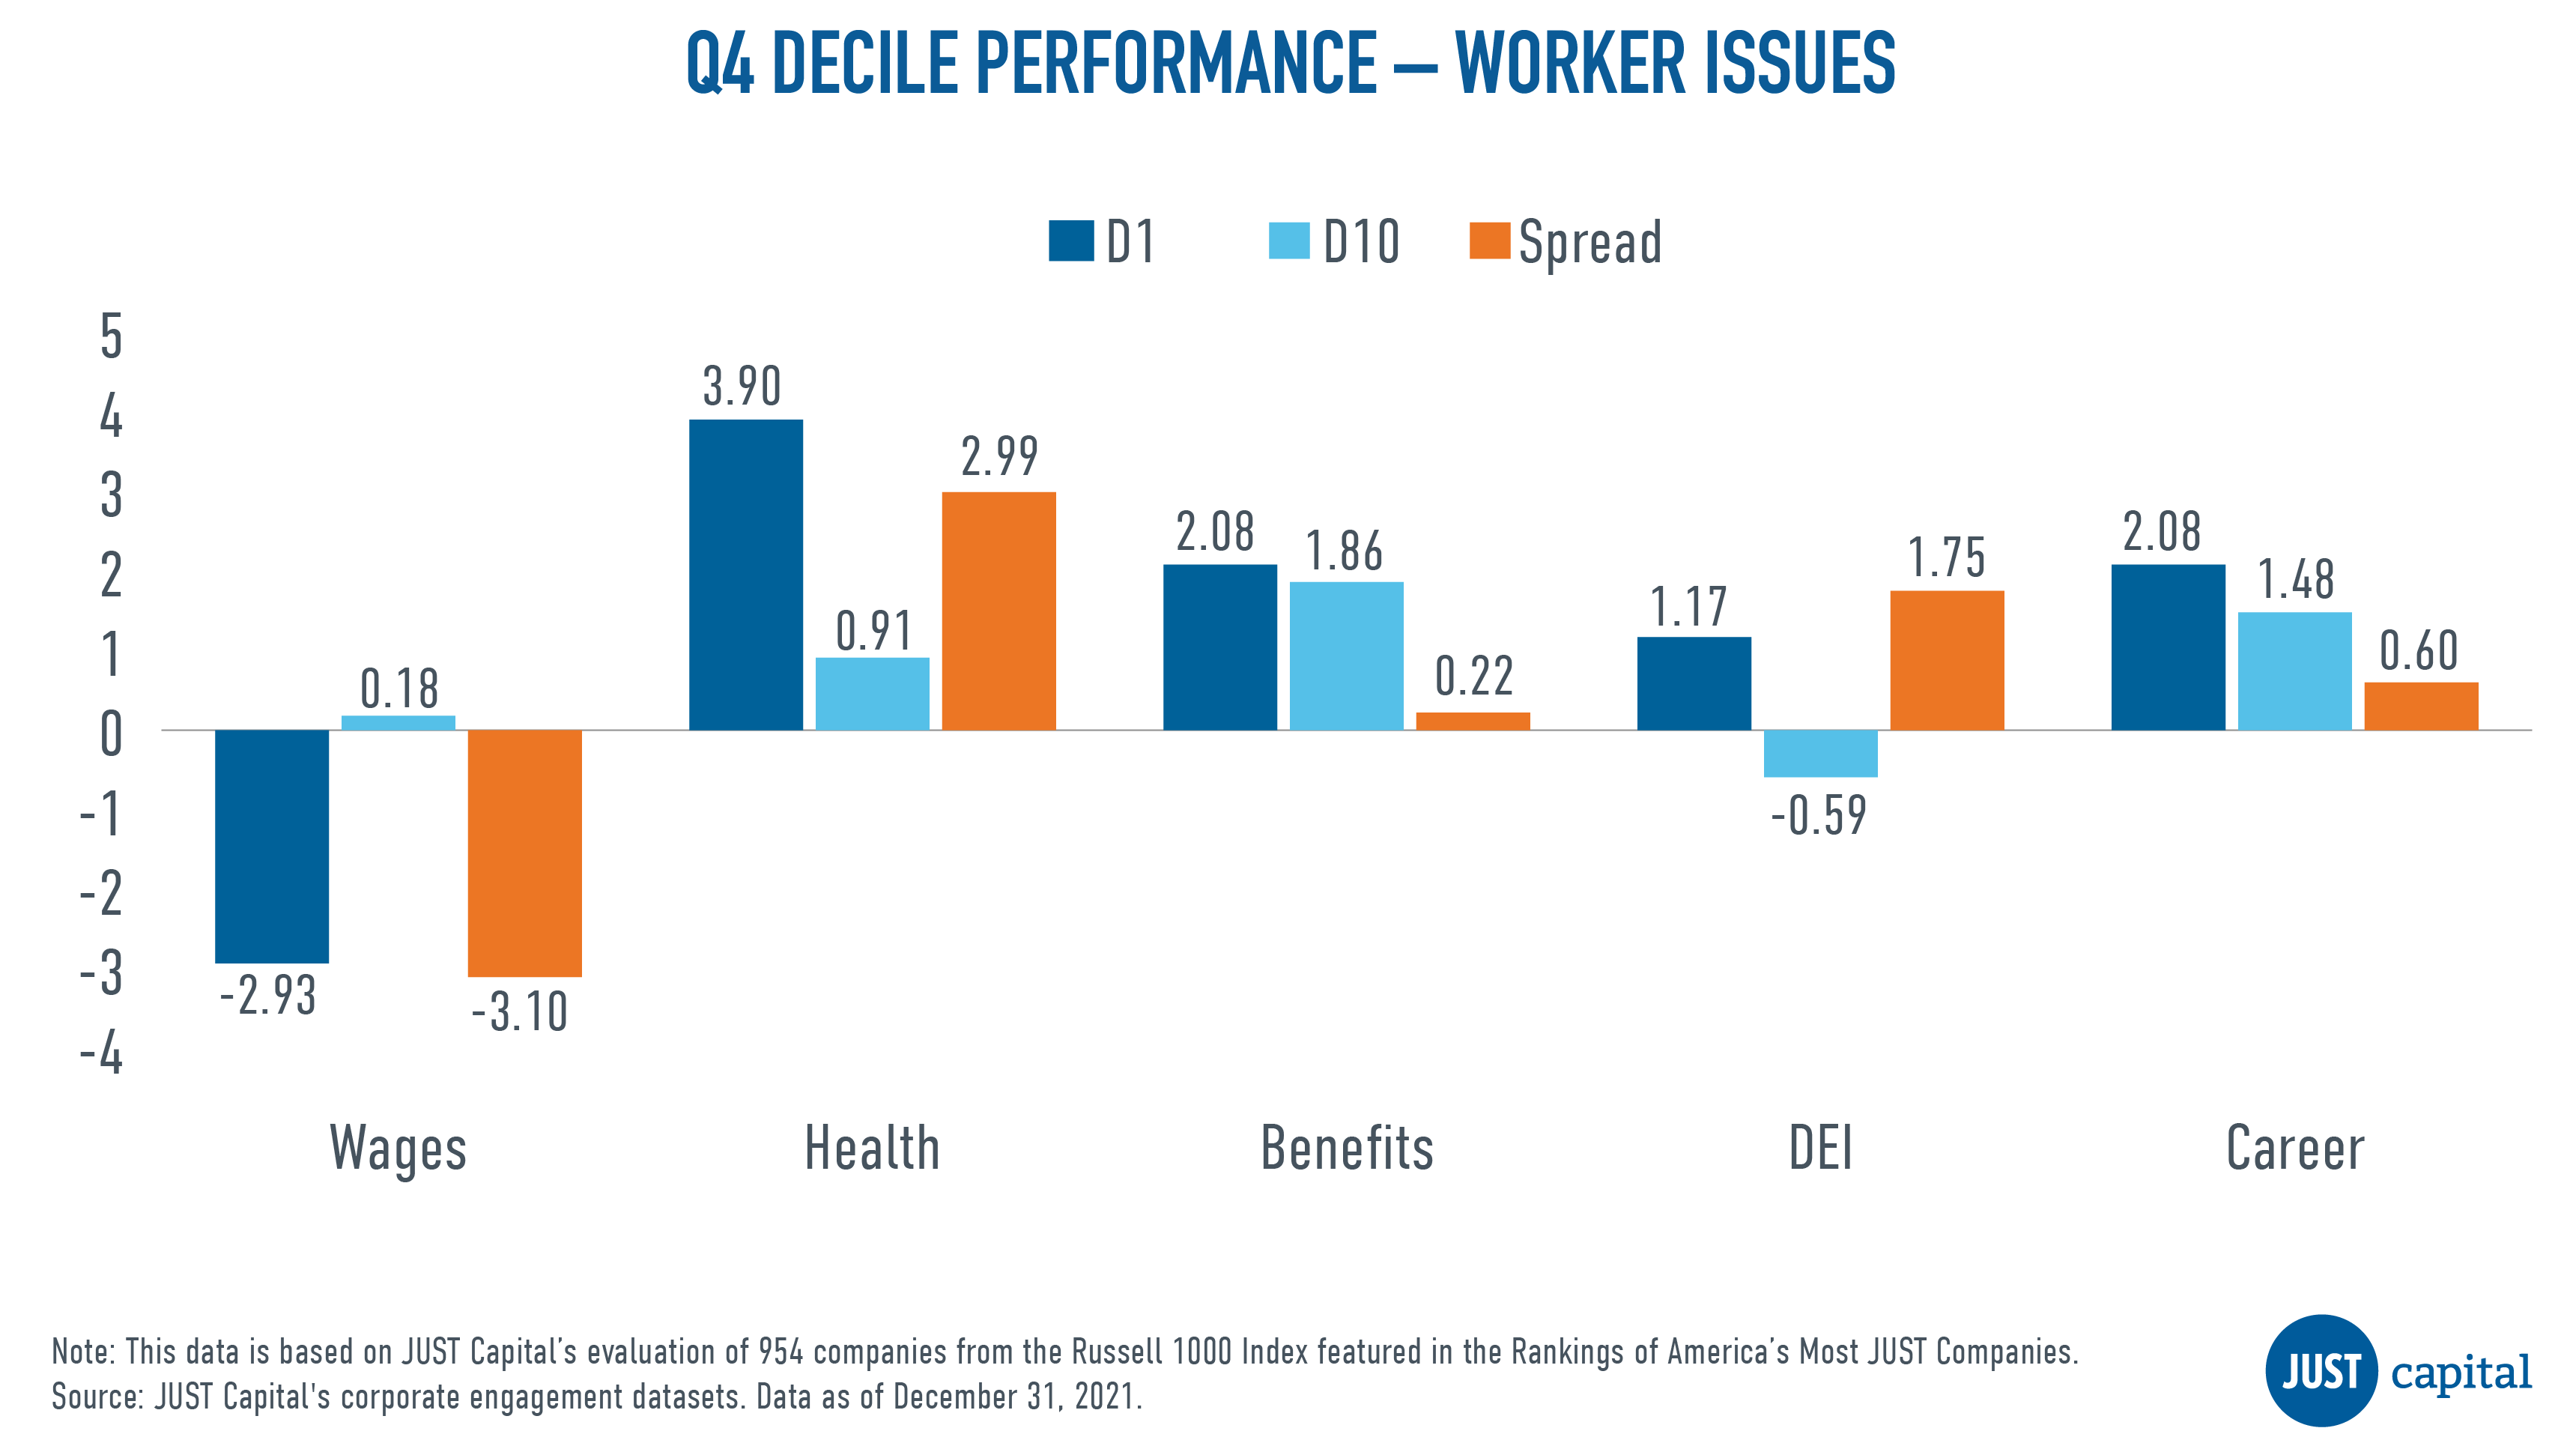
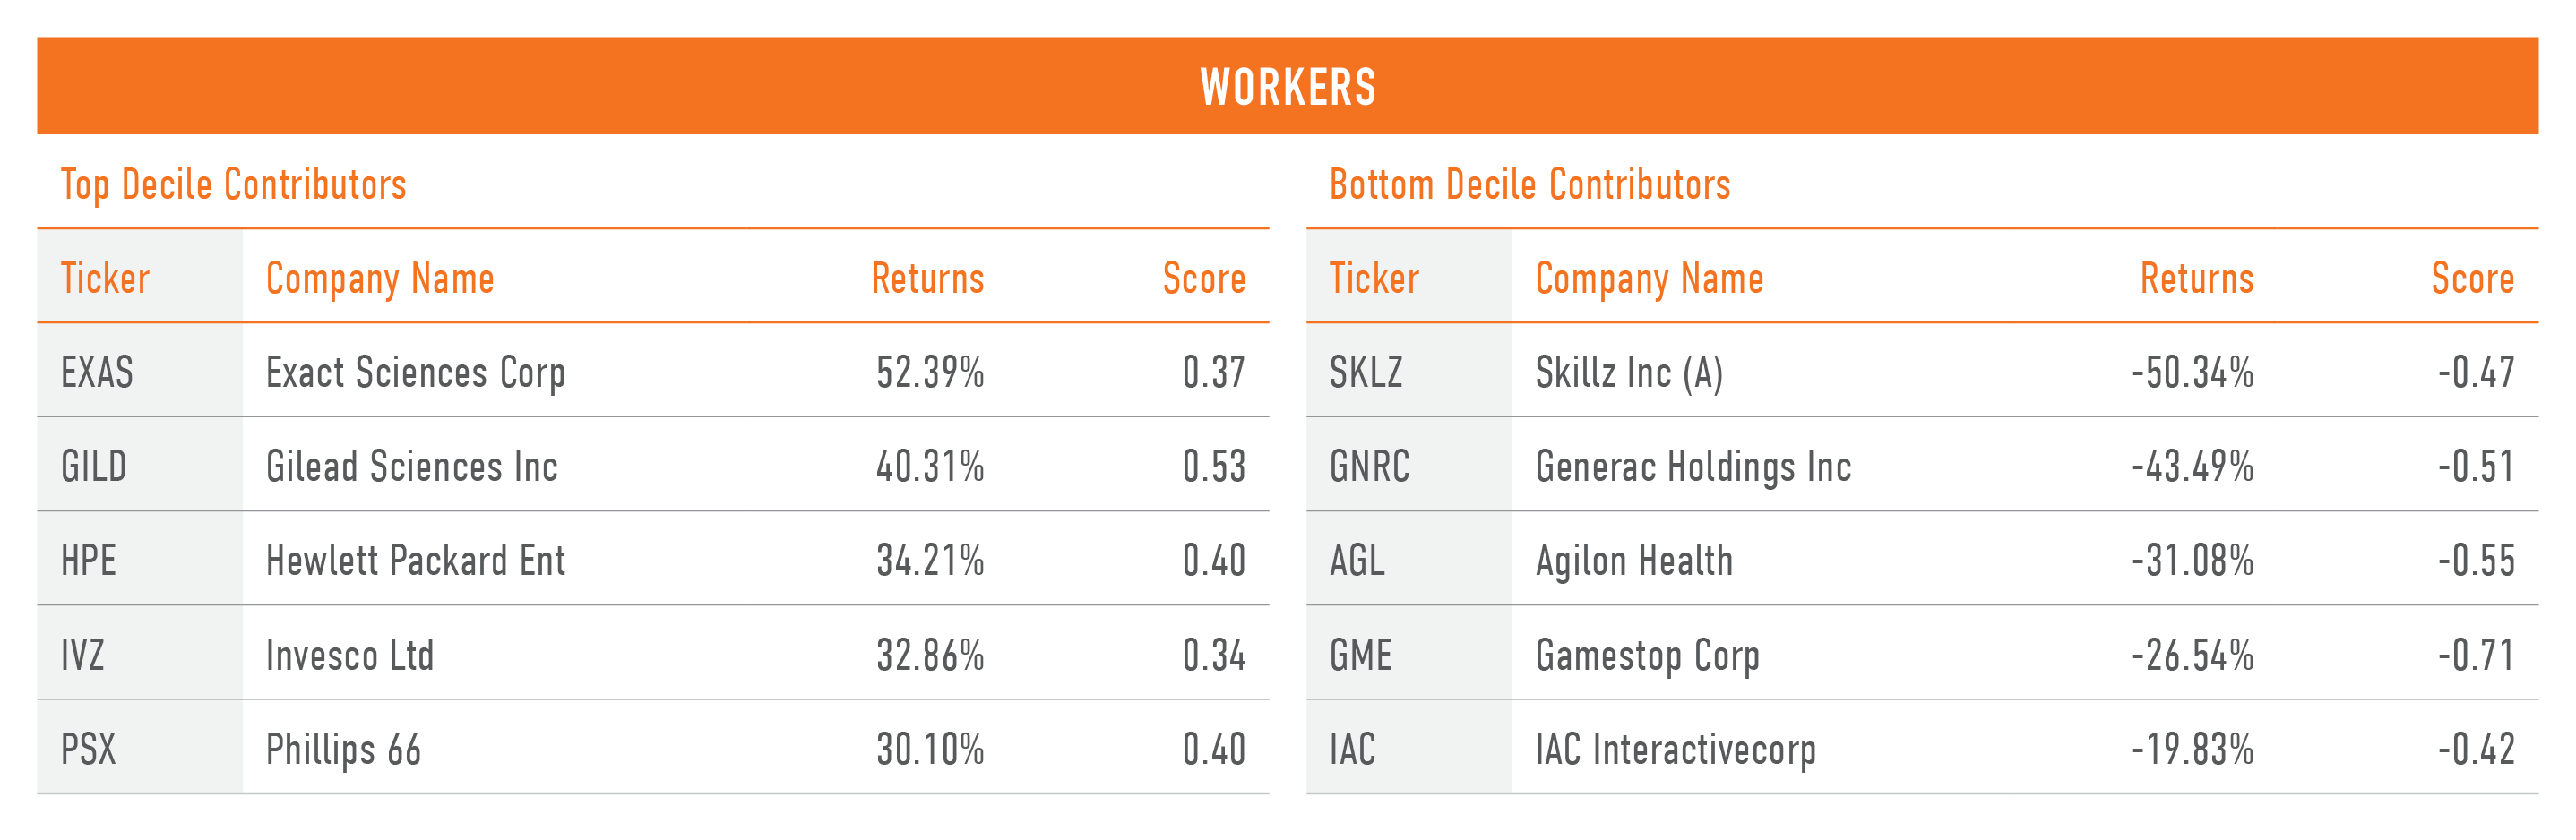
In Q4, we saw four out of five Worker Issues outperform. Underperformance in Wages was driven by negative performance from both top and bottom decile companies.
Shown below are the top and bottom five contributors to the top decile (D1), the top-ranked companies as measured by their Workers score, and the bottom decile (D10), the lowest-ranked companies as measured by their Worker score.
The Communities stakeholder measures a company across four Issues:
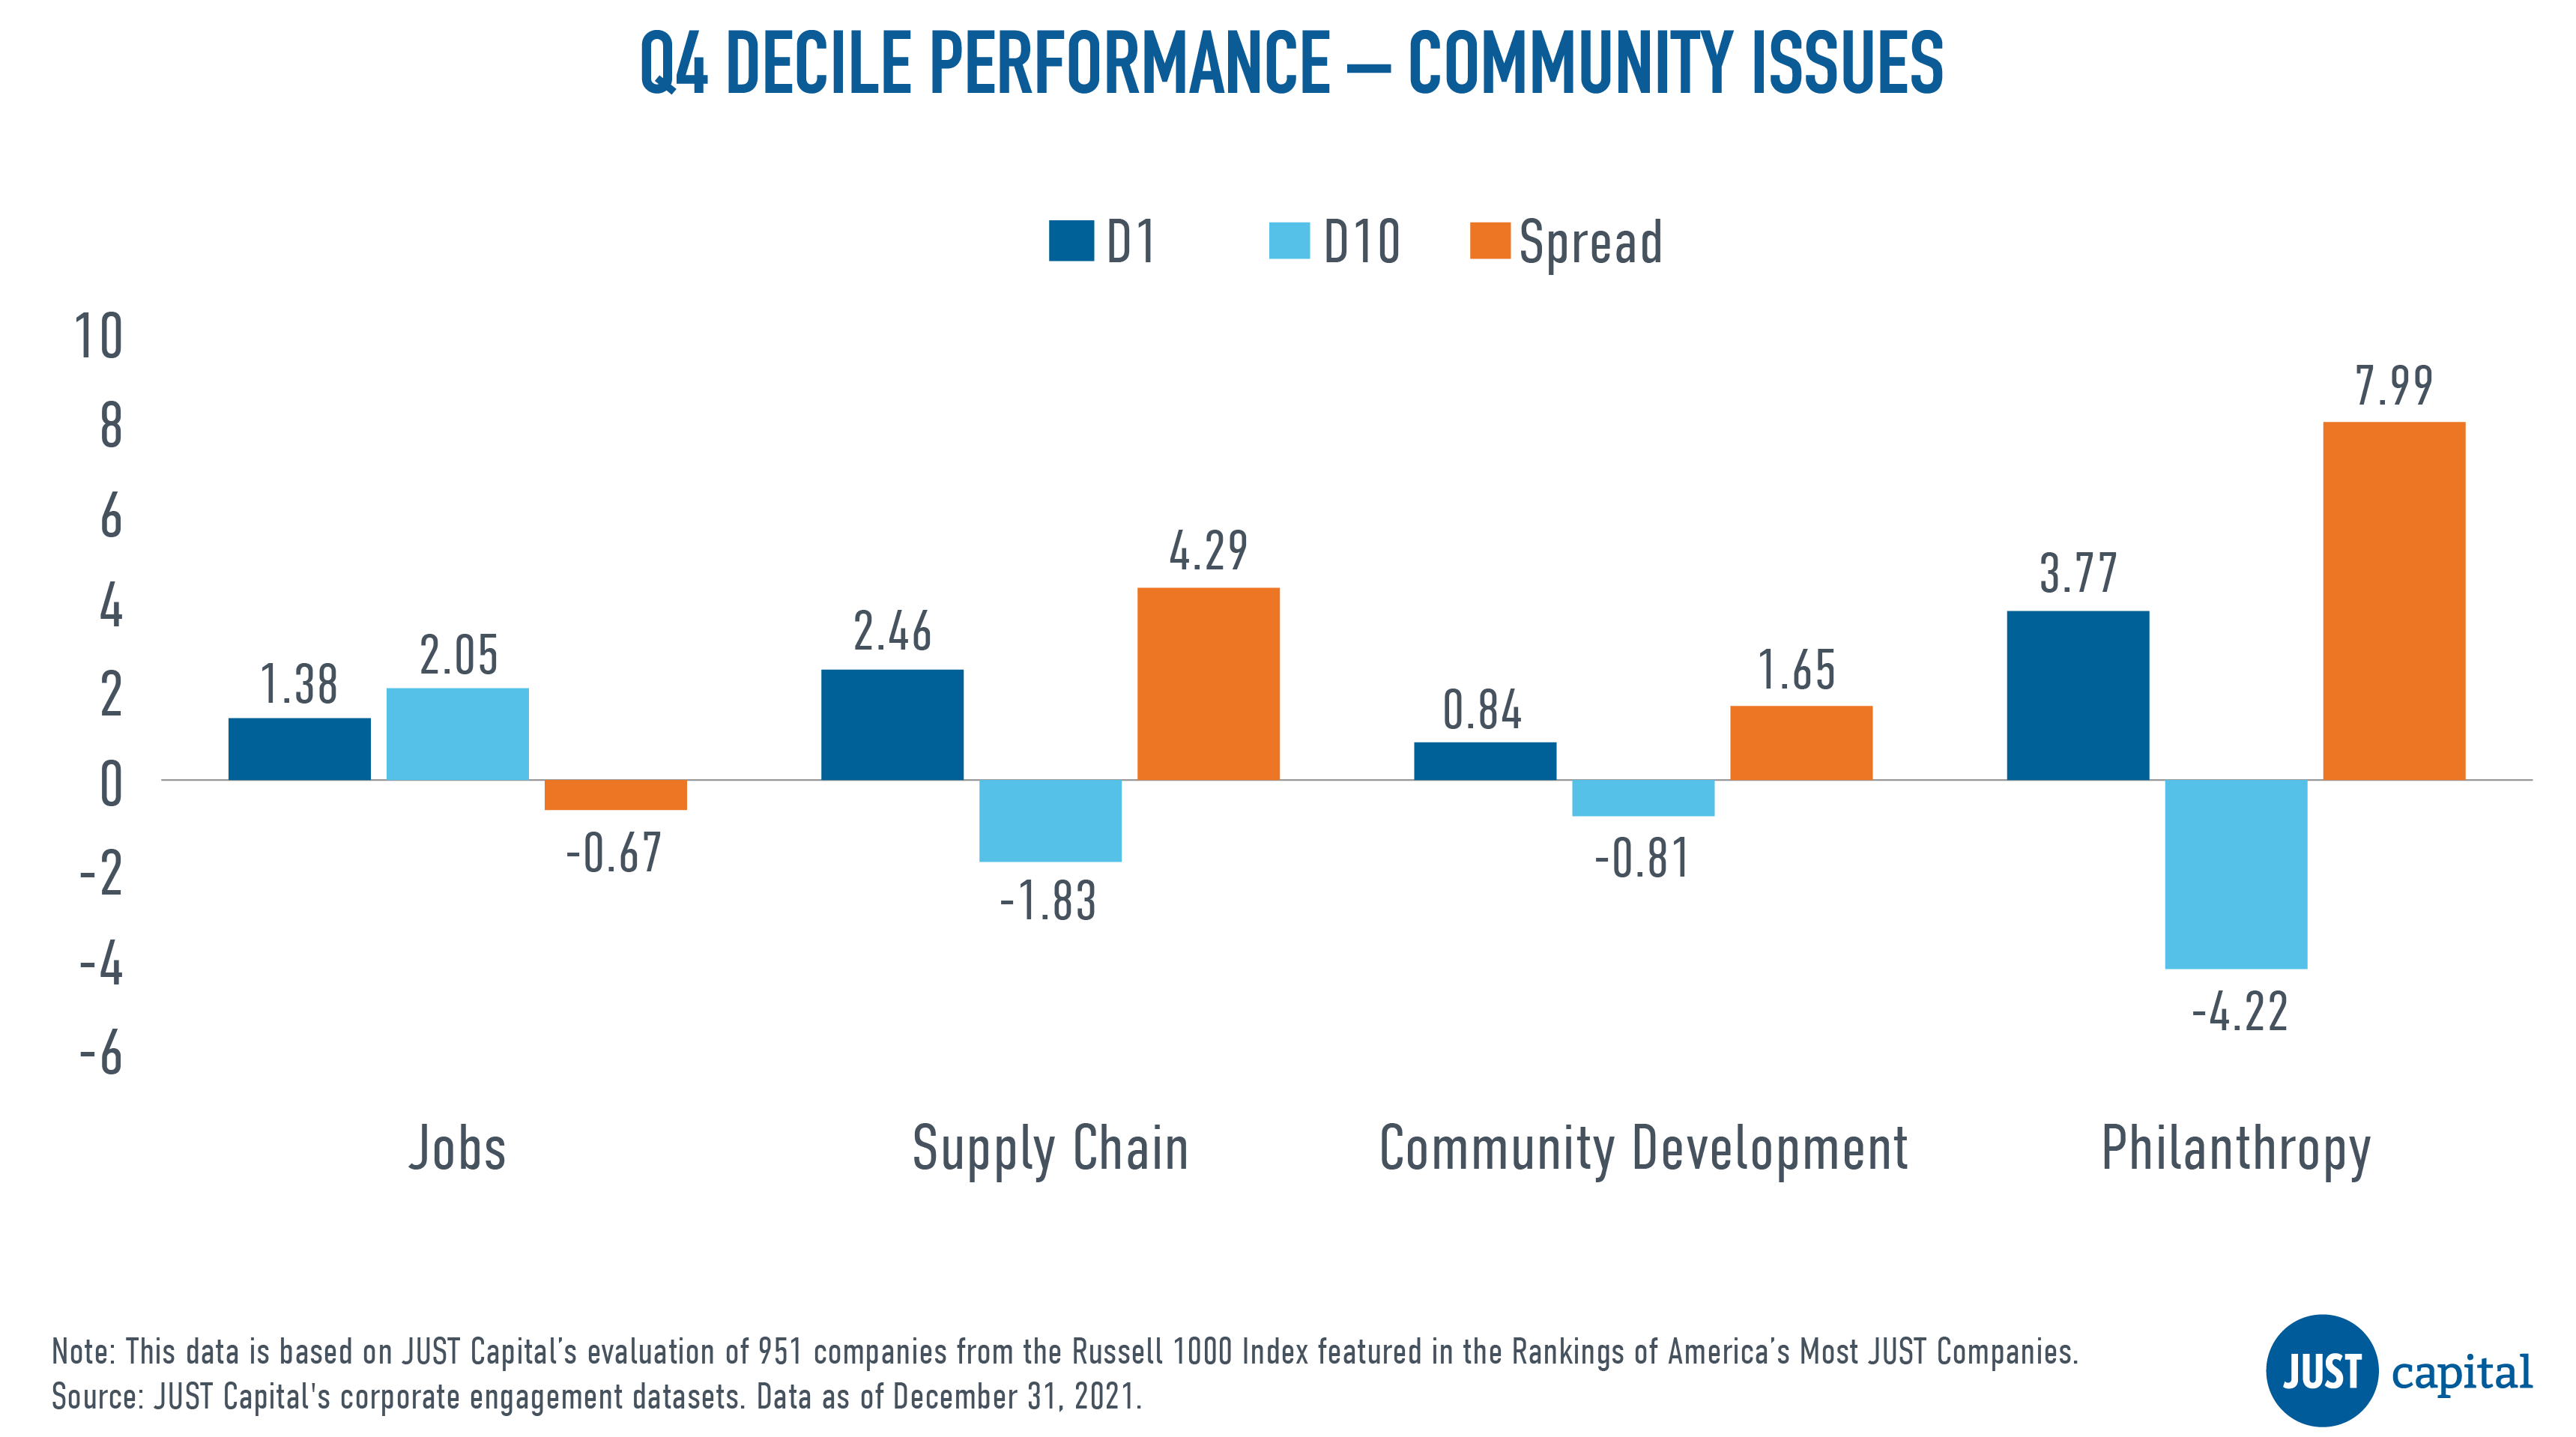
All issues with the exception of Jobs were positive contributors to the Communities stakeholder’s performance. Negative performance within Jobs was driven by the out-performance of bottom decile companies.
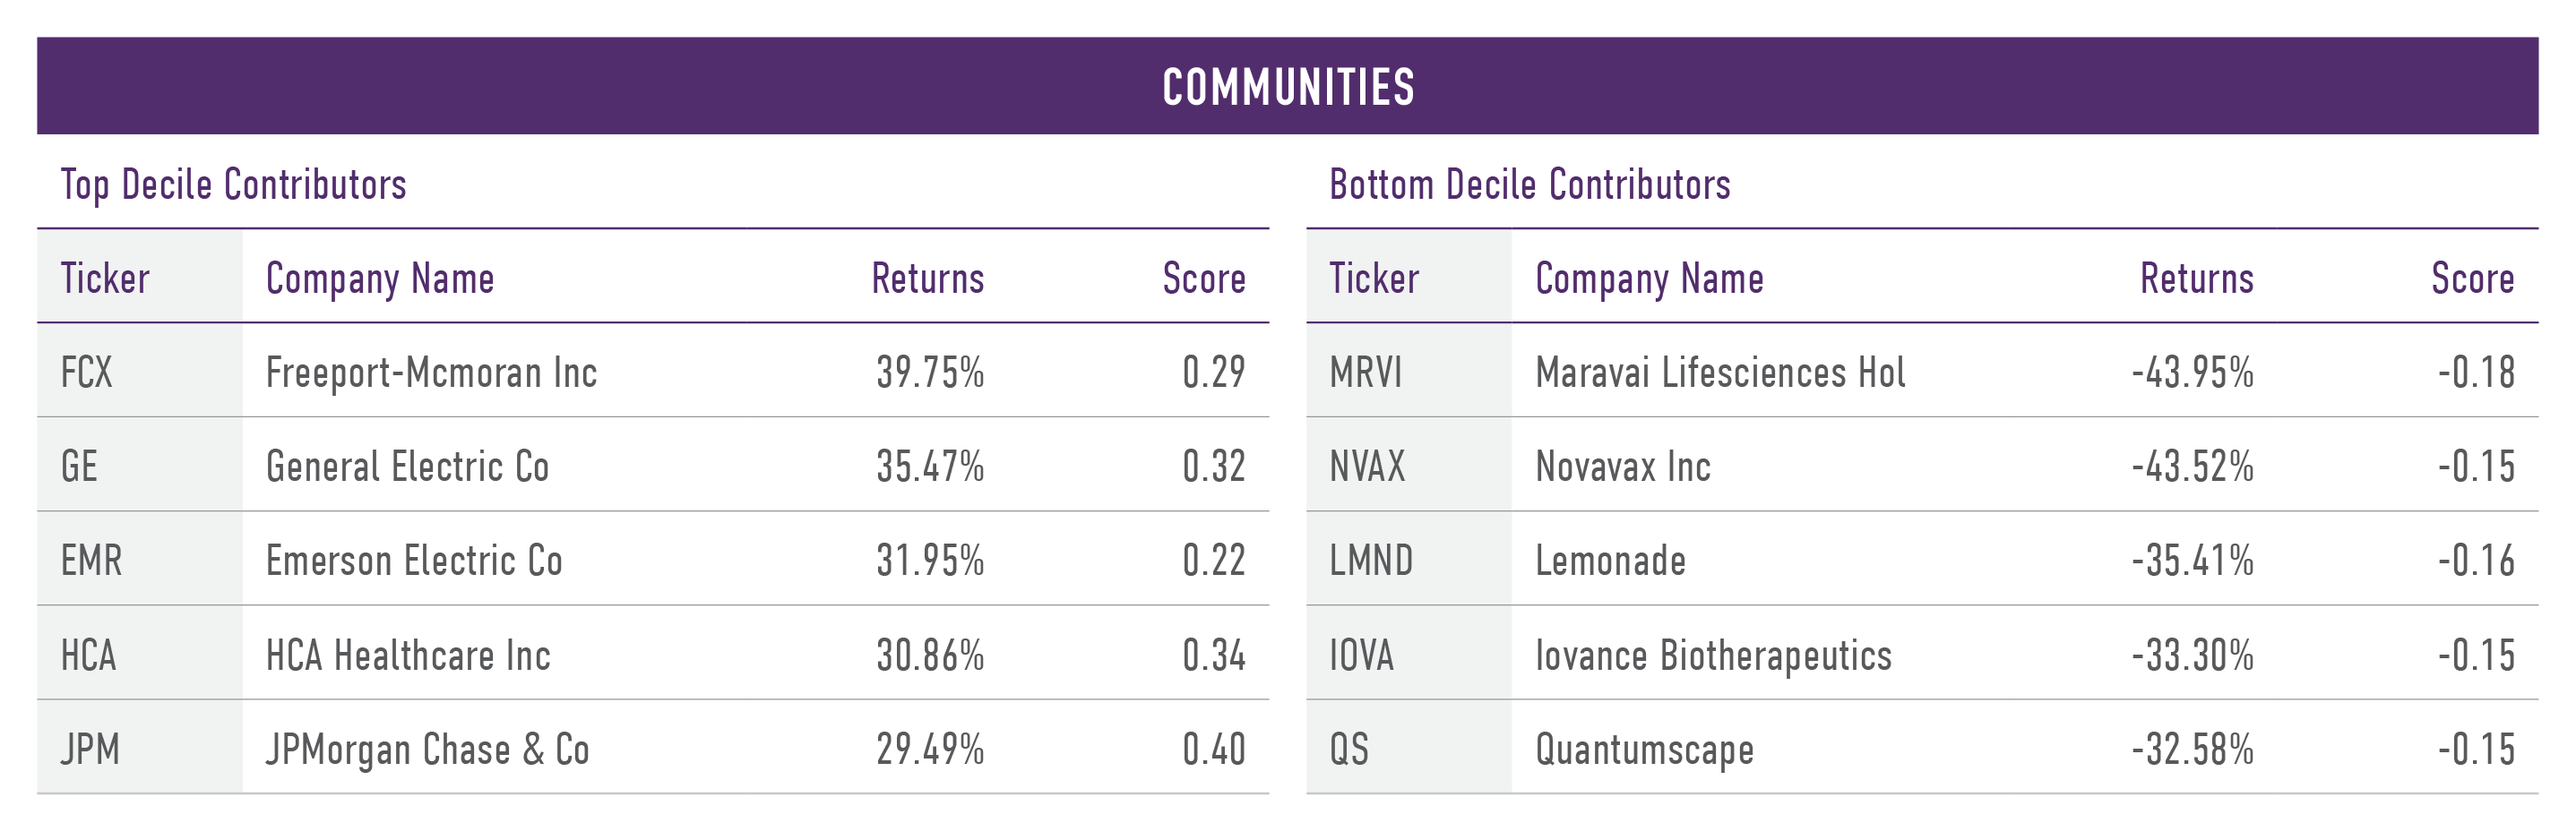
Shown below are the both top and bottom five contributors to the top decile (D1), the best-ranked companies as measured by their Communities score, and the bottom decile (D10), the worst-ranked companies as measured by their Communities score.
The Shareholders and Governance stakeholder measures a company across three Issues:
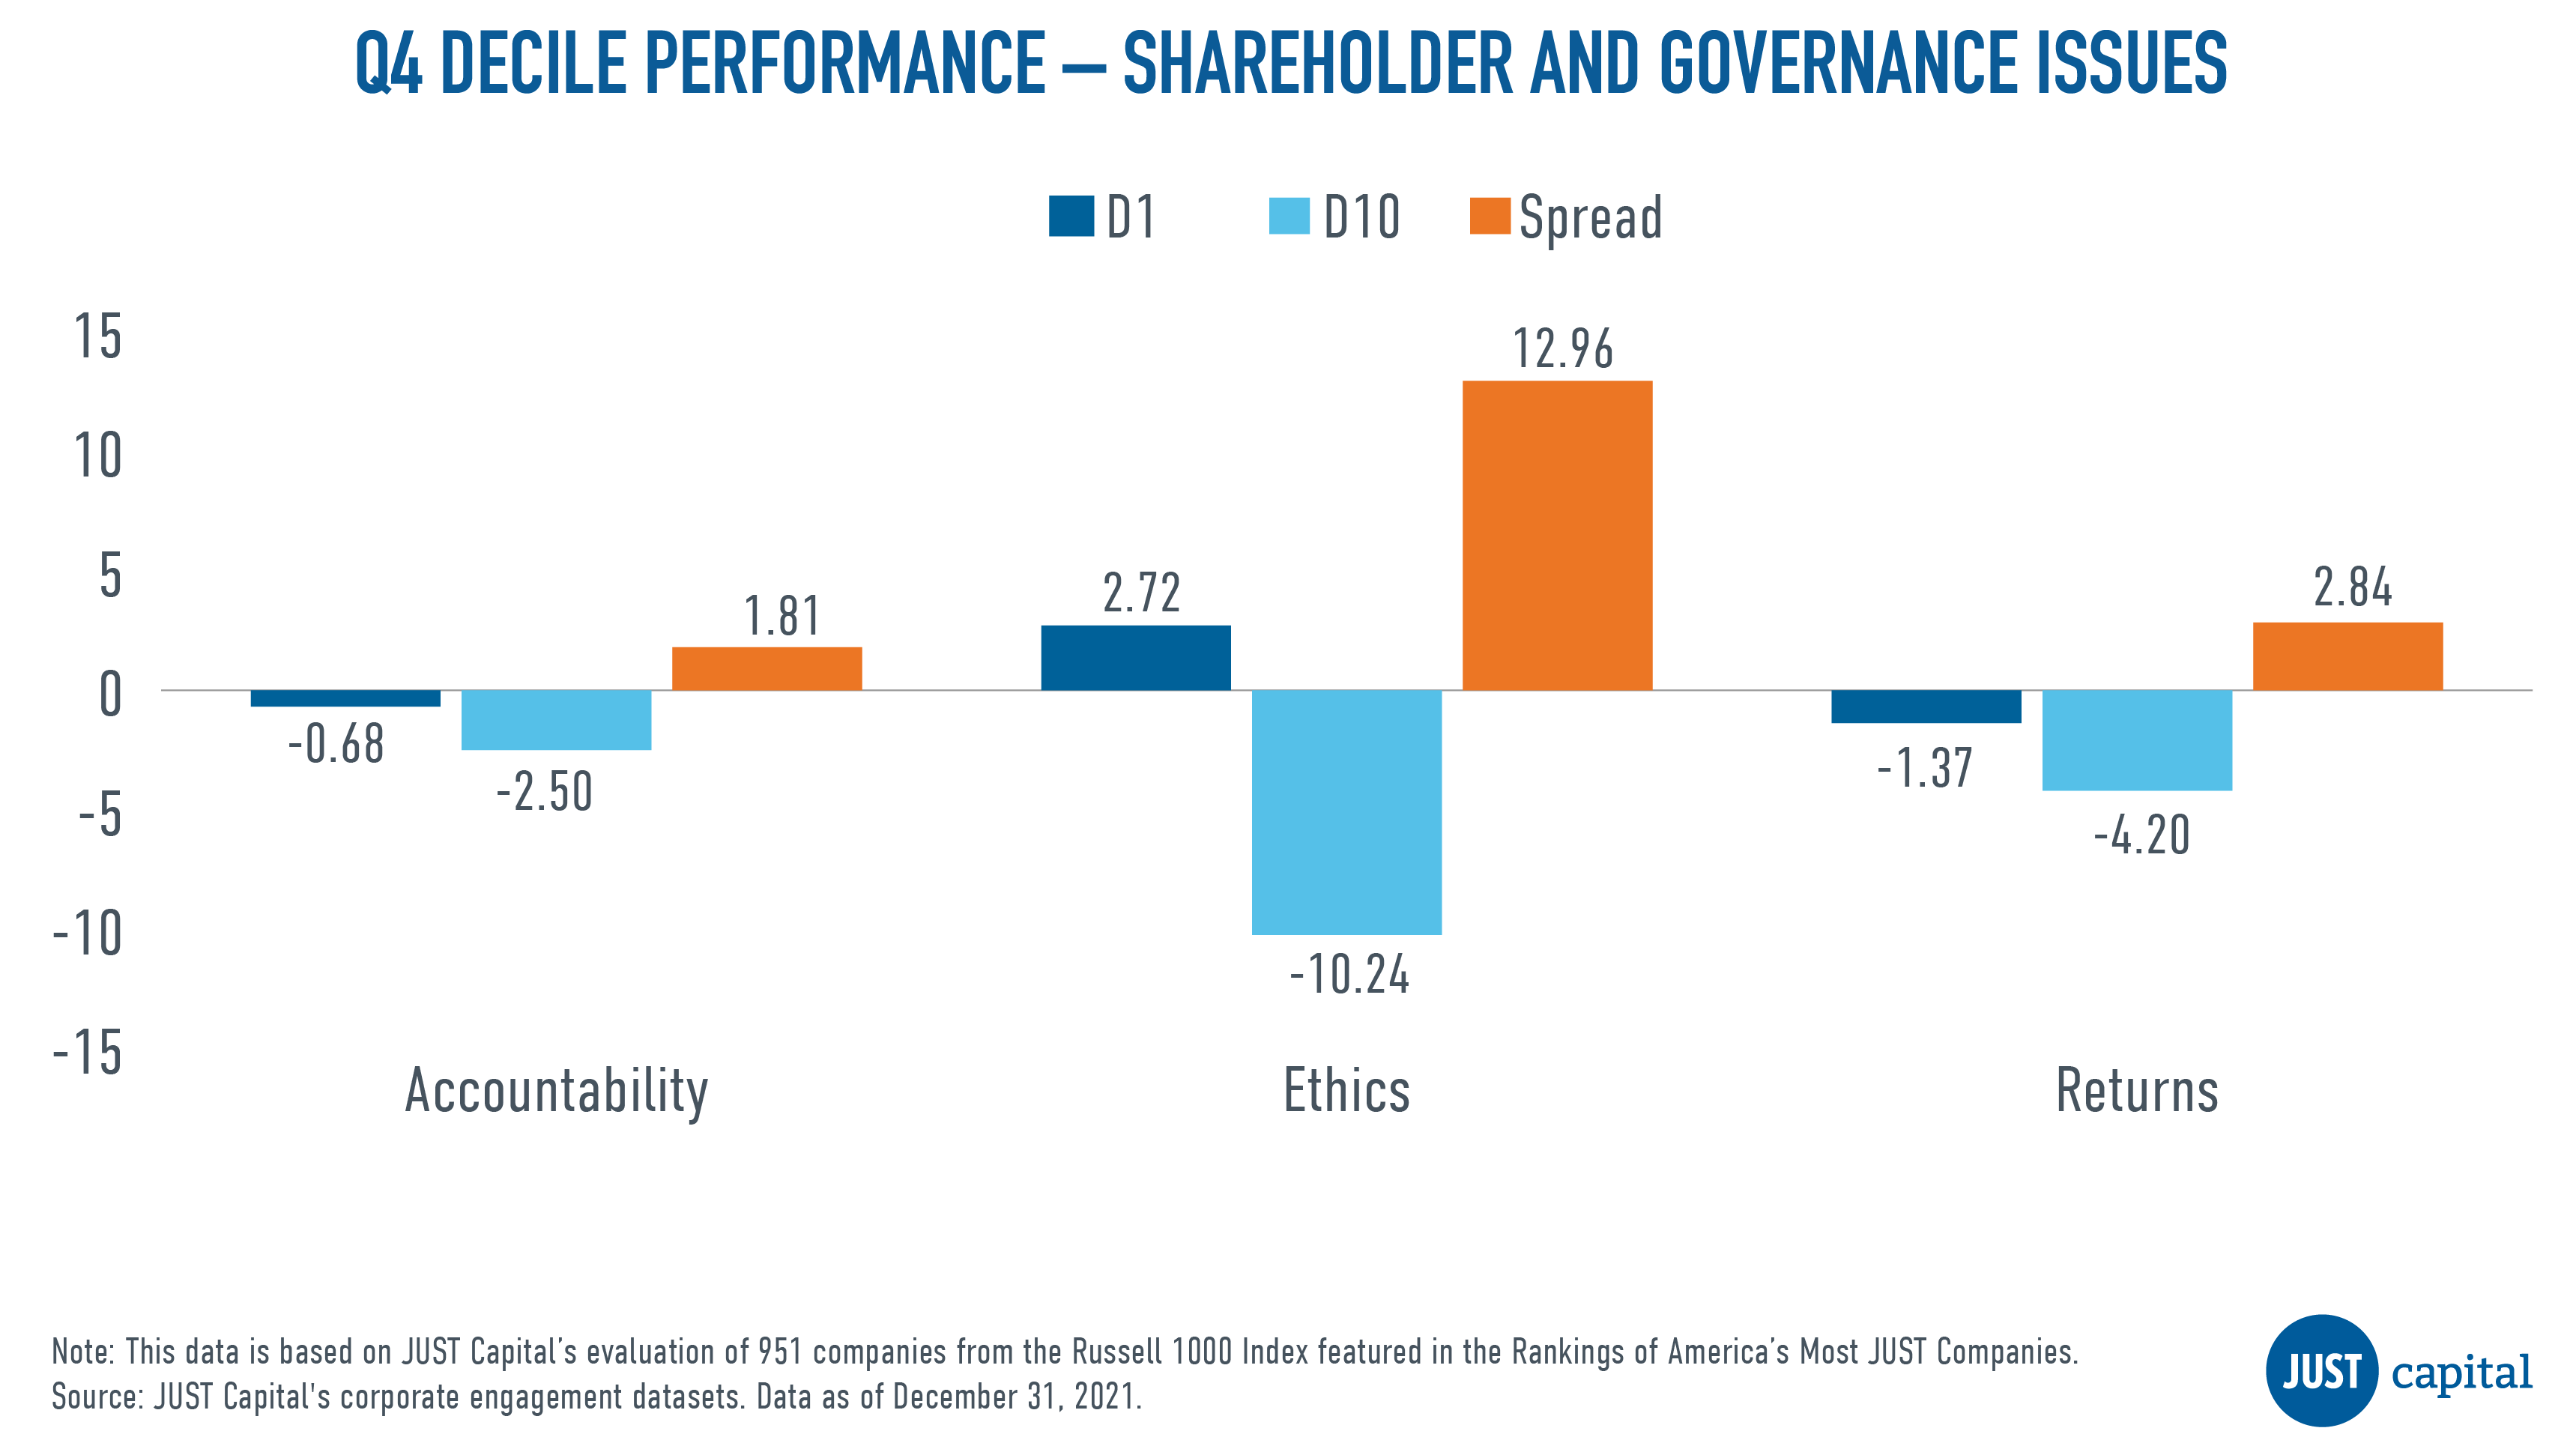
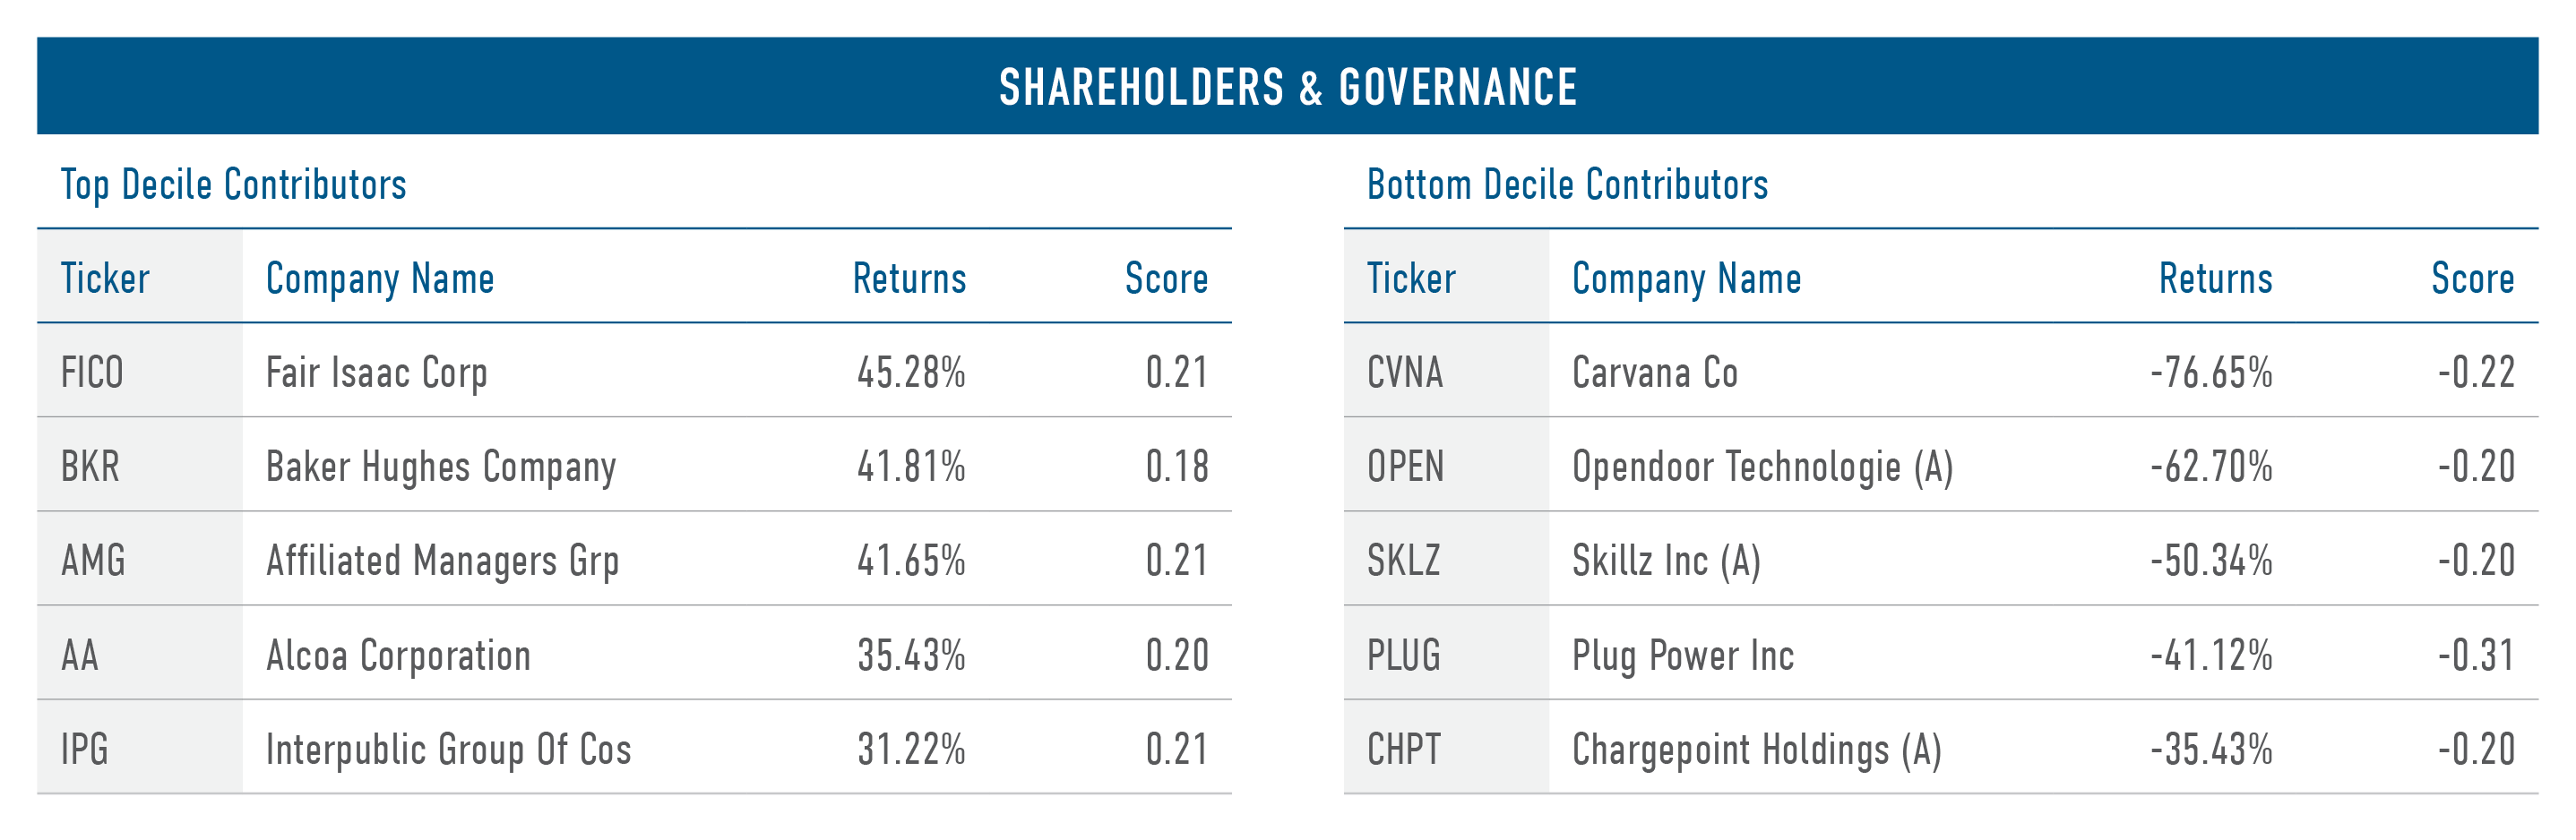
In Q4 we saw all the Shareholder and Governance issues outperform, with Ethics being the leader in performance driven primarily by the underperformance of bottom decile companies.
Shown below are the both top and bottom five contributors to the top decile (D1), the best-ranked companies as measured by their Shareholders and Governance score, and the bottom decile (D10), the worst-ranked companies as measured by their Shareholders and Governance score.
The Customers stakeholder measures a company across four Issues:
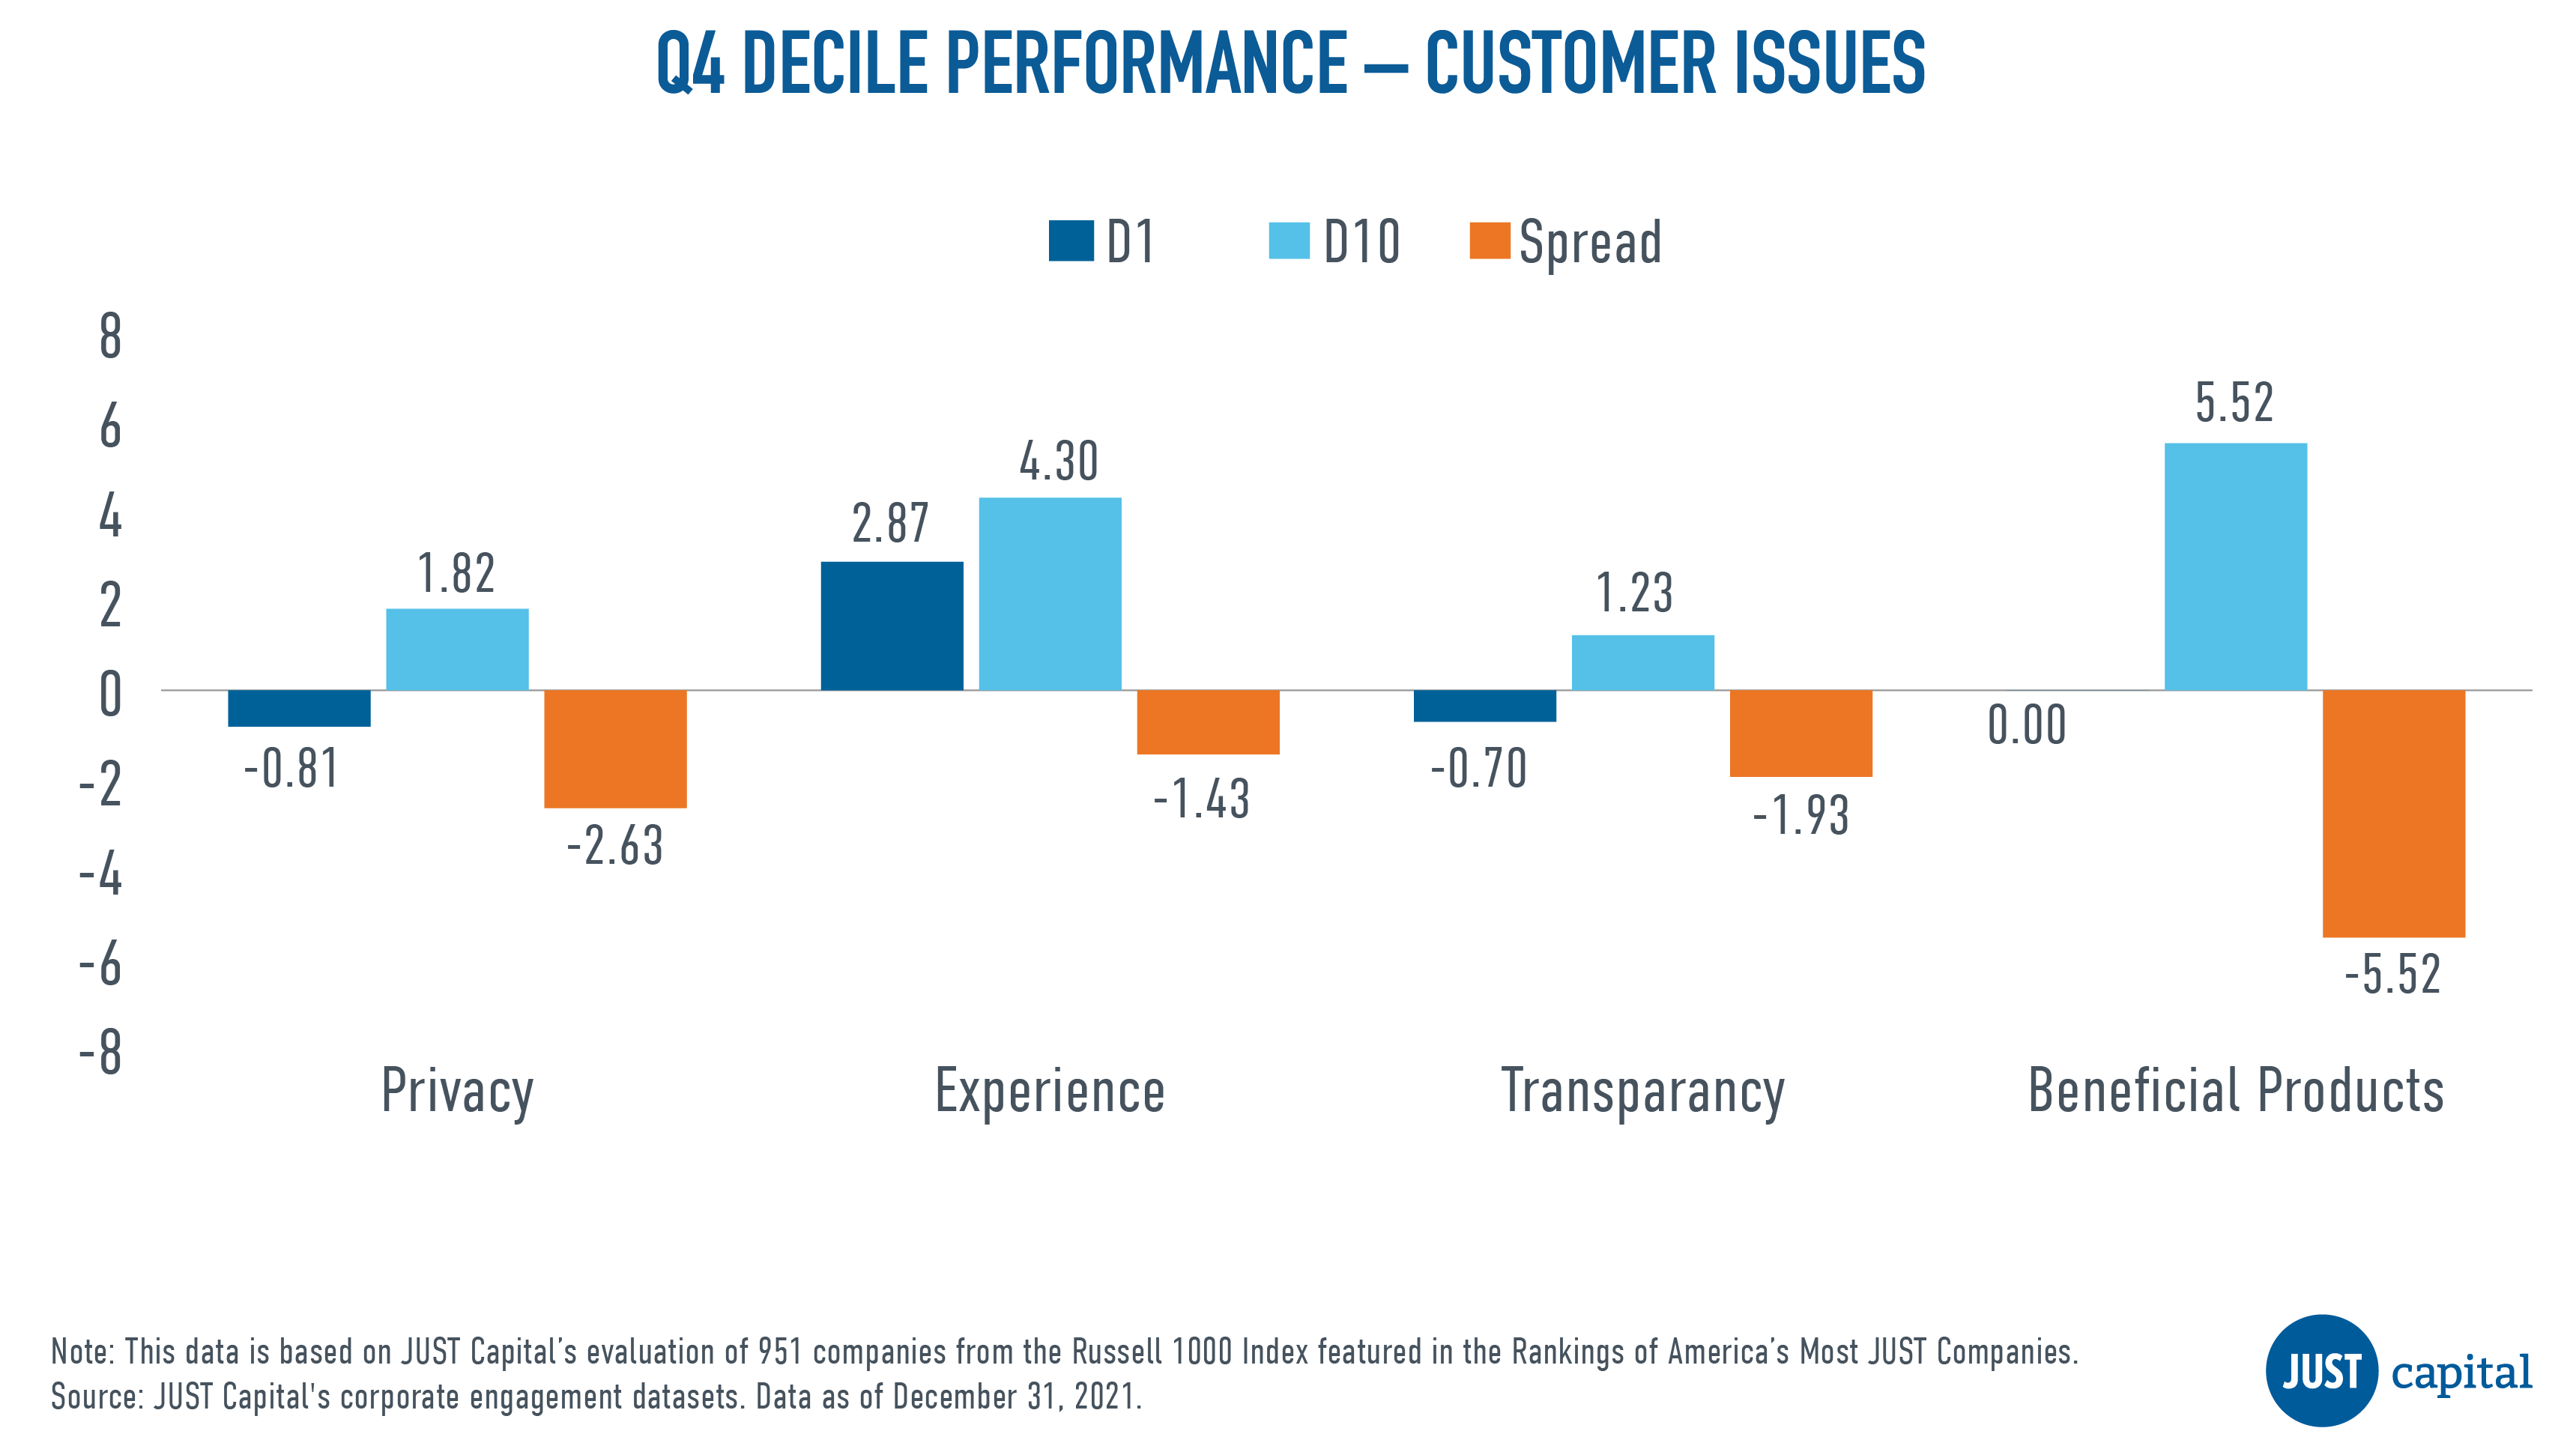
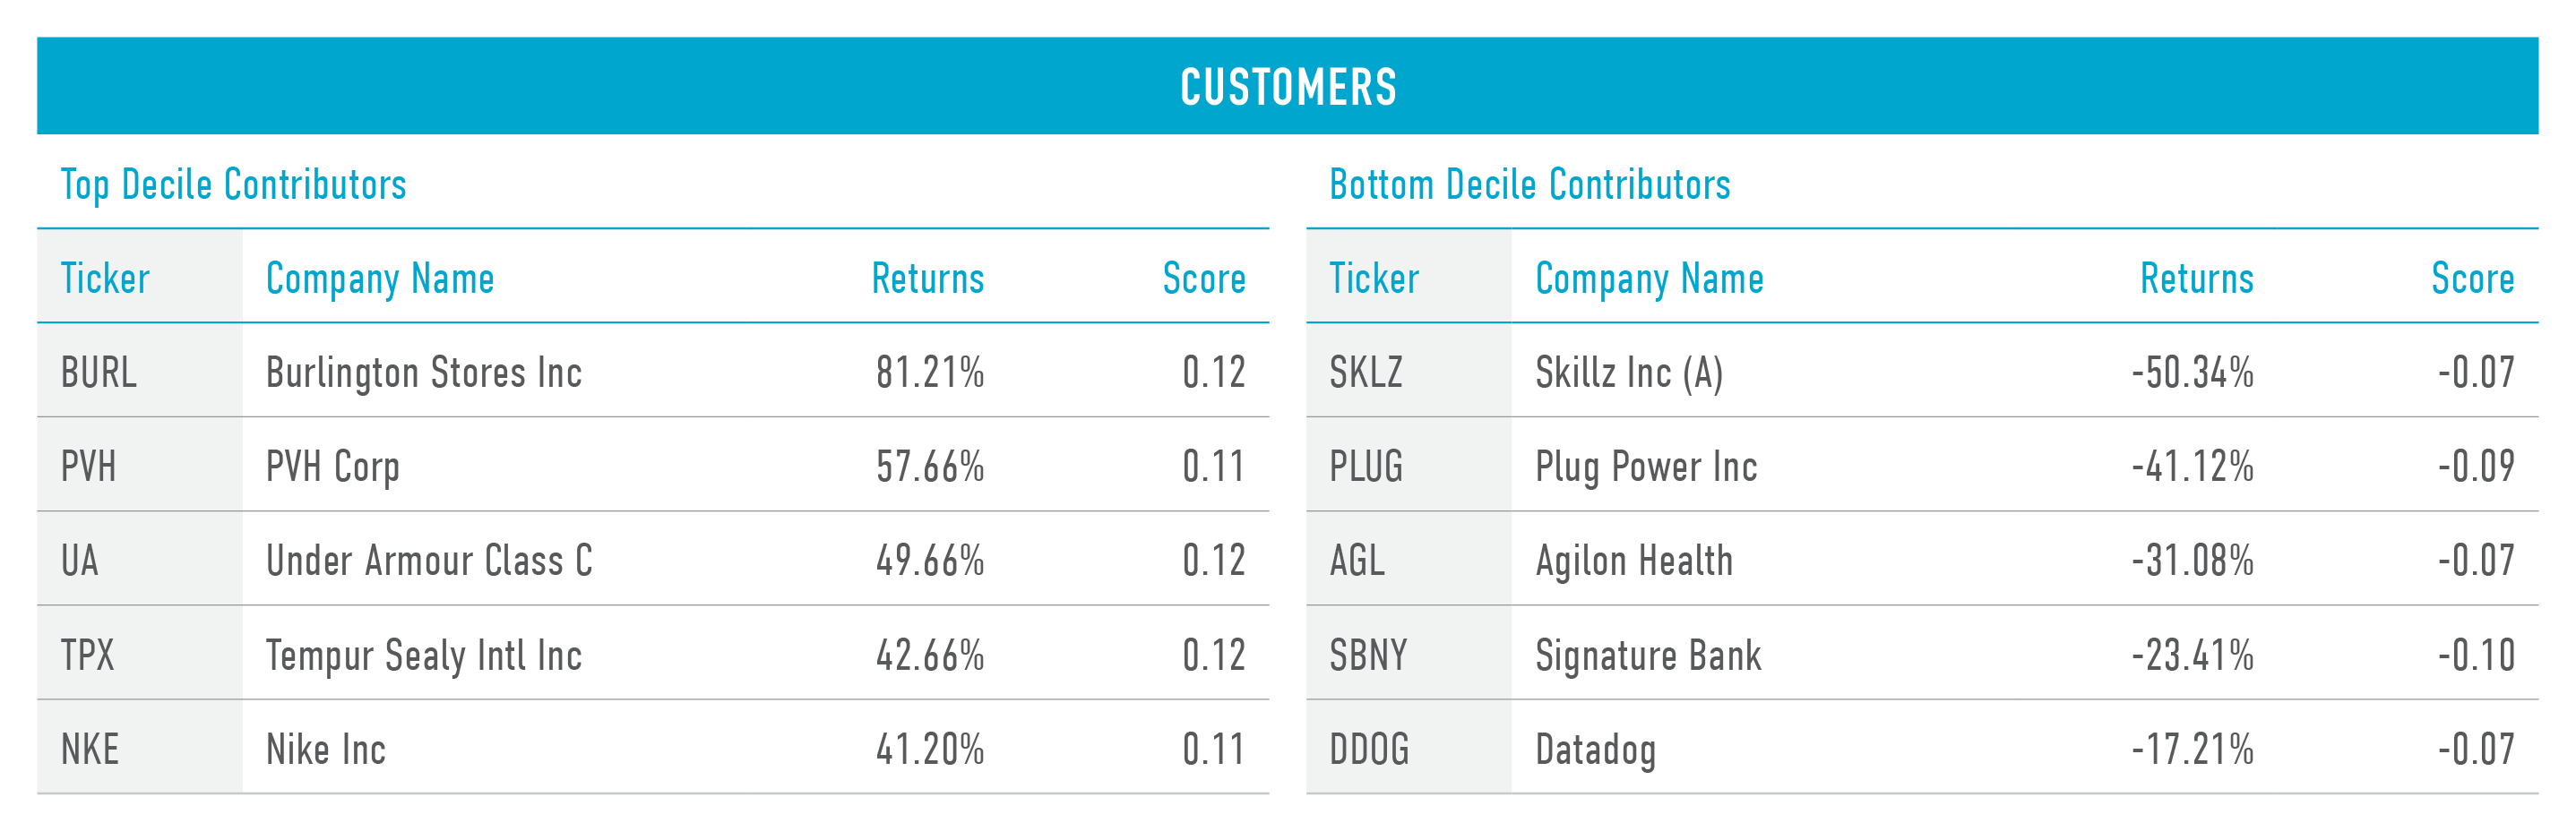
In Q4, we saw all Customer Issues underperform. The Beneficial Products issue was the biggest negative contributor to Customer performance.
Shown below are the both top and bottom five contributors to the top decile (D1), the best-ranked companies as measured by their Customer score, and the bottom decile (D10), the worst-ranked names as measured by Customer score).
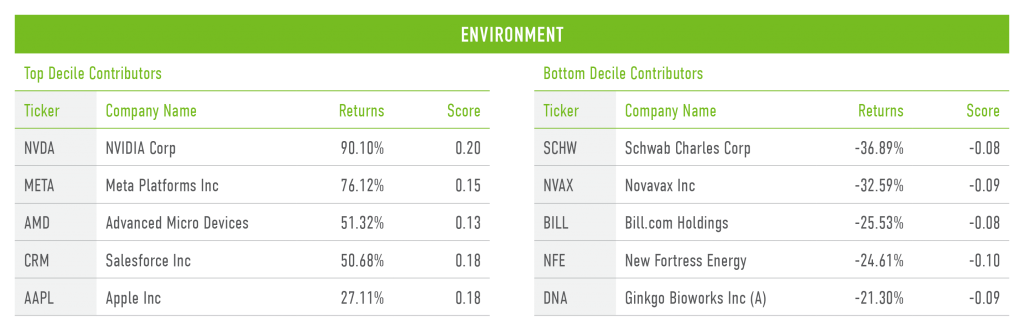
The Environment stakeholder measures a company across four Issues:
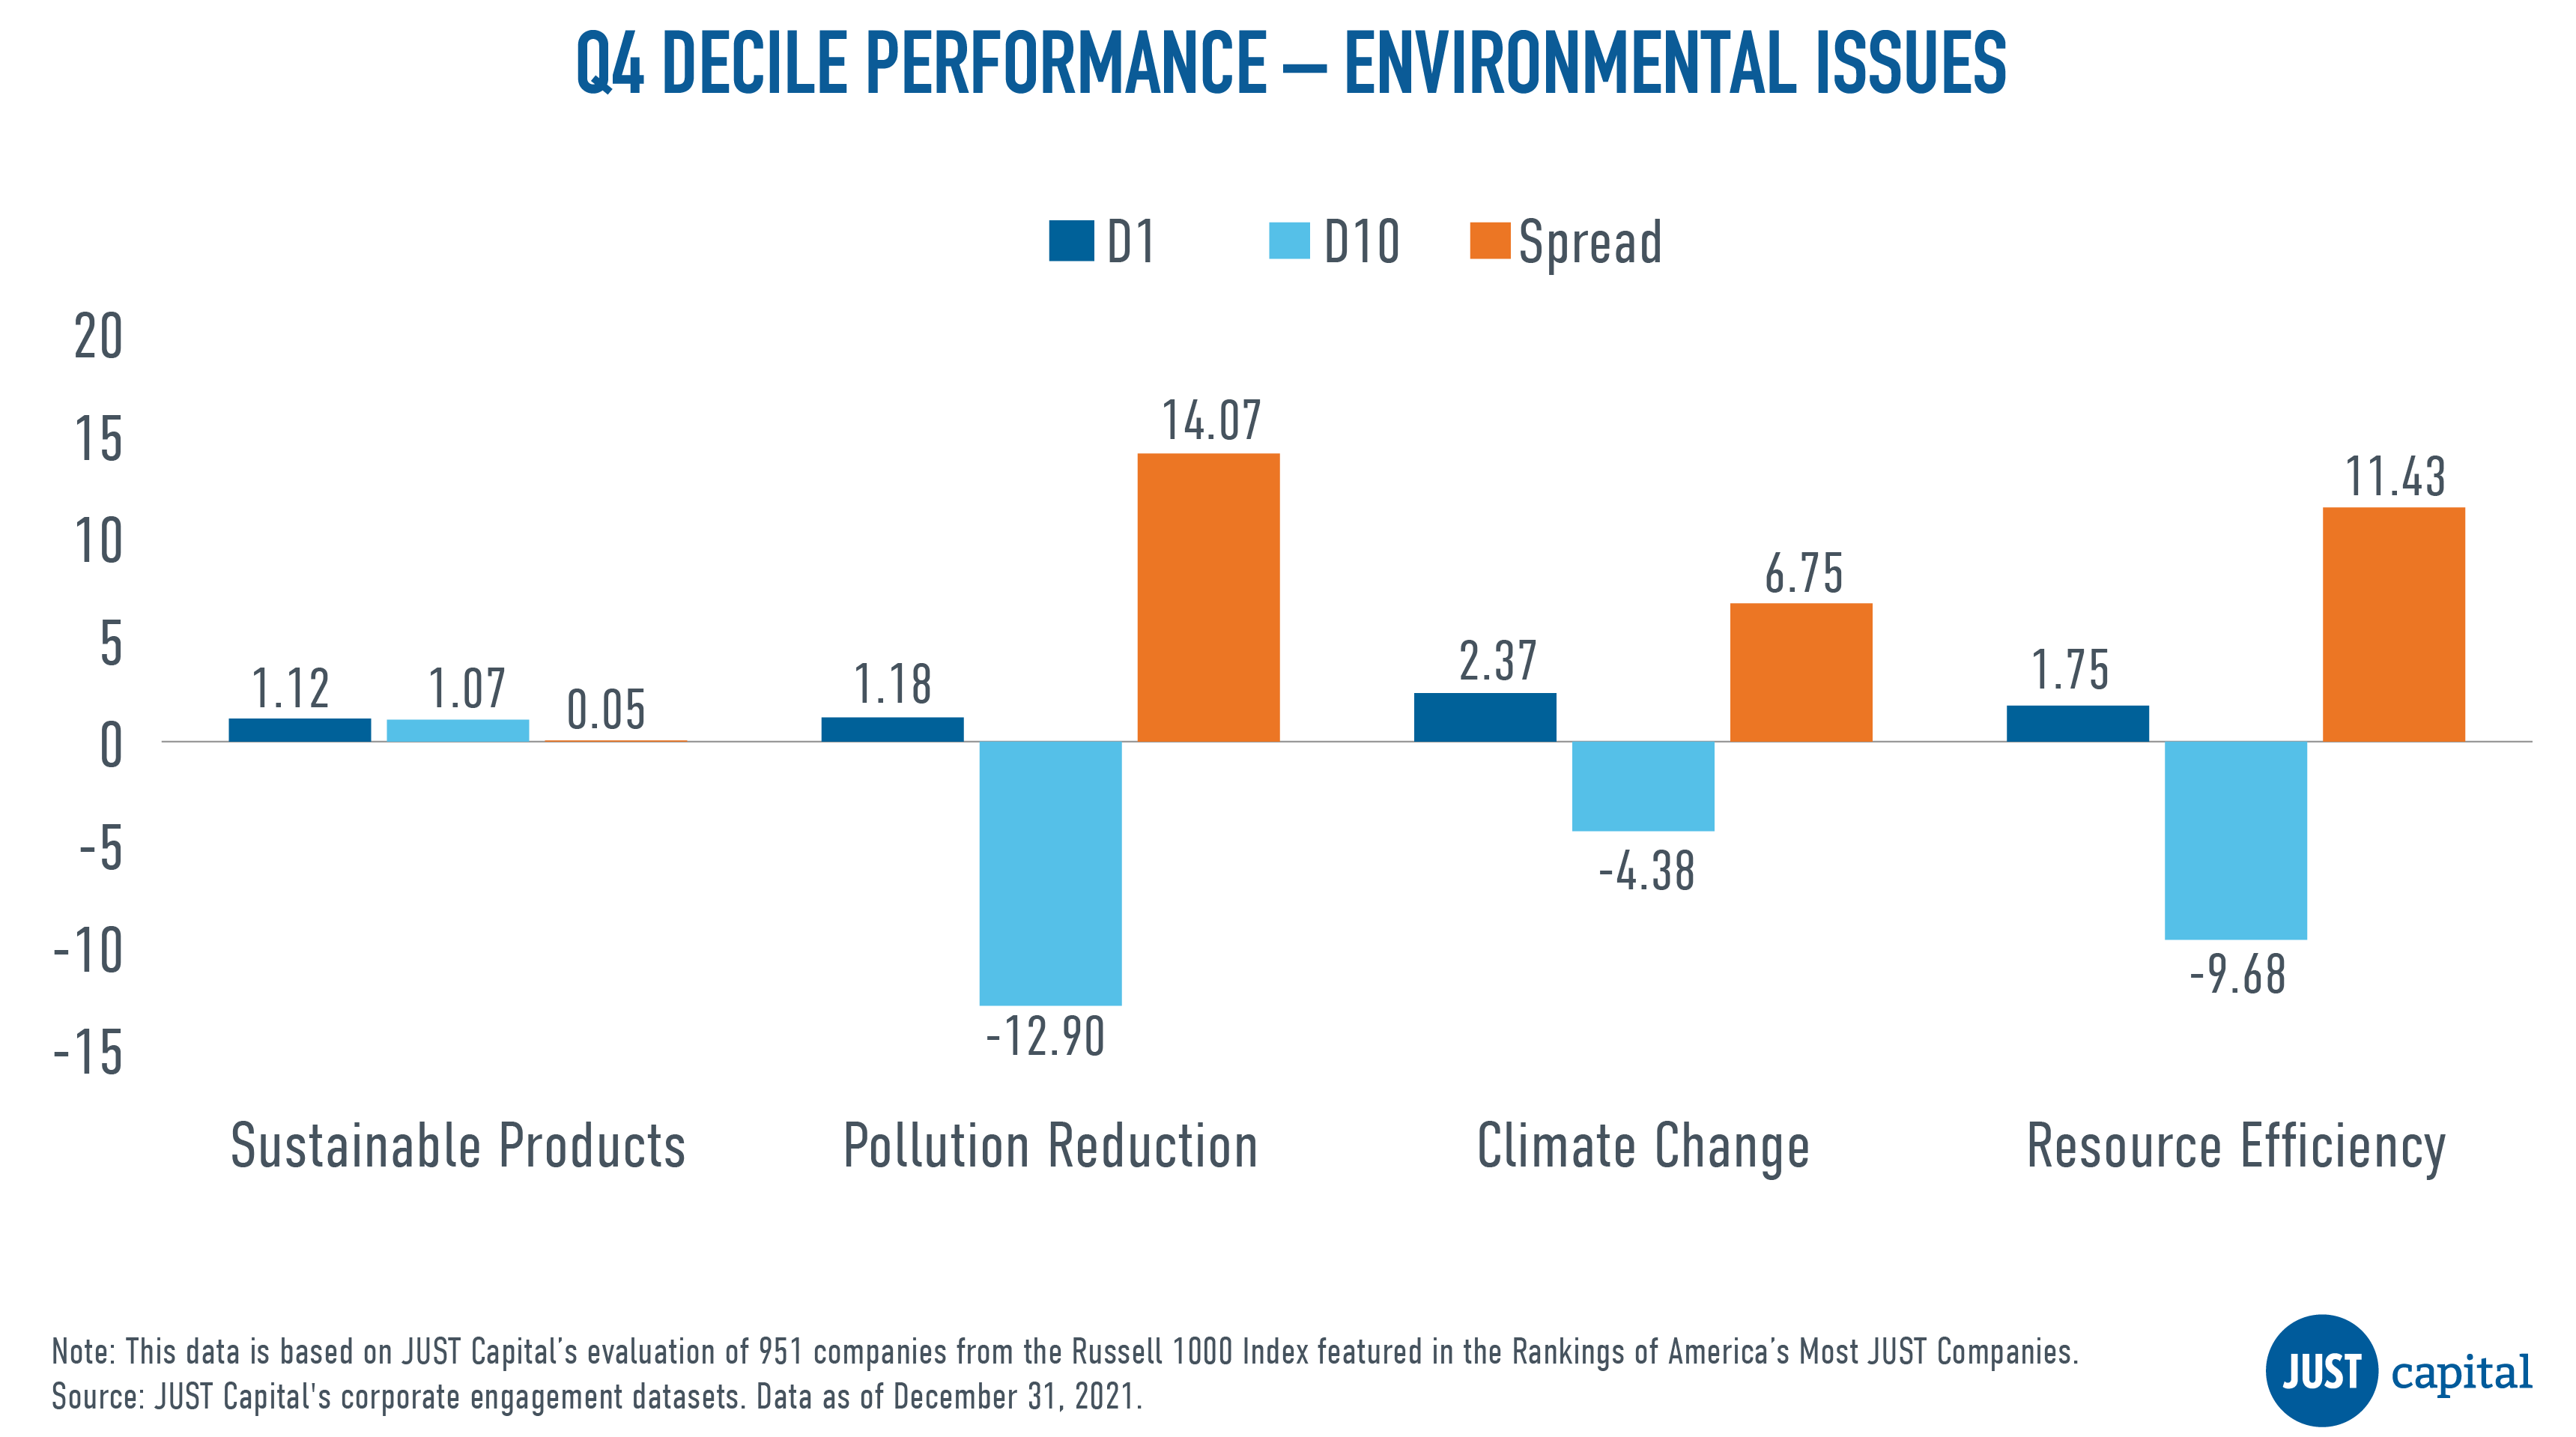
In Q3, we saw all the Environment Issues do well, with the Pollution Reduction Issue being the leader in performance amongst all the Issues in this quarter.
Shown below are the both top and bottom five contributors to the top decile (D1), the best-ranked companies as measured by their Environmental score, and the bottom decile (D10), the worst-ranked companies as measured by their Environmental score.
Computation Methodology
We monitor the performance of these stakeholders and Issues on a long-short basis. The long and short portfolios are selected based on the factor scores as the top and bottom deciles within the universe of companies we track in the Russell 1000. Top decile (D1) companies are those that rank highest based on the factor score, and bottom decile (D10) companies are those that rank lowest based on the factor score.
D1 Performance is computed as:
(Equally weighted average of returns of stocks in D1 bucket) – (Equally weighted average of returns of all stocks within the Universe)
D10 Performance is computed as:
(Equally weighted average of returns of stocks in D10 bucket) – (Equally weighted average of returns of all stocks within the Universe)
Spread is computed as:
D1 Performance – D10 Performance
November 1, 2022
Report by Director of Quantitative Research & Analytics Mona Patni.
Markets remained very volatile in Q3 2022. Global markets fell in the third quarter as inflation remained near multi-decade highs, geopolitical tensions escalated, and the Federal Reserve reaffirmed its commitment to raising interest rates to fight inflation. The Russell 1000 index after a rally in July returned -4.6% in Q3 after FOMC meeting minutes and Fed member speeches stoked fears the Fed could tighten too much and push the economy into recession. With respect to sector performance, the communication services sector was the worst performing sector over the quarter, along with real estate. The consumer discretionary was the best performing sector followed by energy.
During this challenging period, Just Capital found that two of the five stakeholders we track delivered positive performance, with the exception of the Environment, Customers and Shareholders. The Workers stakeholder delivered the best performance over this period with a long-short spread of 2.05%. Within the Environment and Customers stakeholders, underperformance was driven by both deciles, with the top decile underperforming and bottom decile outperforming, and within the Shareholders stakeholder, underperformance was primarily driven by the bottom decile.
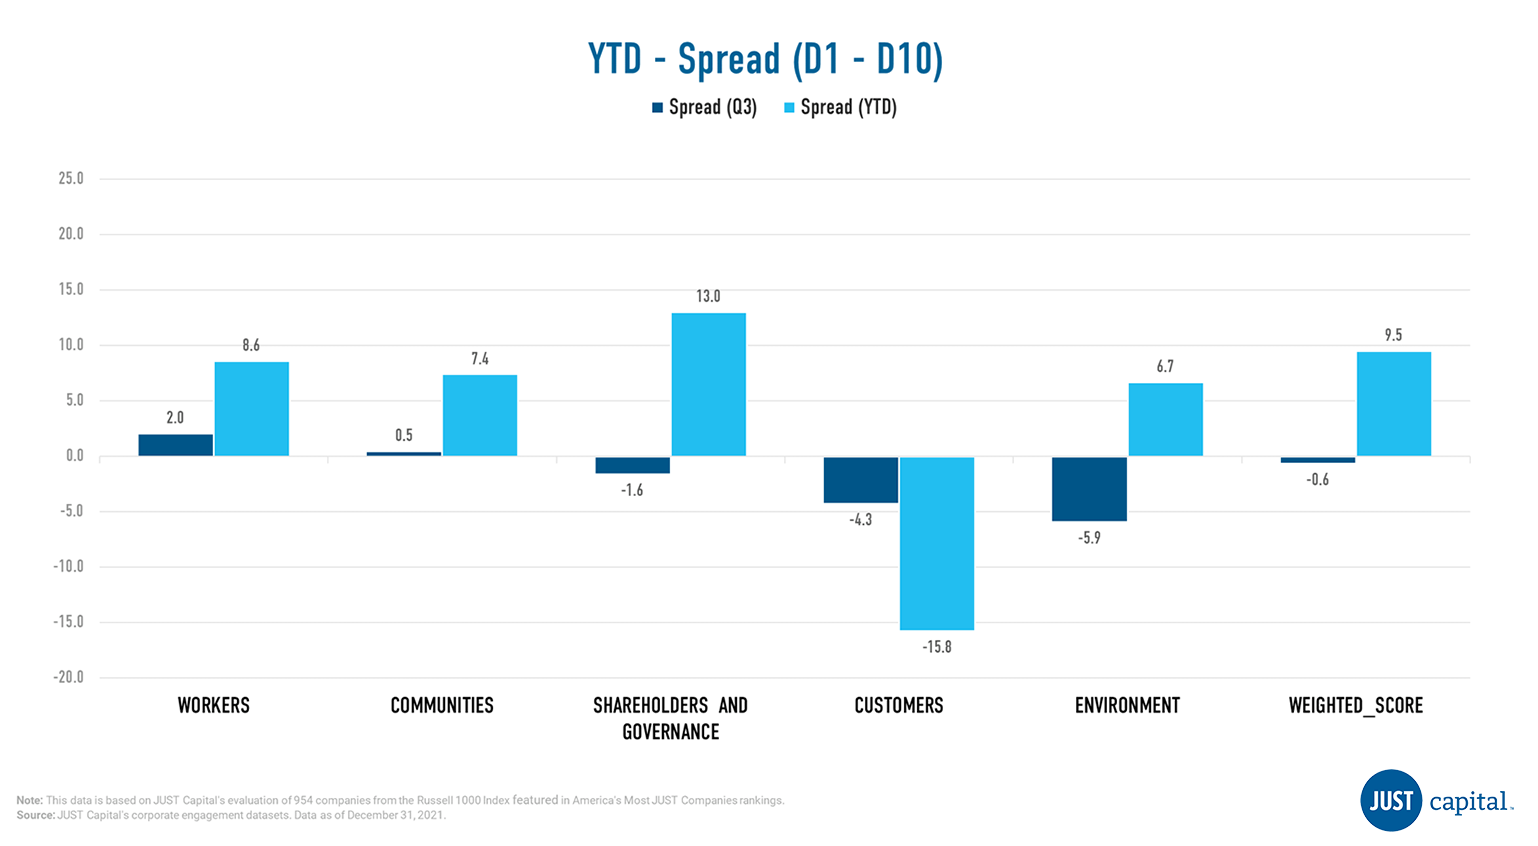
Just Capital’s Overall Weighted Score takes into account the 20 core Issues determined through our survey research – including paying a living wage, creating a diverse, inclusive workplace, and helping combat climate change – across key business stakeholders: Workers, Communities, Shareholders and Governance, Customers, and Environment. This Overall Weighted Score had a negative long-short spread of -0.64% over the period ending September 30, 2022.
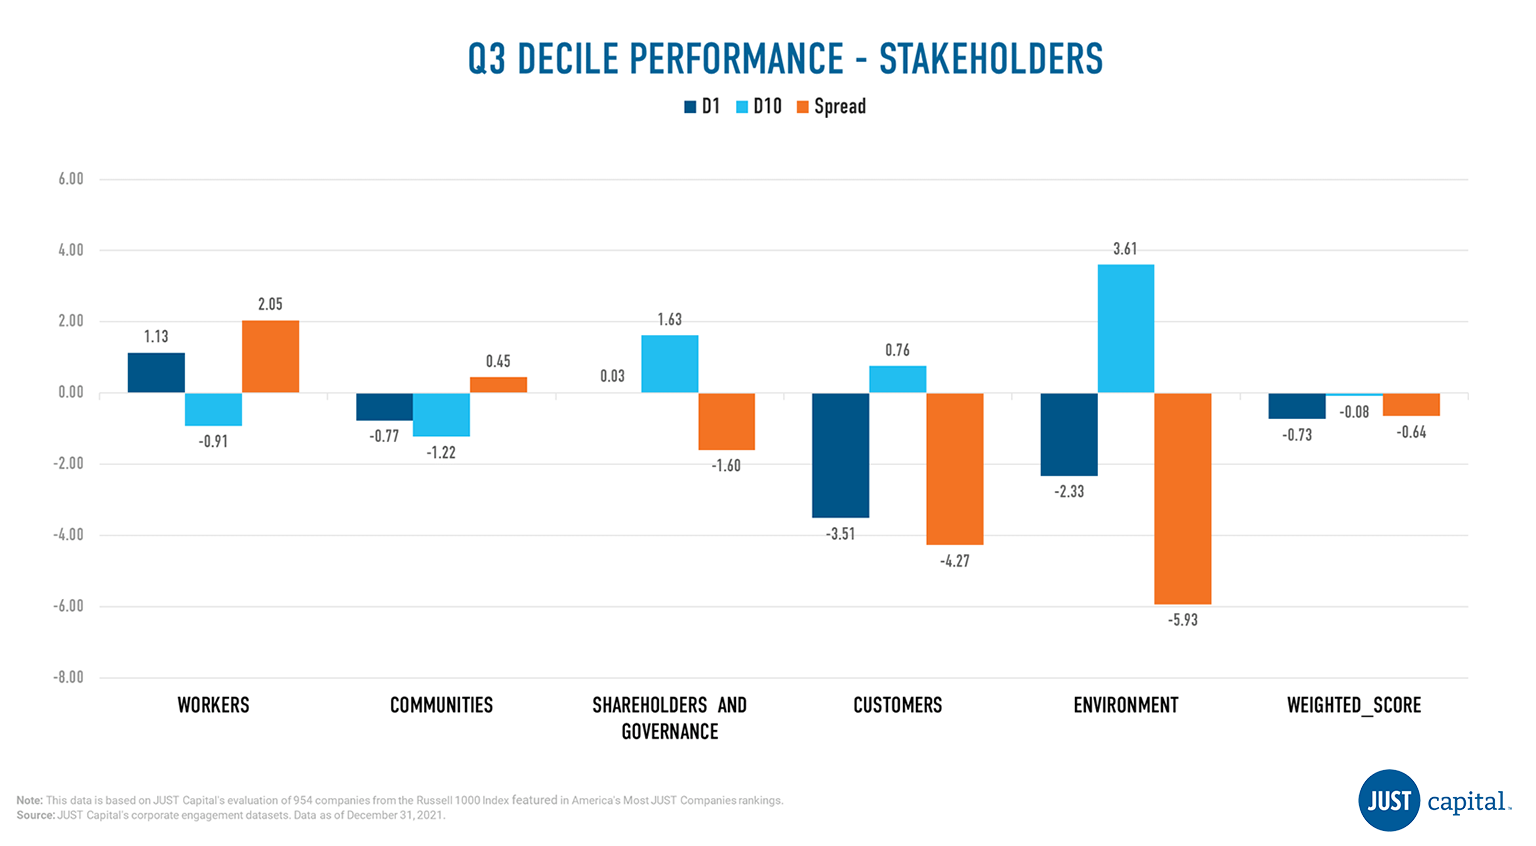
Shown below is the Year-to-Date (YTD) and Q3 performance, which is quantified by the spread between the top and bottom deciles of all the stakeholders and the overall weighted score.
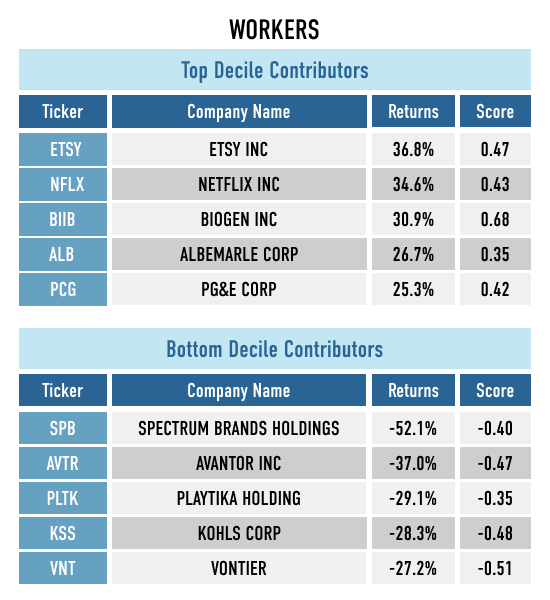
The Workers stakeholder measures a company across five Issues:
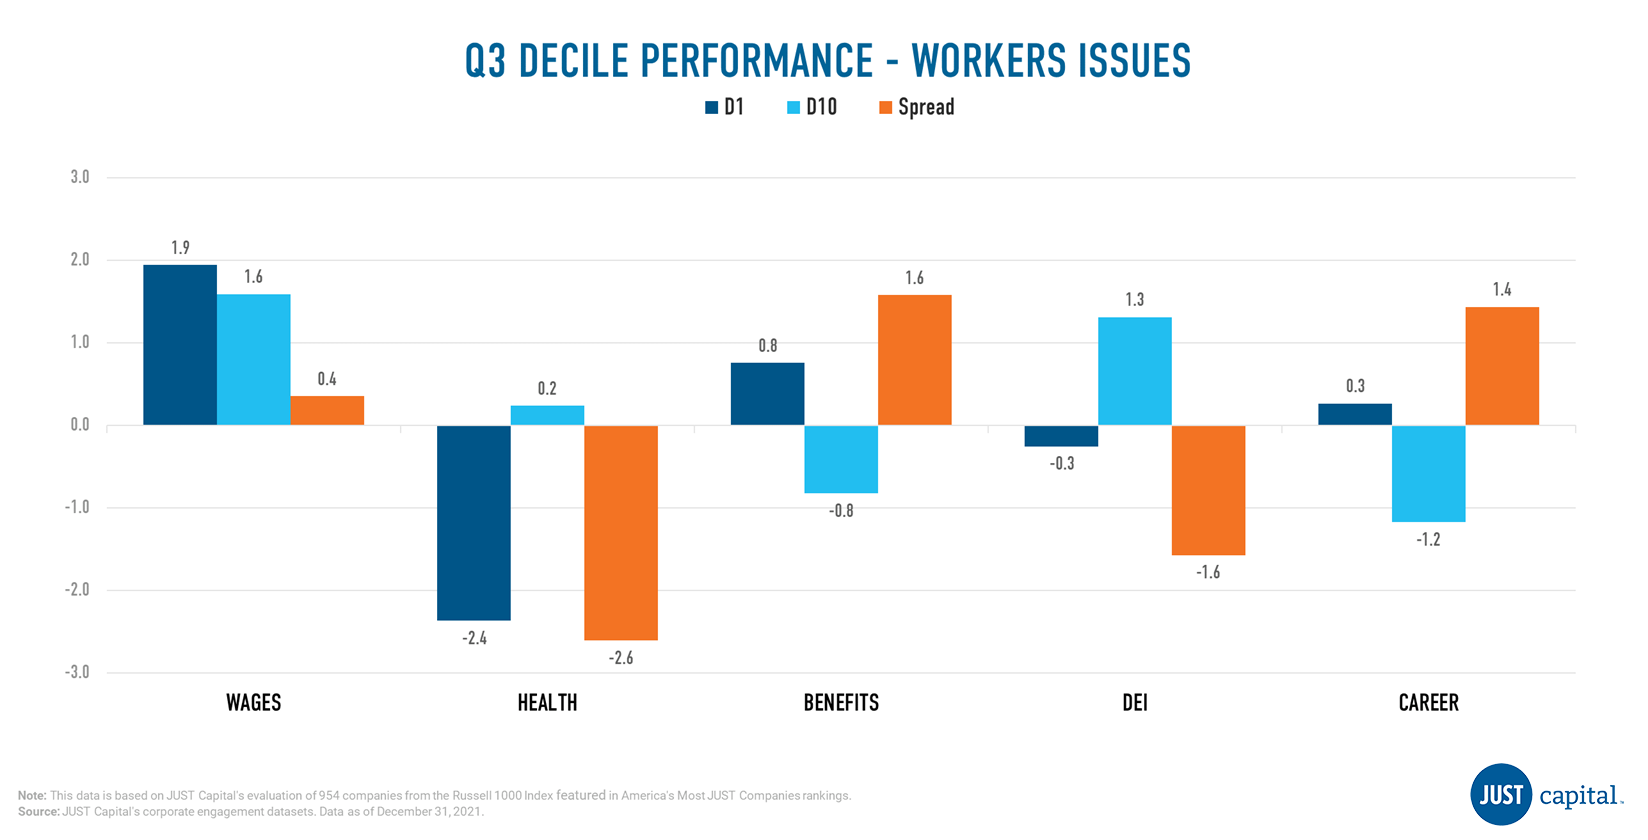
In Q3, we saw three out of five Worker Issues outperform. Underperformance in Health and DEI was driven by negative performance from both top and bottom decile companies.
Shown below are the top and bottom five contributors to the top decile (D1), the top-ranked companies as measured by their Workers score, and the bottom decile (D10), the lowest-ranked companies as measured by their Worker score.
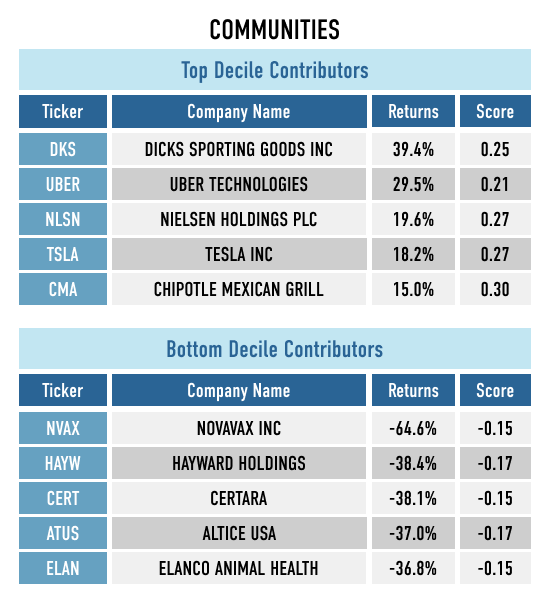
The Communities stakeholder measures a company across four Issues:
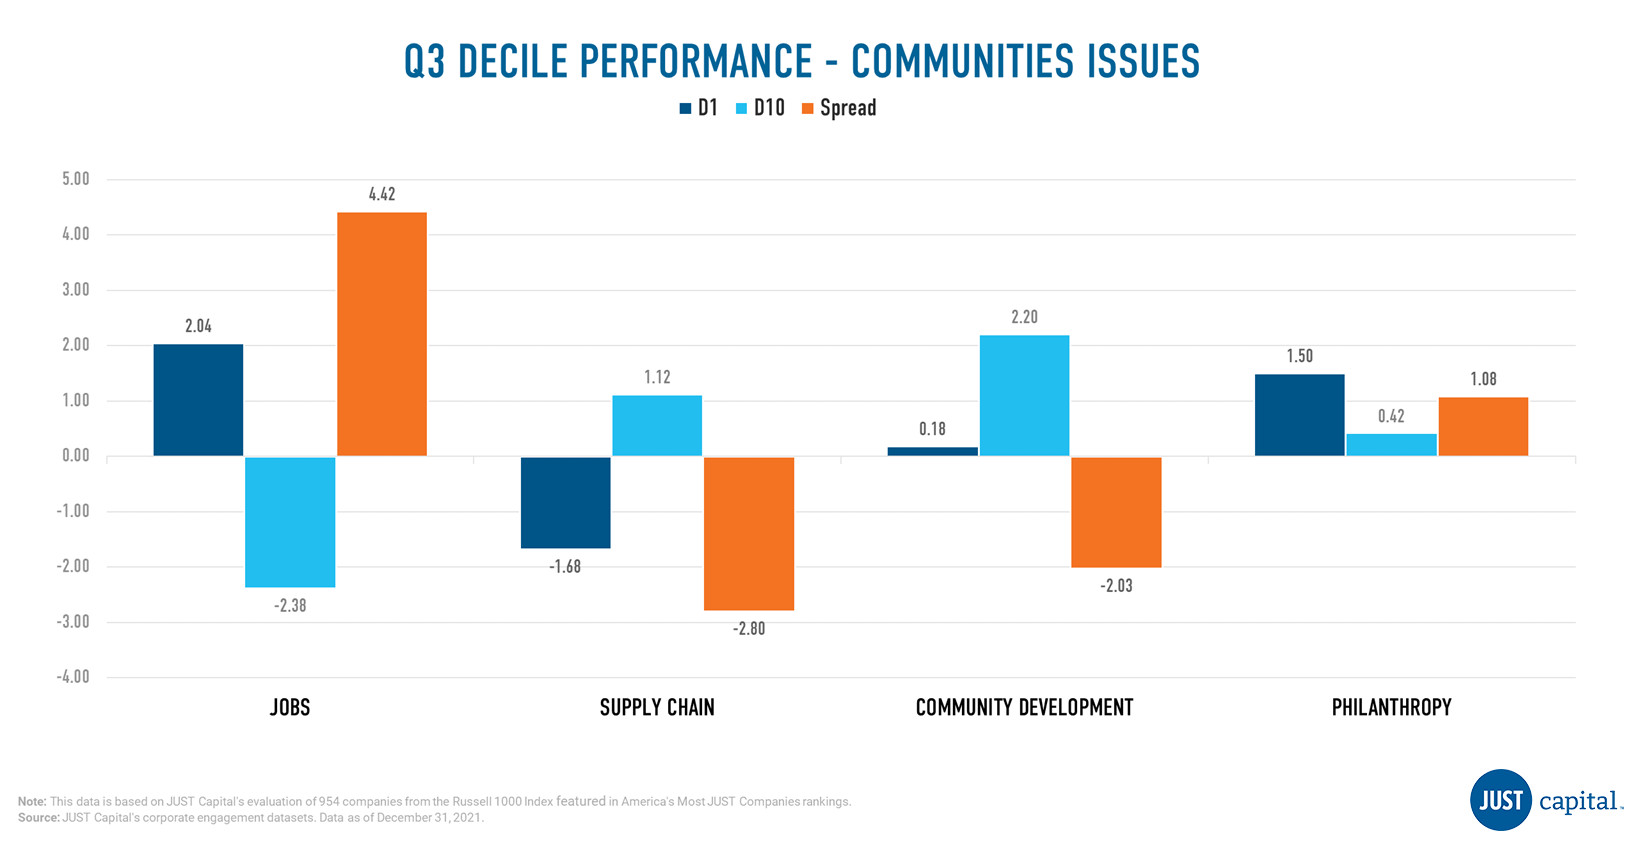
Jobs and Philanthropy within Communities were positive contributors to the stakeholder’s performance whereas Supply Chain and Community Development didn’t add to performance.
Shown below are the both top and bottom five contributors to the top decile (D1), the best-ranked companies as measured by their Communities score, and the bottom decile (D10), the worst-ranked companies as measured by their Communities score.
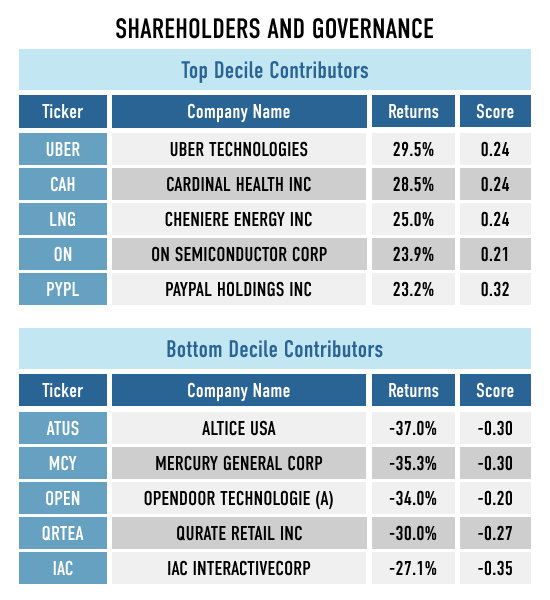
The Shareholders and Governance stakeholder measures a company across three Issues:
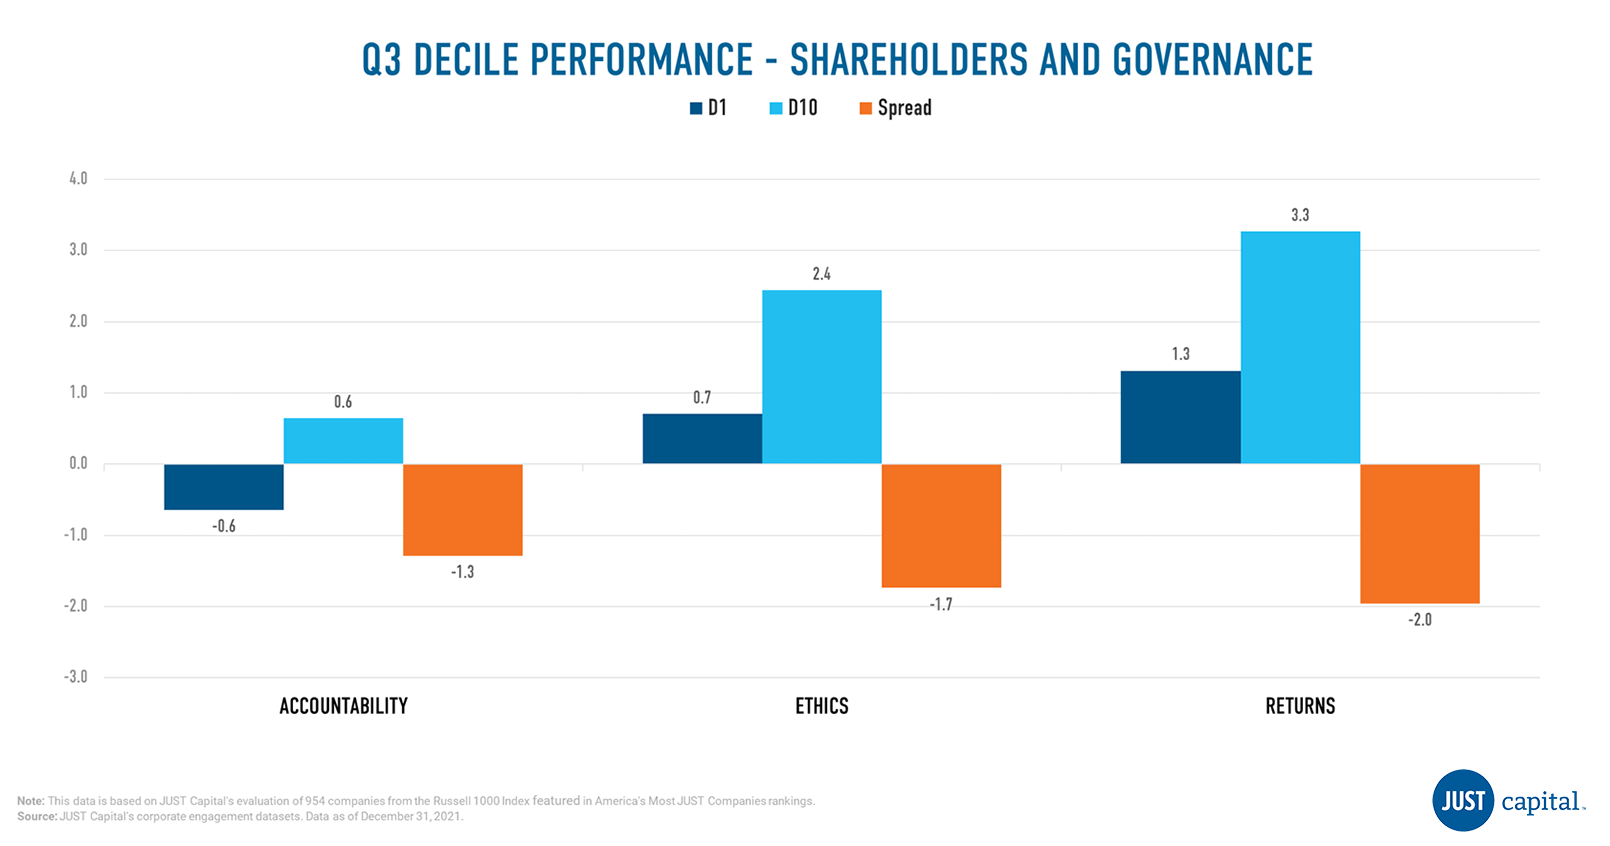
In Q3 we saw the Returns issue under-perform the other Shareholder and Governance issues, with a long-short spread of -2%.
Shown below are the both top and bottom five contributors to the top decile (D1), the best-ranked companies as measured by their Shareholders and Governance score, and the bottom decile (D10), the worst-ranked companies as measured by their Shareholders and Governance score.
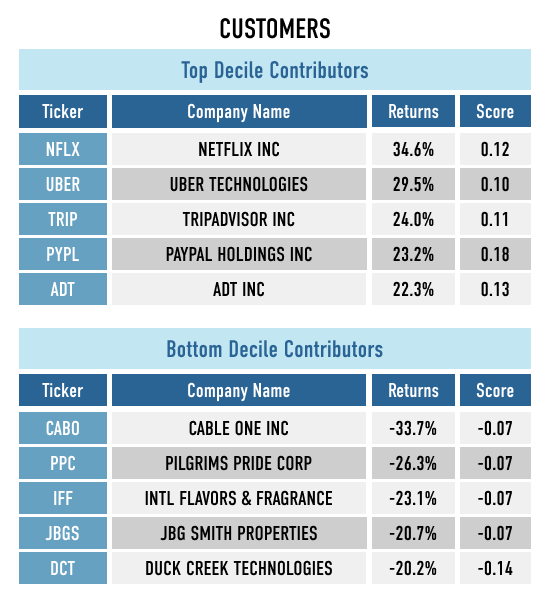
The Customers stakeholder measures a company across four Issues:
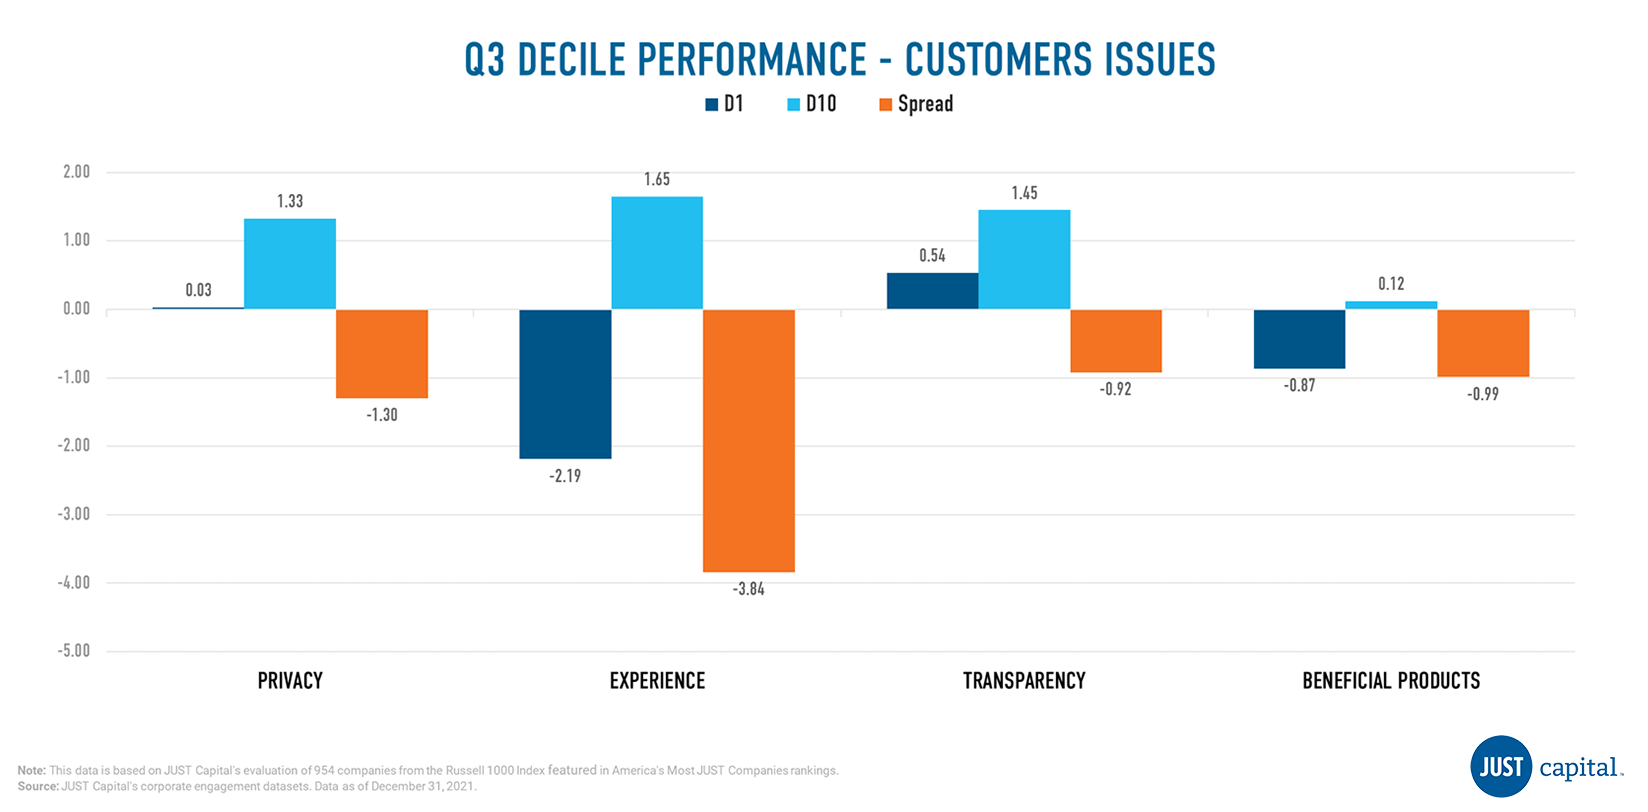
In Q3, we saw the Experience underperform the other Customer Issues, with a long-short spread of 3.8%. Beneficial Products, Privacy, and Transparency also were negative contributors to Customer performance.
Shown below are the both top and bottom five contributors to the top decile (D1), the best-ranked companies as measured by their Customer score, and the bottom decile (D10), the worst-ranked names as measured by Customer score.
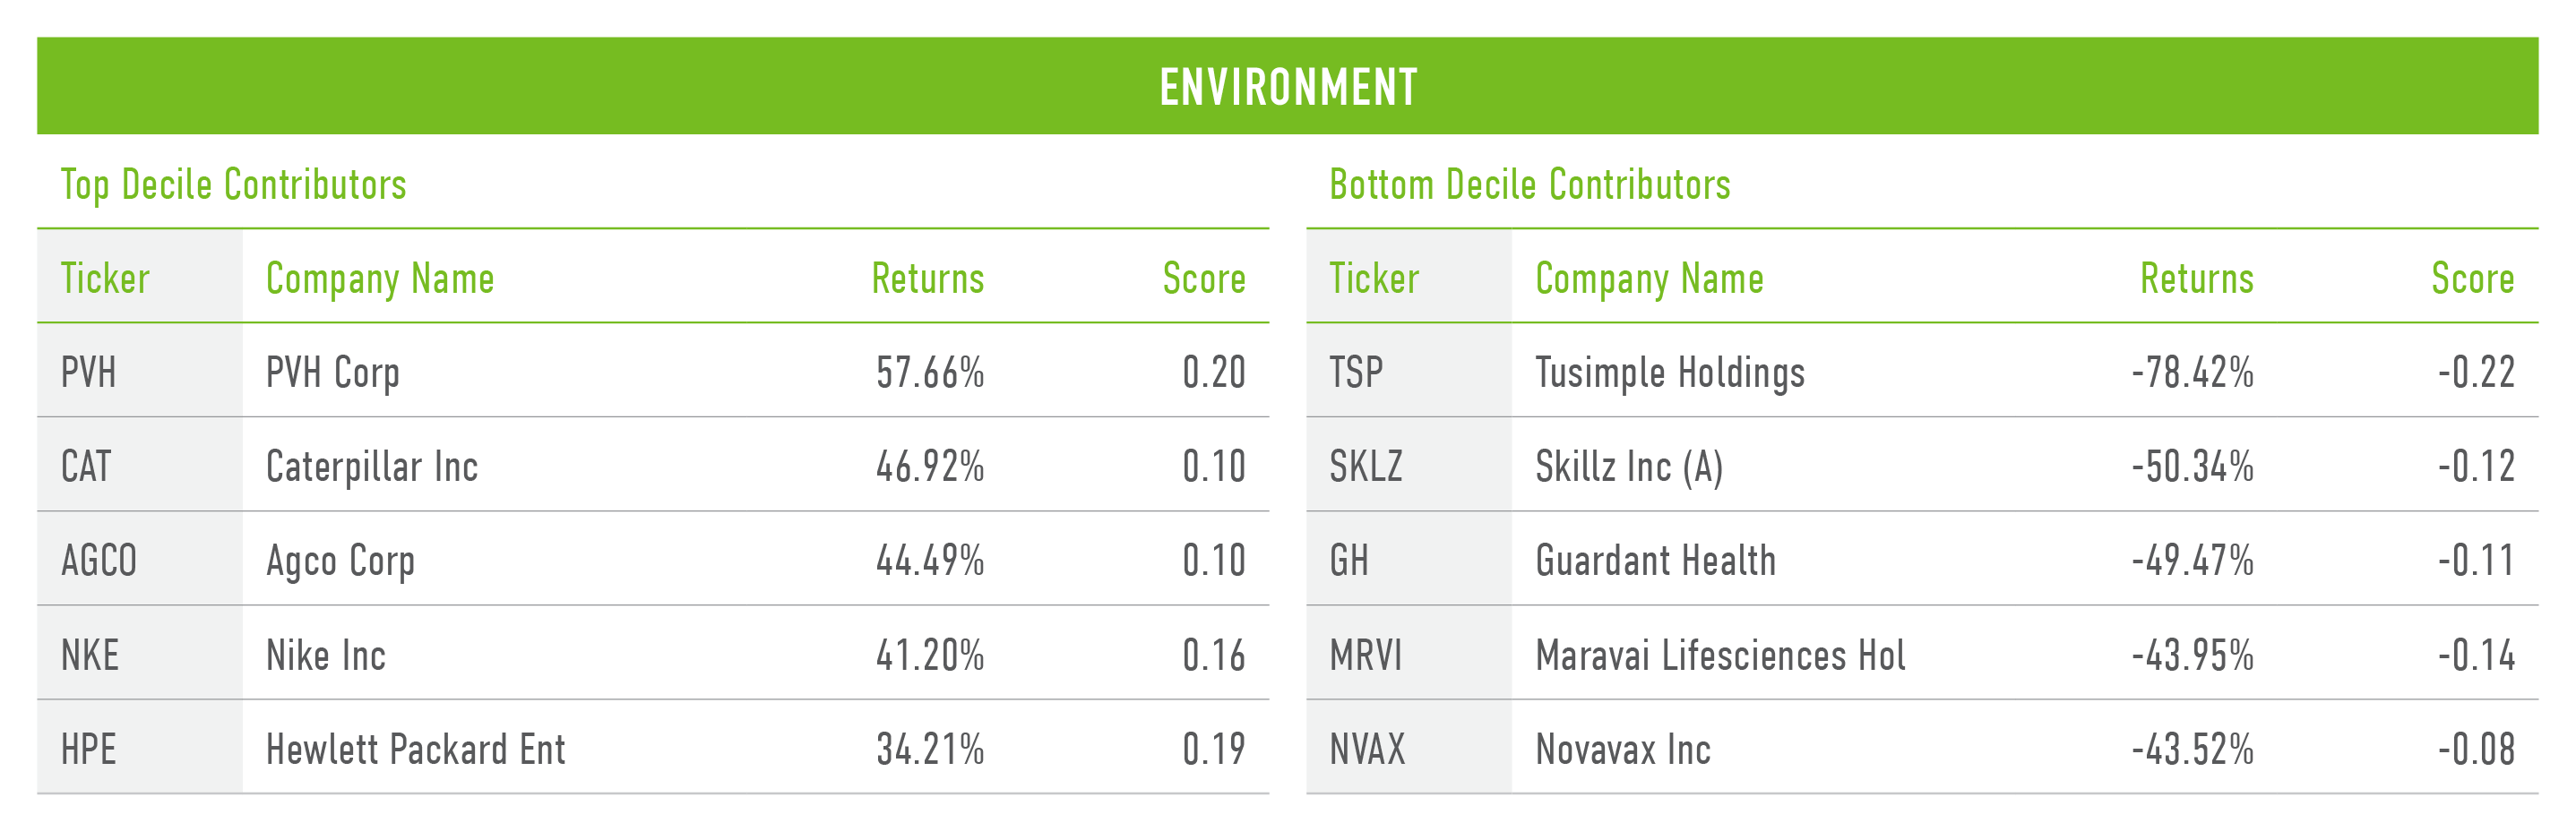
The Environment stakeholder measures a company across four Issues:
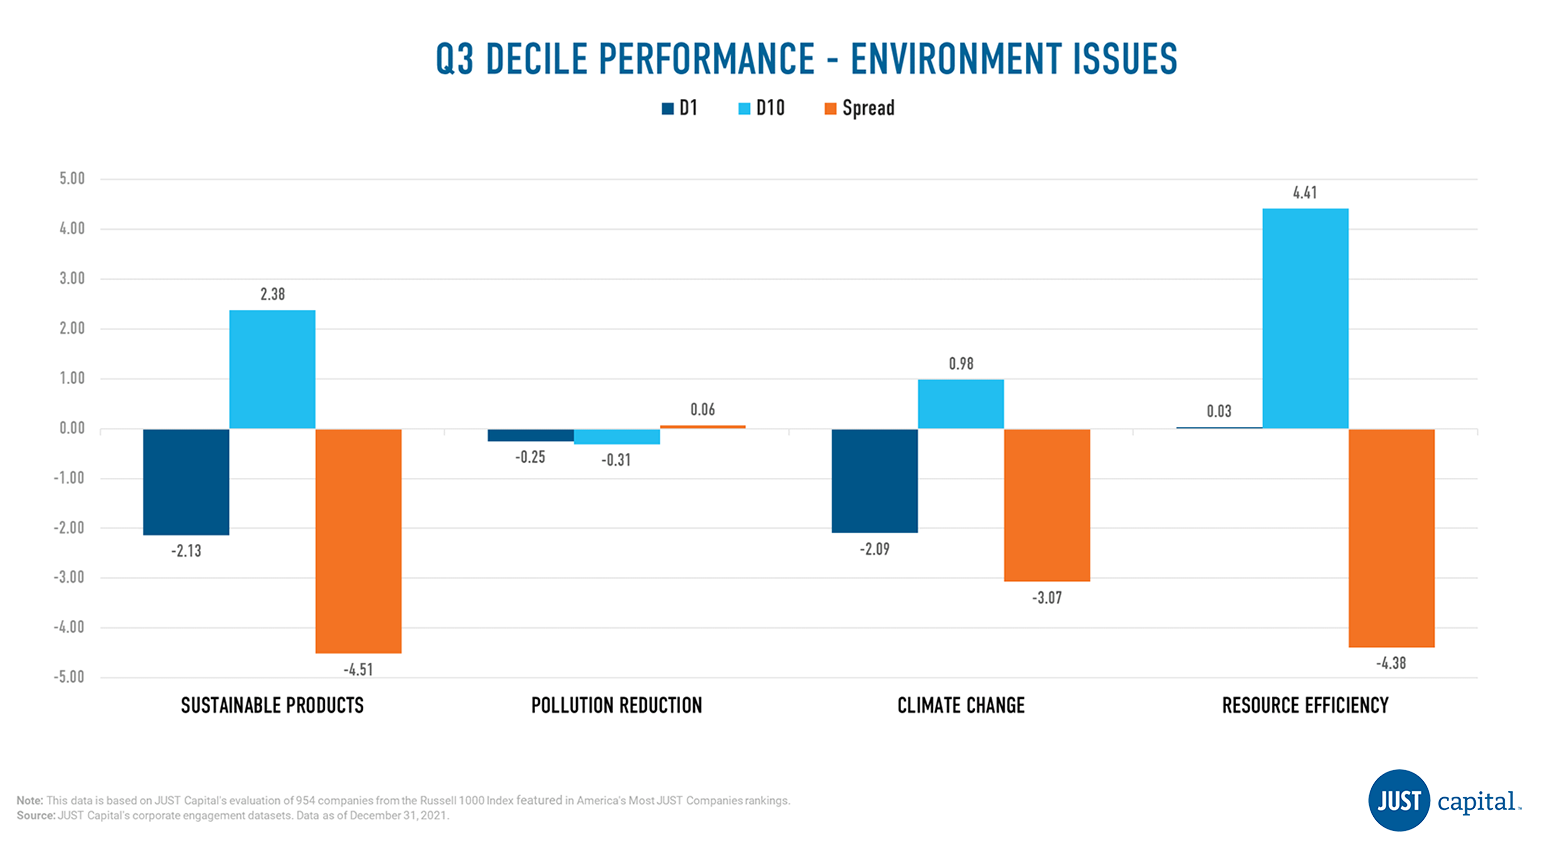
In Q3, we saw Pollution Reduction outperform other Environment Issues. Resource Efficiency, Sustainable Products and Climate Change delivered negative performance in this quarter.
Shown below are the both top and bottom five contributors to the top decile (D1), the best-ranked companies as measured by their Environmental score, and the bottom decile (D10), the worst-ranked companies as measured by their Environment score.
We monitor the performance of these stakeholders and Issues on a long-short basis. The long and short portfolios are selected based on the factor scores as the top and bottom deciles within the universe of companies we track in the Russell 1000. Top decile (D1) companies are those that rank highest based on the factor score, and bottom decile (D10) companies are those that rank lowest based on the factor score.
D1 Performance is computed as:
(Equally weighted average of returns of stocks in D1 bucket) – (Equally weighted average of returns of all stocks within the Universe)
D10 Performance is computed as:
(Equally weighted average of returns of stocks in D10 bucket) – (Equally weighted average of returns of all stocks within the Universe)
Spread is computed as:
D1 Performance – D10 Performance
Report by Director of Quantitative Research & Analytics Mona Patni.
In quant investing, factors form the basis of performance. Here, we evaluate the stakeholder and issue scores that Jusr Capital computes for Russell 1000 companies as factors and see if the signal based on the score can translate into alpha over the period being considered.
When we say stakeholder performance, we are measuring the financial performance of firms in the top 10% of each stakeholder group (D1), compared to the bottom 10% of this group (D10). The top 10% of Workers, for example, means the companies with the top 10% of scores for Workers, i.e. the best companies for workers. We then see if these signals are useful in separating one group of stocks from another by sharing the quarterly performance of the portfolios. We then apply this approach to the Issues that comprise each stakeholder. In both cases, we will refer to the portfolios by the stakeholder or Issue they represent.
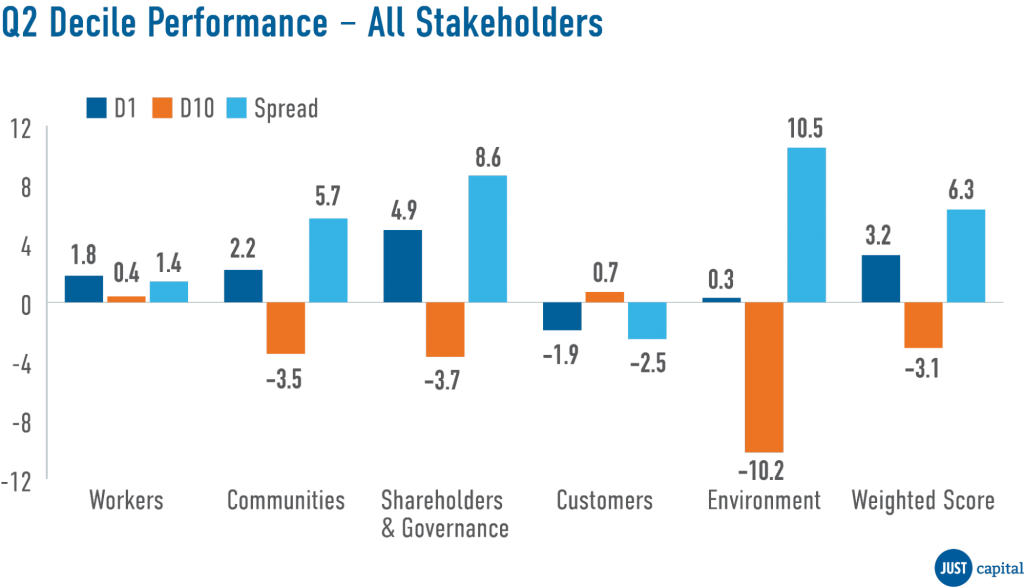
In Q2 2022, Just Capital found that four of the five stakeholders we track delivered positive performance, excluding Customers. The Environment stakeholder delivered the best performance over this period, with a long-short spread of 10.5%. Within the Customers stakeholder, underperformance was driven by both deciles, with the top decile underperforming and bottom decile outperforming.
Just Capital’s Overall Weighted Score takes into account the 20 core Issues identified through our survey research as top priorities for just business – including paying a living wage, creating a diverse, inclusive workplace, and helping combat climate change – across key business stakeholders: Workers, Communities, Shareholders and Governance, Customers, and the Environment. This Overall Weighted Score delivered a spread of 6.3% over the period ending June 30, 2022.
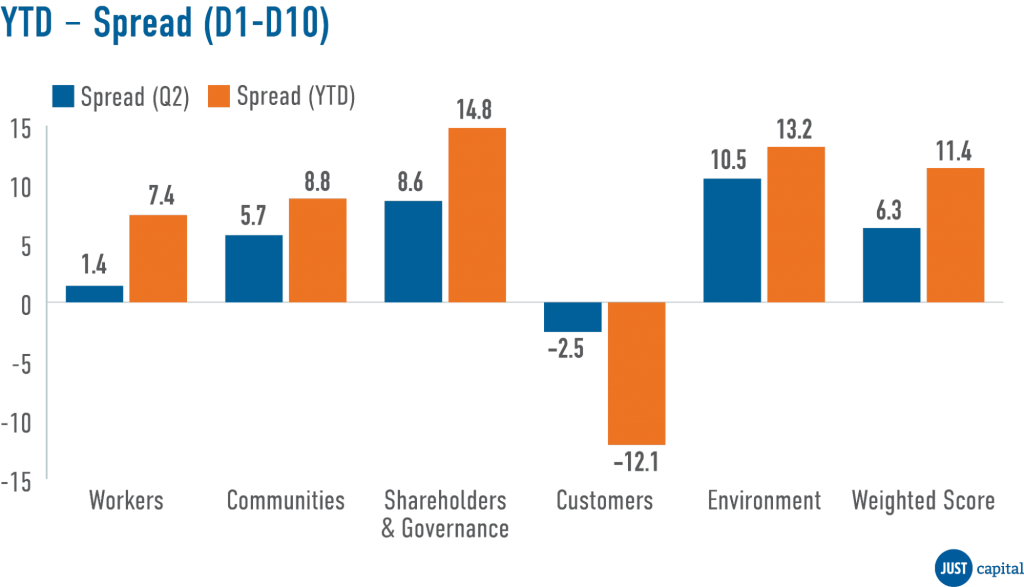
Shown below is the Year-to-Date (YTD) and Q2 performance, which is quantified by the spread between the top and bottom deciles of all the stakeholders and the overall weighted score.
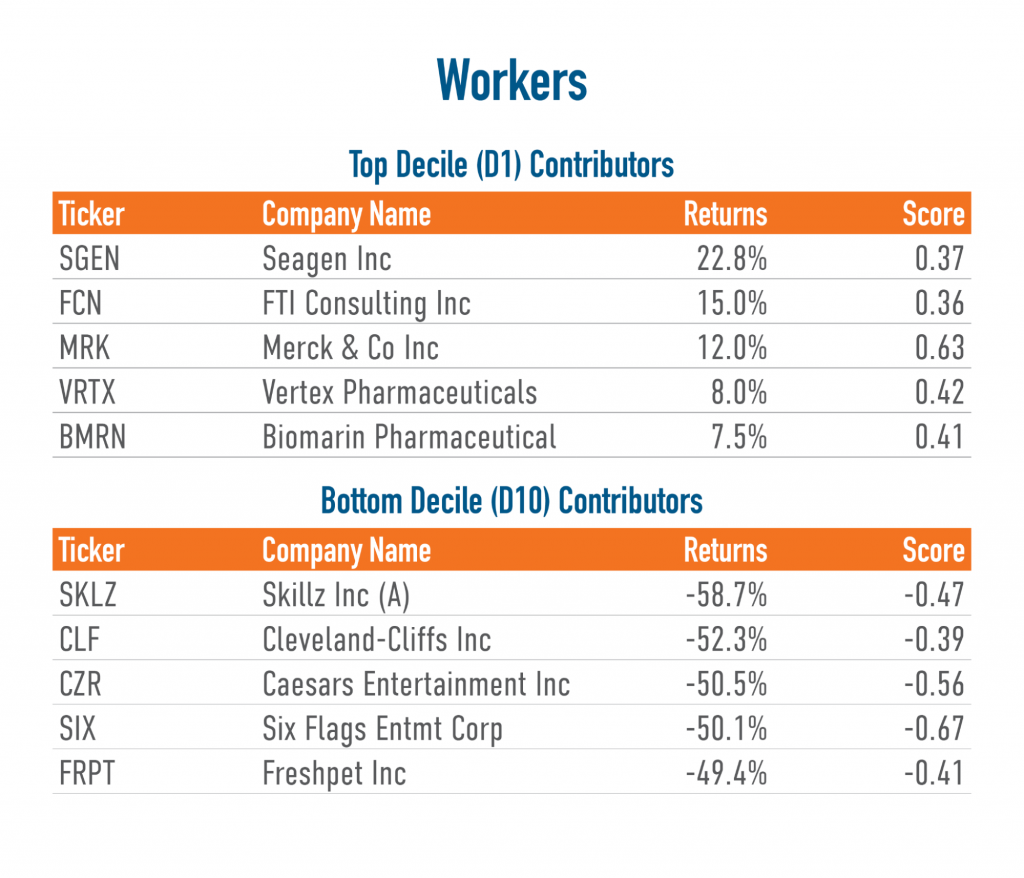
The Workers stakeholder measures a company across five Issues:
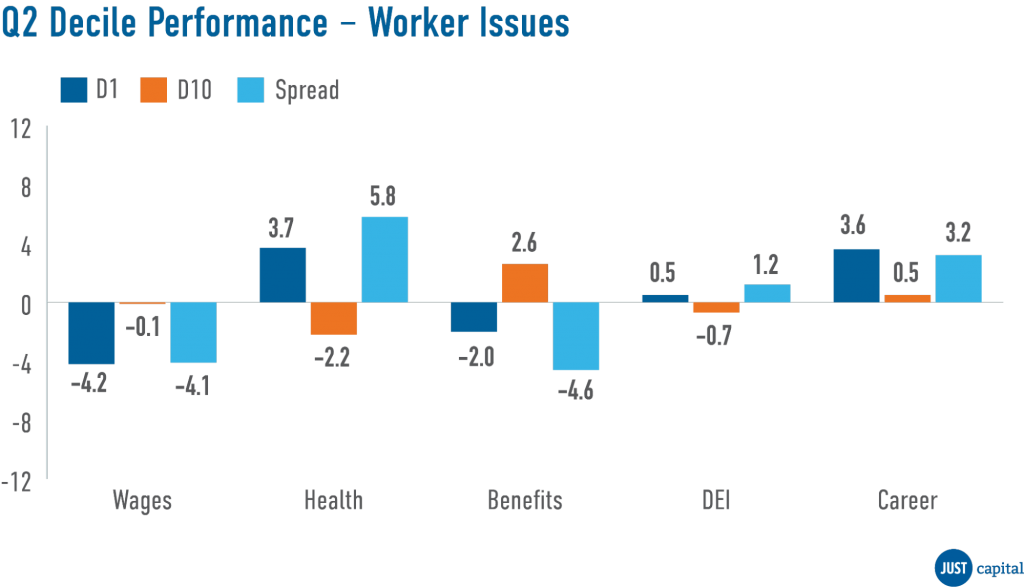
In Q2, we saw three out of five Worker Issues outperform. Underperformance in Benefits was driven by negative performance from both top and bottom decile companies and weak performance in Wages was driven by top decile companies.
Shown below are the top and bottom five contributors to the top decile (D1), the top-ranked companies as measured by their Workers score, and the bottom decile (D10), the lowest-ranked companies as measured by their Worker score.
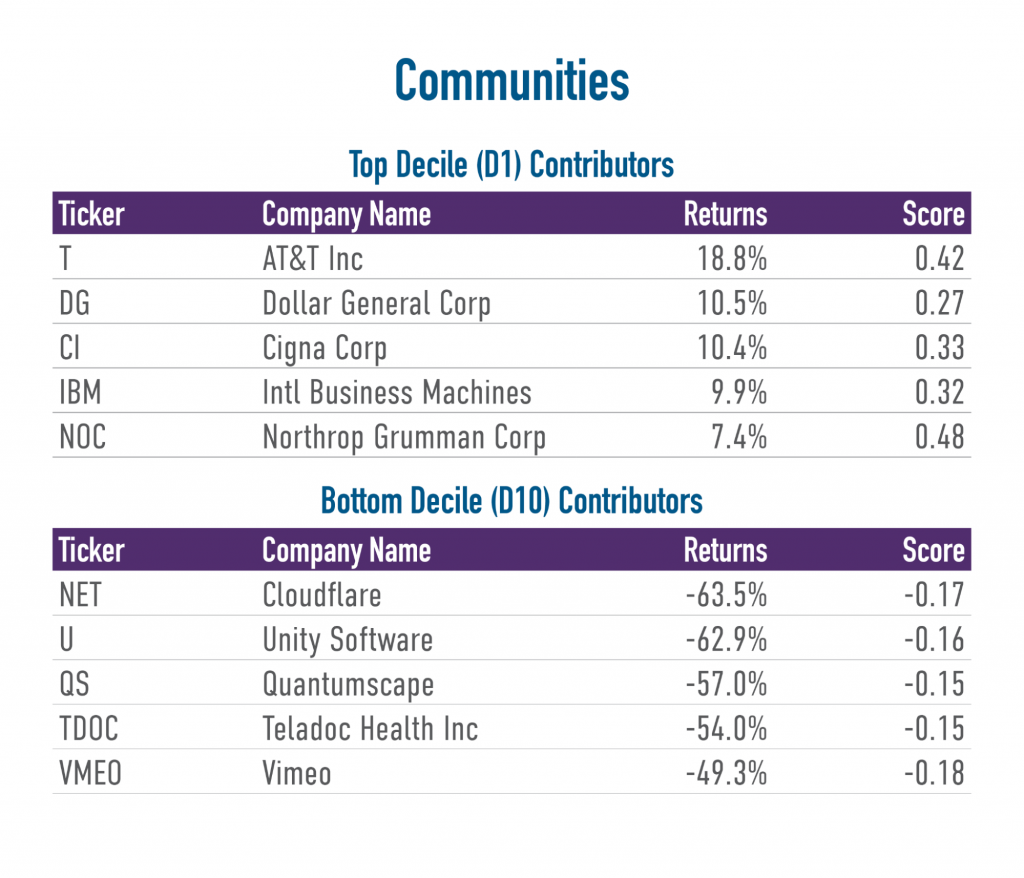
The Communities stakeholder measures a company across four Issues:
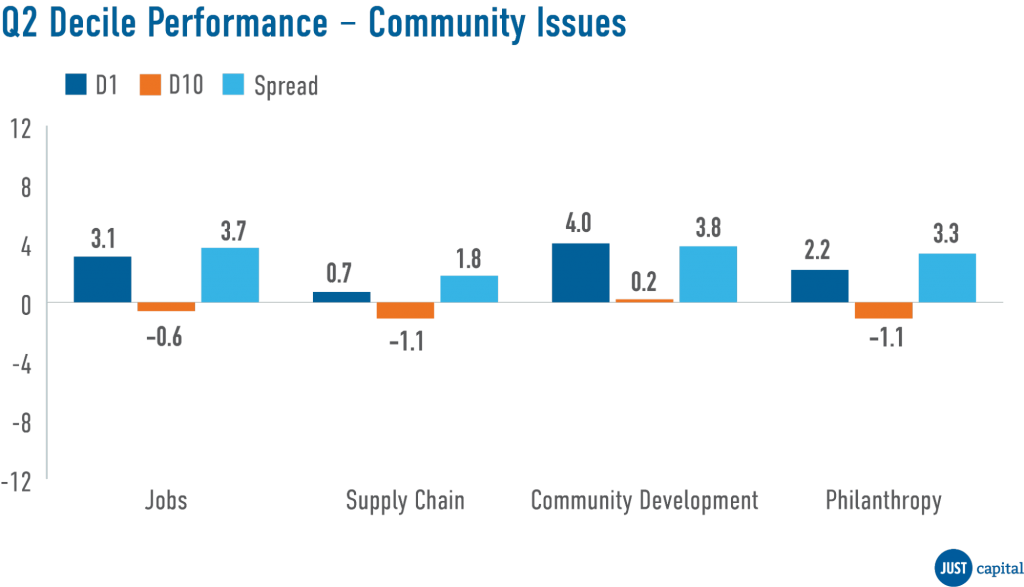
All issues within Communities were positive contributors to the stakeholder’s performance.
In Q2, we saw Community Development outperform other Issues within Communities. Shown below are the top and bottom five contributors to the top decile (D1), the top-ranked companies as measured by their Communities score, and the bottom decile (D10), the lowest-ranked companies as measured by their Communities score.
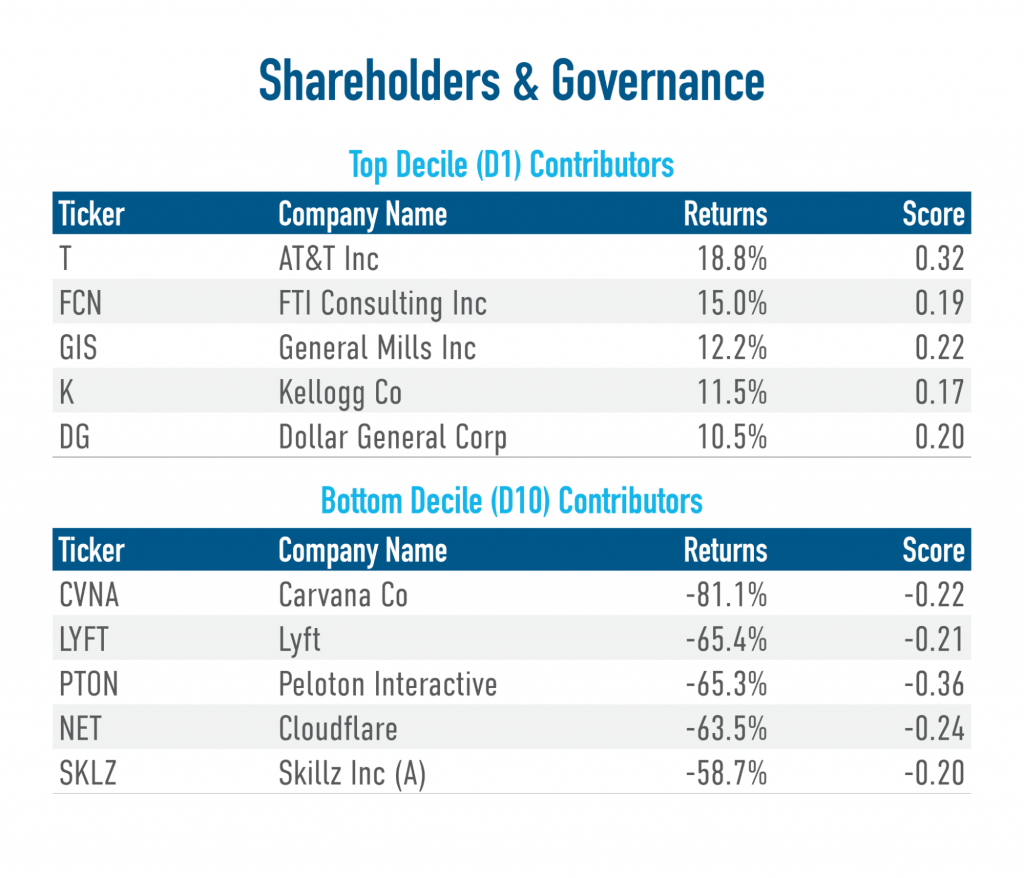
The Shareholders and Governance stakeholder measures a company across three Issues:
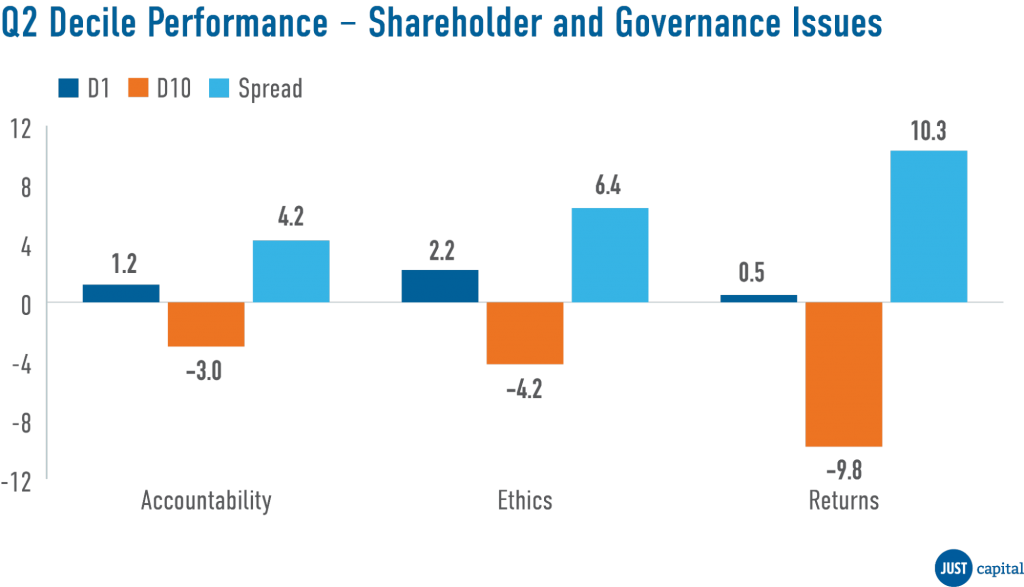
In Q2 we saw the Returns issue outperform the other Shareholder and Governance Issues, with a long-short spread of 10.3%.
Shown below are the top and bottom five contributors to the top decile (D1), the top-ranked companies as measured by their Shareholders and Governance score, and the bottom decile (D10), the lowest-ranked companies as measured by their Shareholders and Governance score.
The Customers stakeholder measures a company across four Issues:
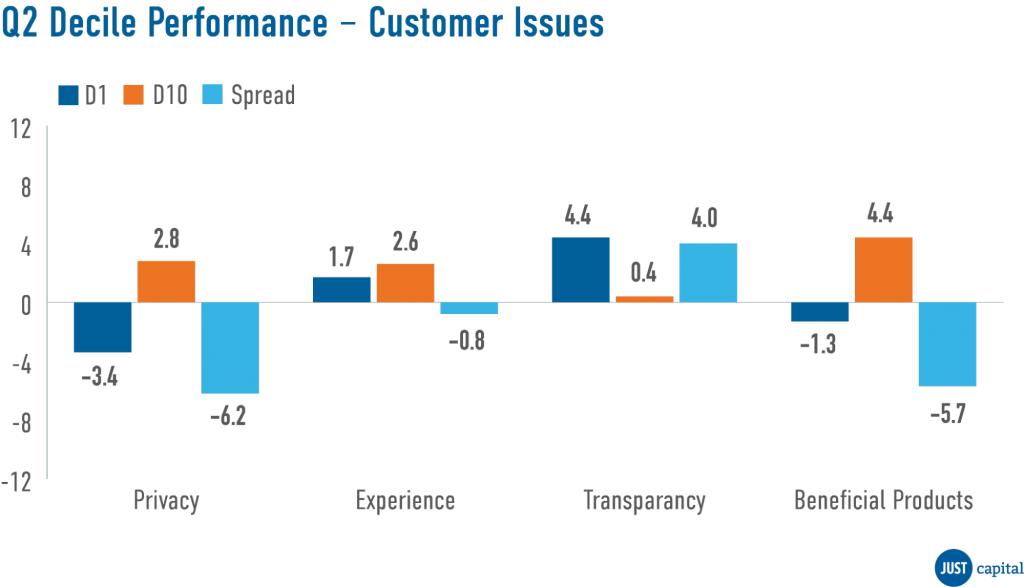
In Q2, we saw the Transparency outperform the other Customer Issues, with a long-short spread of 4%. Beneficial Products, Privacy, and Experience were negative contributors to Customer performance.
Shown below are the top and bottom five contributors to the top decile (D1), the top-ranked companies as measured by their Customer score, and the bottom decile (D10), the lowest-ranked names as measured by Customer score.
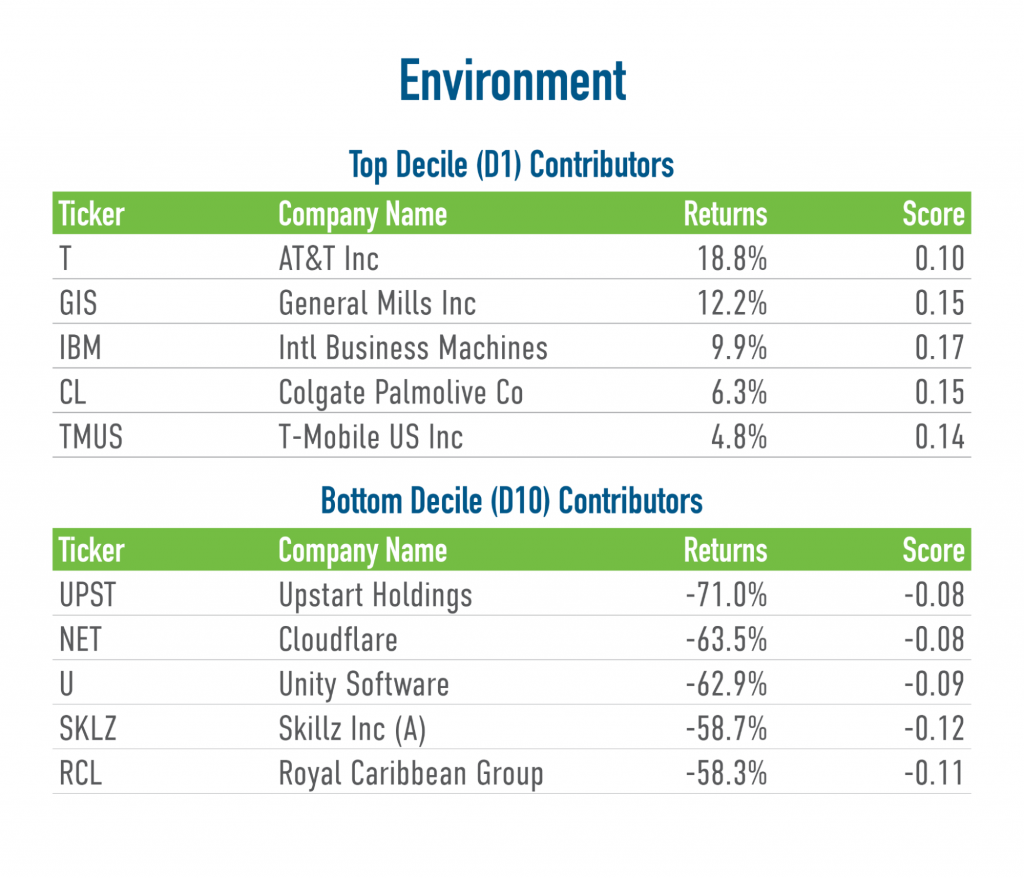
The Environment stakeholder measures a company across four Issues:
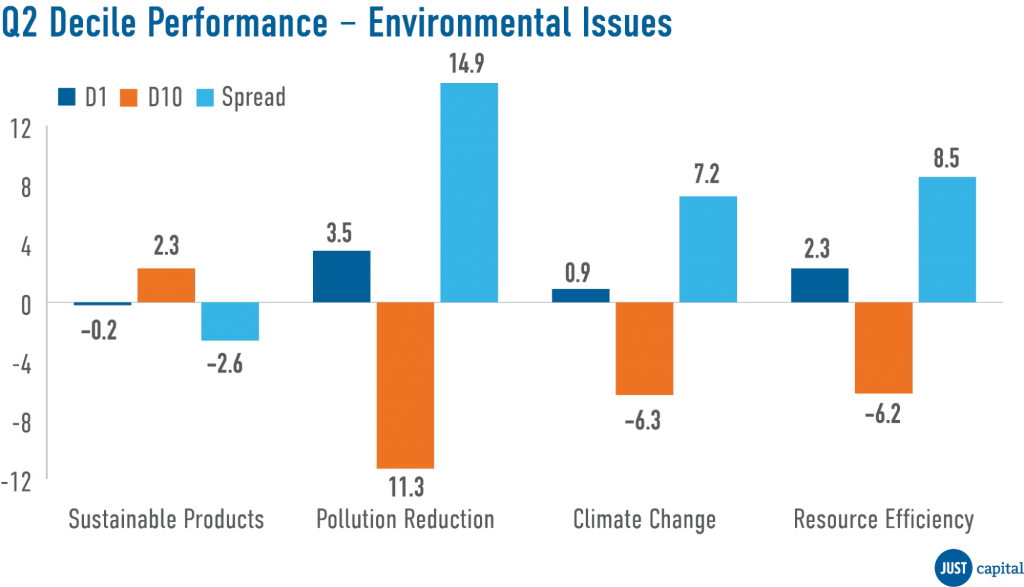
In Q2, we saw Pollution Reduction outperform other Environment Issues. Resource Efficiency and Climate Change were also positive, while Sustainable Products had negative performance.
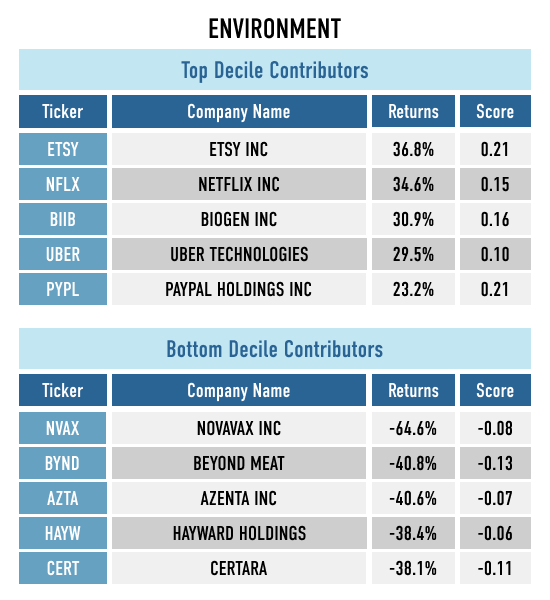
Shown below are the top and bottom five contributors to the top decile (D1), the top-ranked companies as measured by their Environmental score, and the bottom decile (D10), the lowest-ranked companies as measured by their Environmental score.
We monitor the performance of these stakeholders and Issues on a long-short basis. The long and short portfolios are selected based on the factor scores as the top and bottom deciles within the universe of companies we track in the Russell 1000. Top decile (D1) companies are those that rank highest based on the factor score, and bottom decile (D10) companies are those that rank lowest based on the factor score.
D1 Performance is computed as (Equally weighted average of returns of stocks in D1 bucket) – (Equally weighted average of returns of all stocks within the Universe).
D10 Performance is computed as (Equally weighted average of returns of stocks in D10 bucket) – (Equally weighted average of returns of all stocks within the Universe).
Spread is computed as D1 Performance – D10 Performance.
Report by Director of Quantitative Research & Analytics Mona Patni.
In quant investing, factors form the basis of performance. Here, we evaluate the stakeholder and issue scores that JUST Capital computes for Russell 1000 companies as factors and see if the signal based on the score can translate into alpha over the period being considered. We use the scores to form D1 (best ranked companies) and D10 (worst ranked companies) portfolios and see if these signals are useful in separating one group of stocks from another by sharing the quarterly performance of the portfolios.
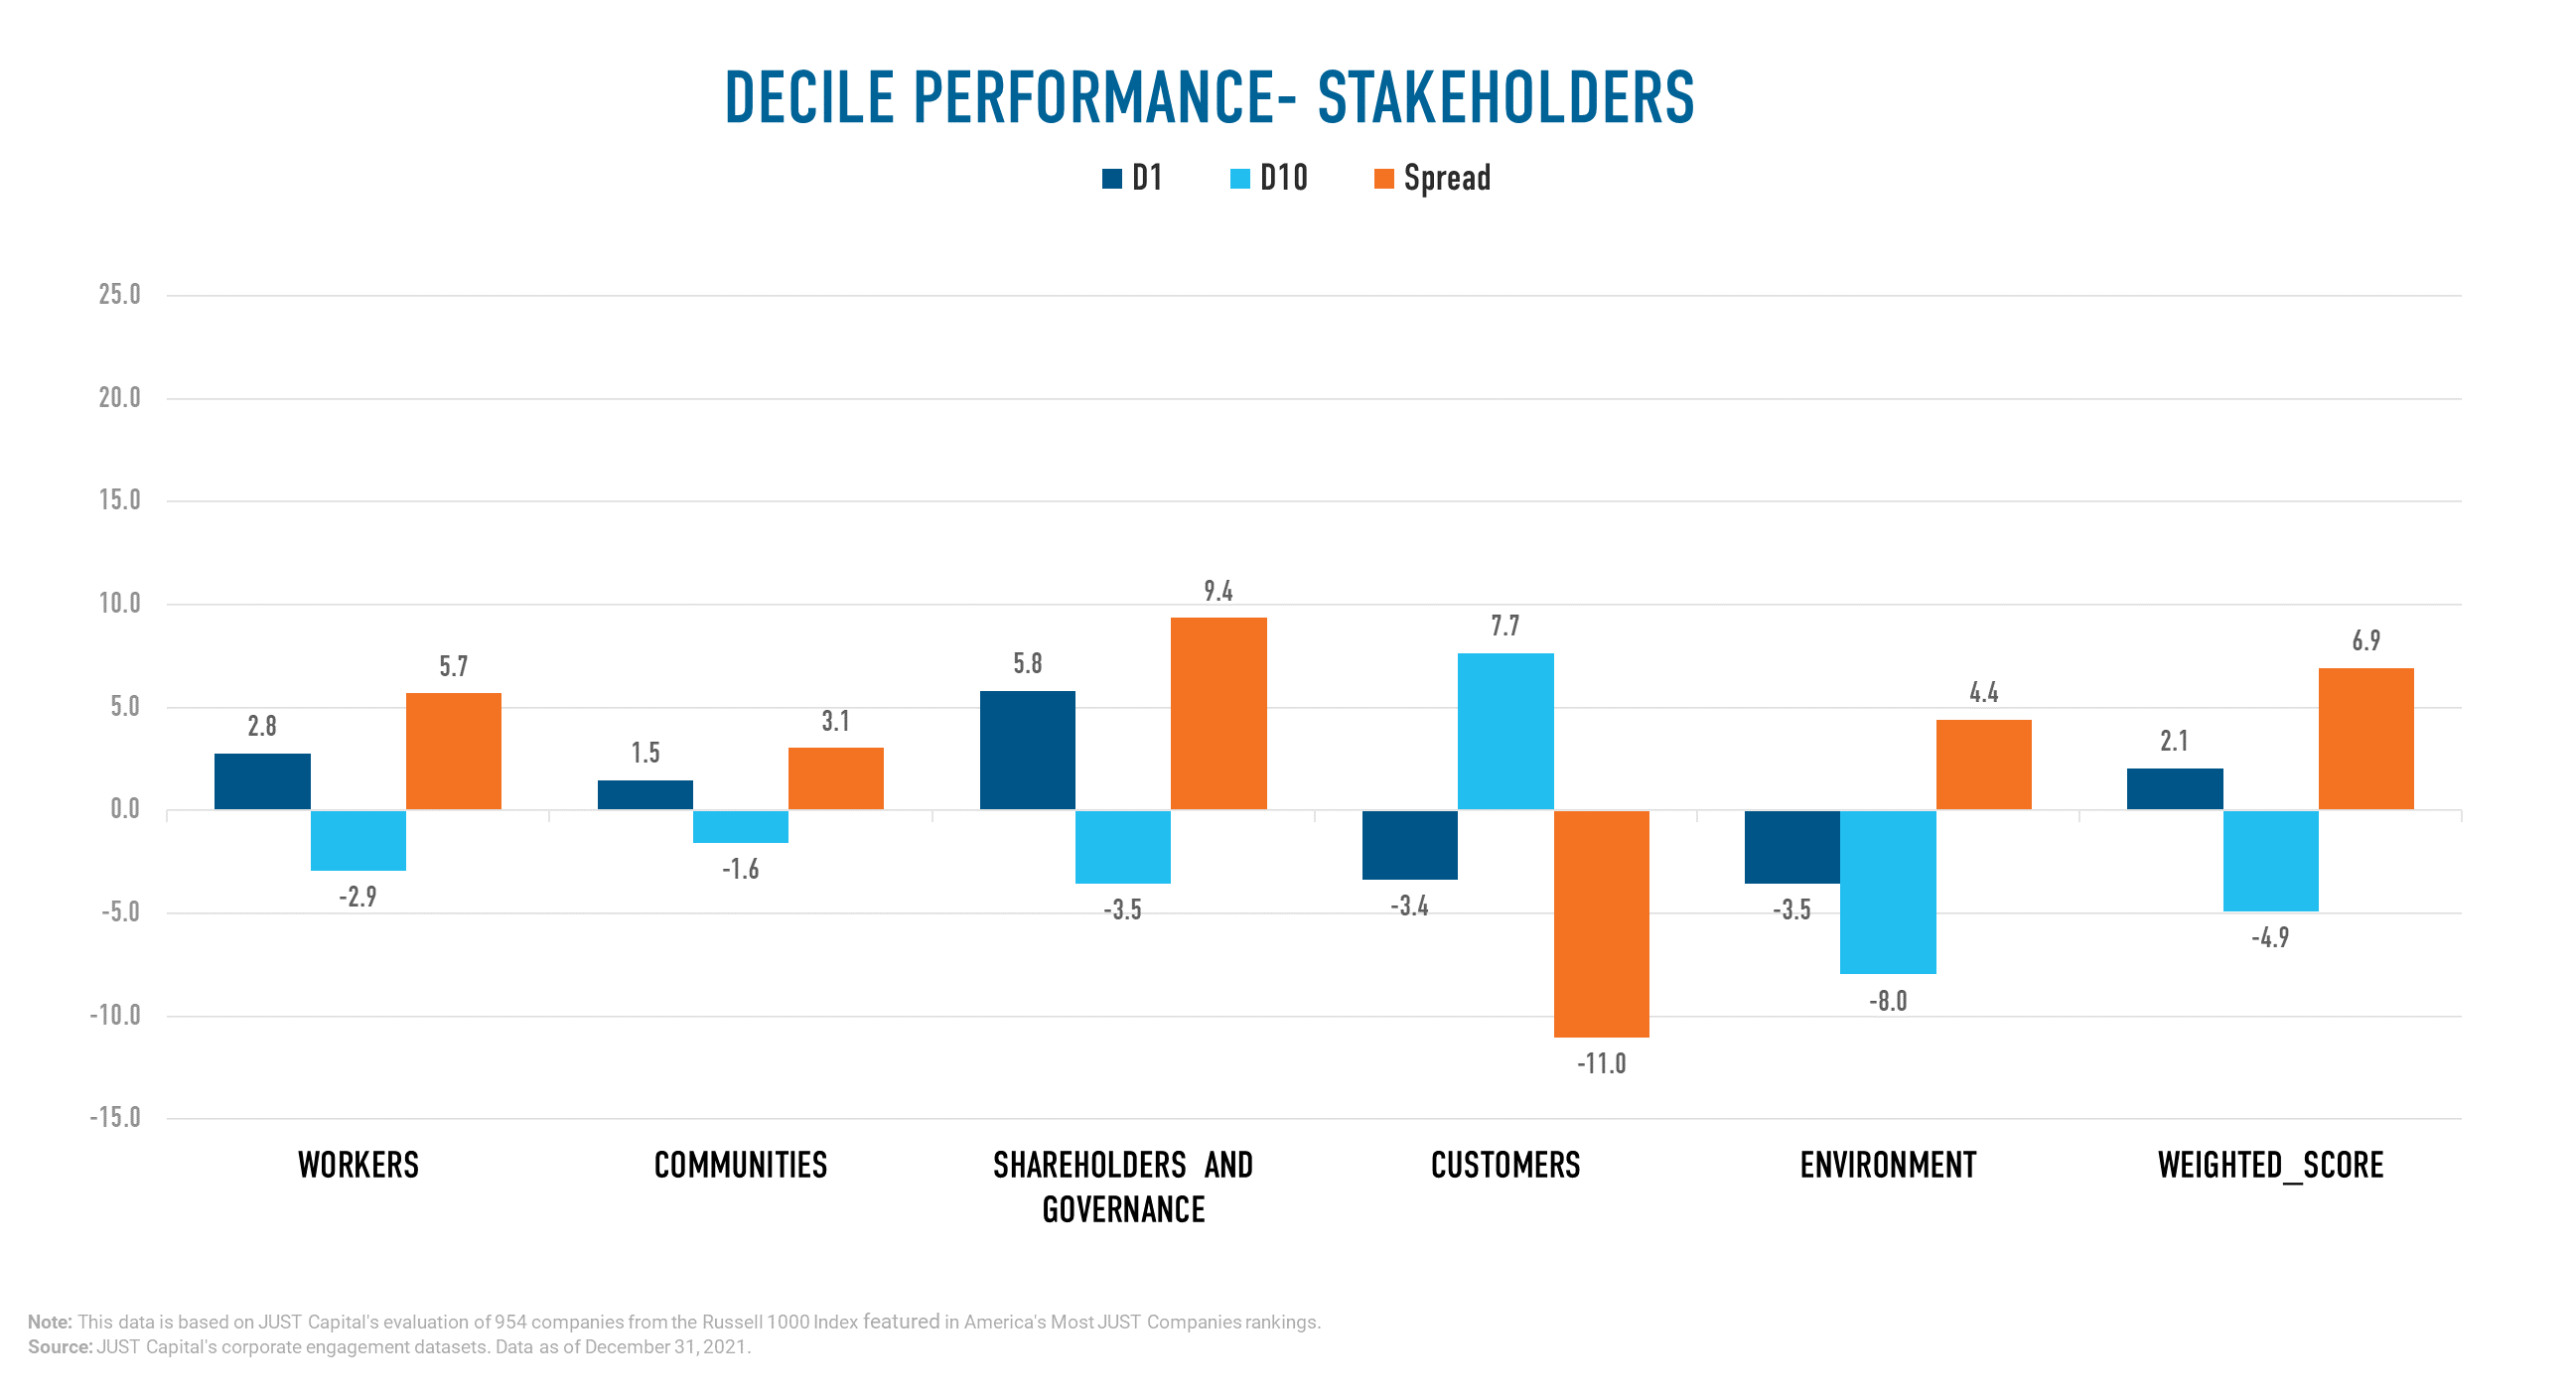
In Q1 2022 JUST Capital found that four of the five stakeholders we track delivered positive performance, excluding Customers. The Shareholders and Governance stakeholder delivered the best performance over this period with a long-short spread of 9.36%. Within the Customers stakeholder, underperformance was driven by both deciles, with the top decile underperforming and bottom decile outperforming.
JUST Capital’s Overall Weighted Score takes into account the 20 core Issues determined through our survey research – including paying a living wage, creating a diverse, inclusive workplace, and helping combat climate change – across key business stakeholders: Workers, Communities, Shareholders and Governance, Customers, and Environment. This Overall Weighted Score had the second highest long-short spread over the period ending March 31, 2022.
The Workers stakeholder measures a company across five Issues:
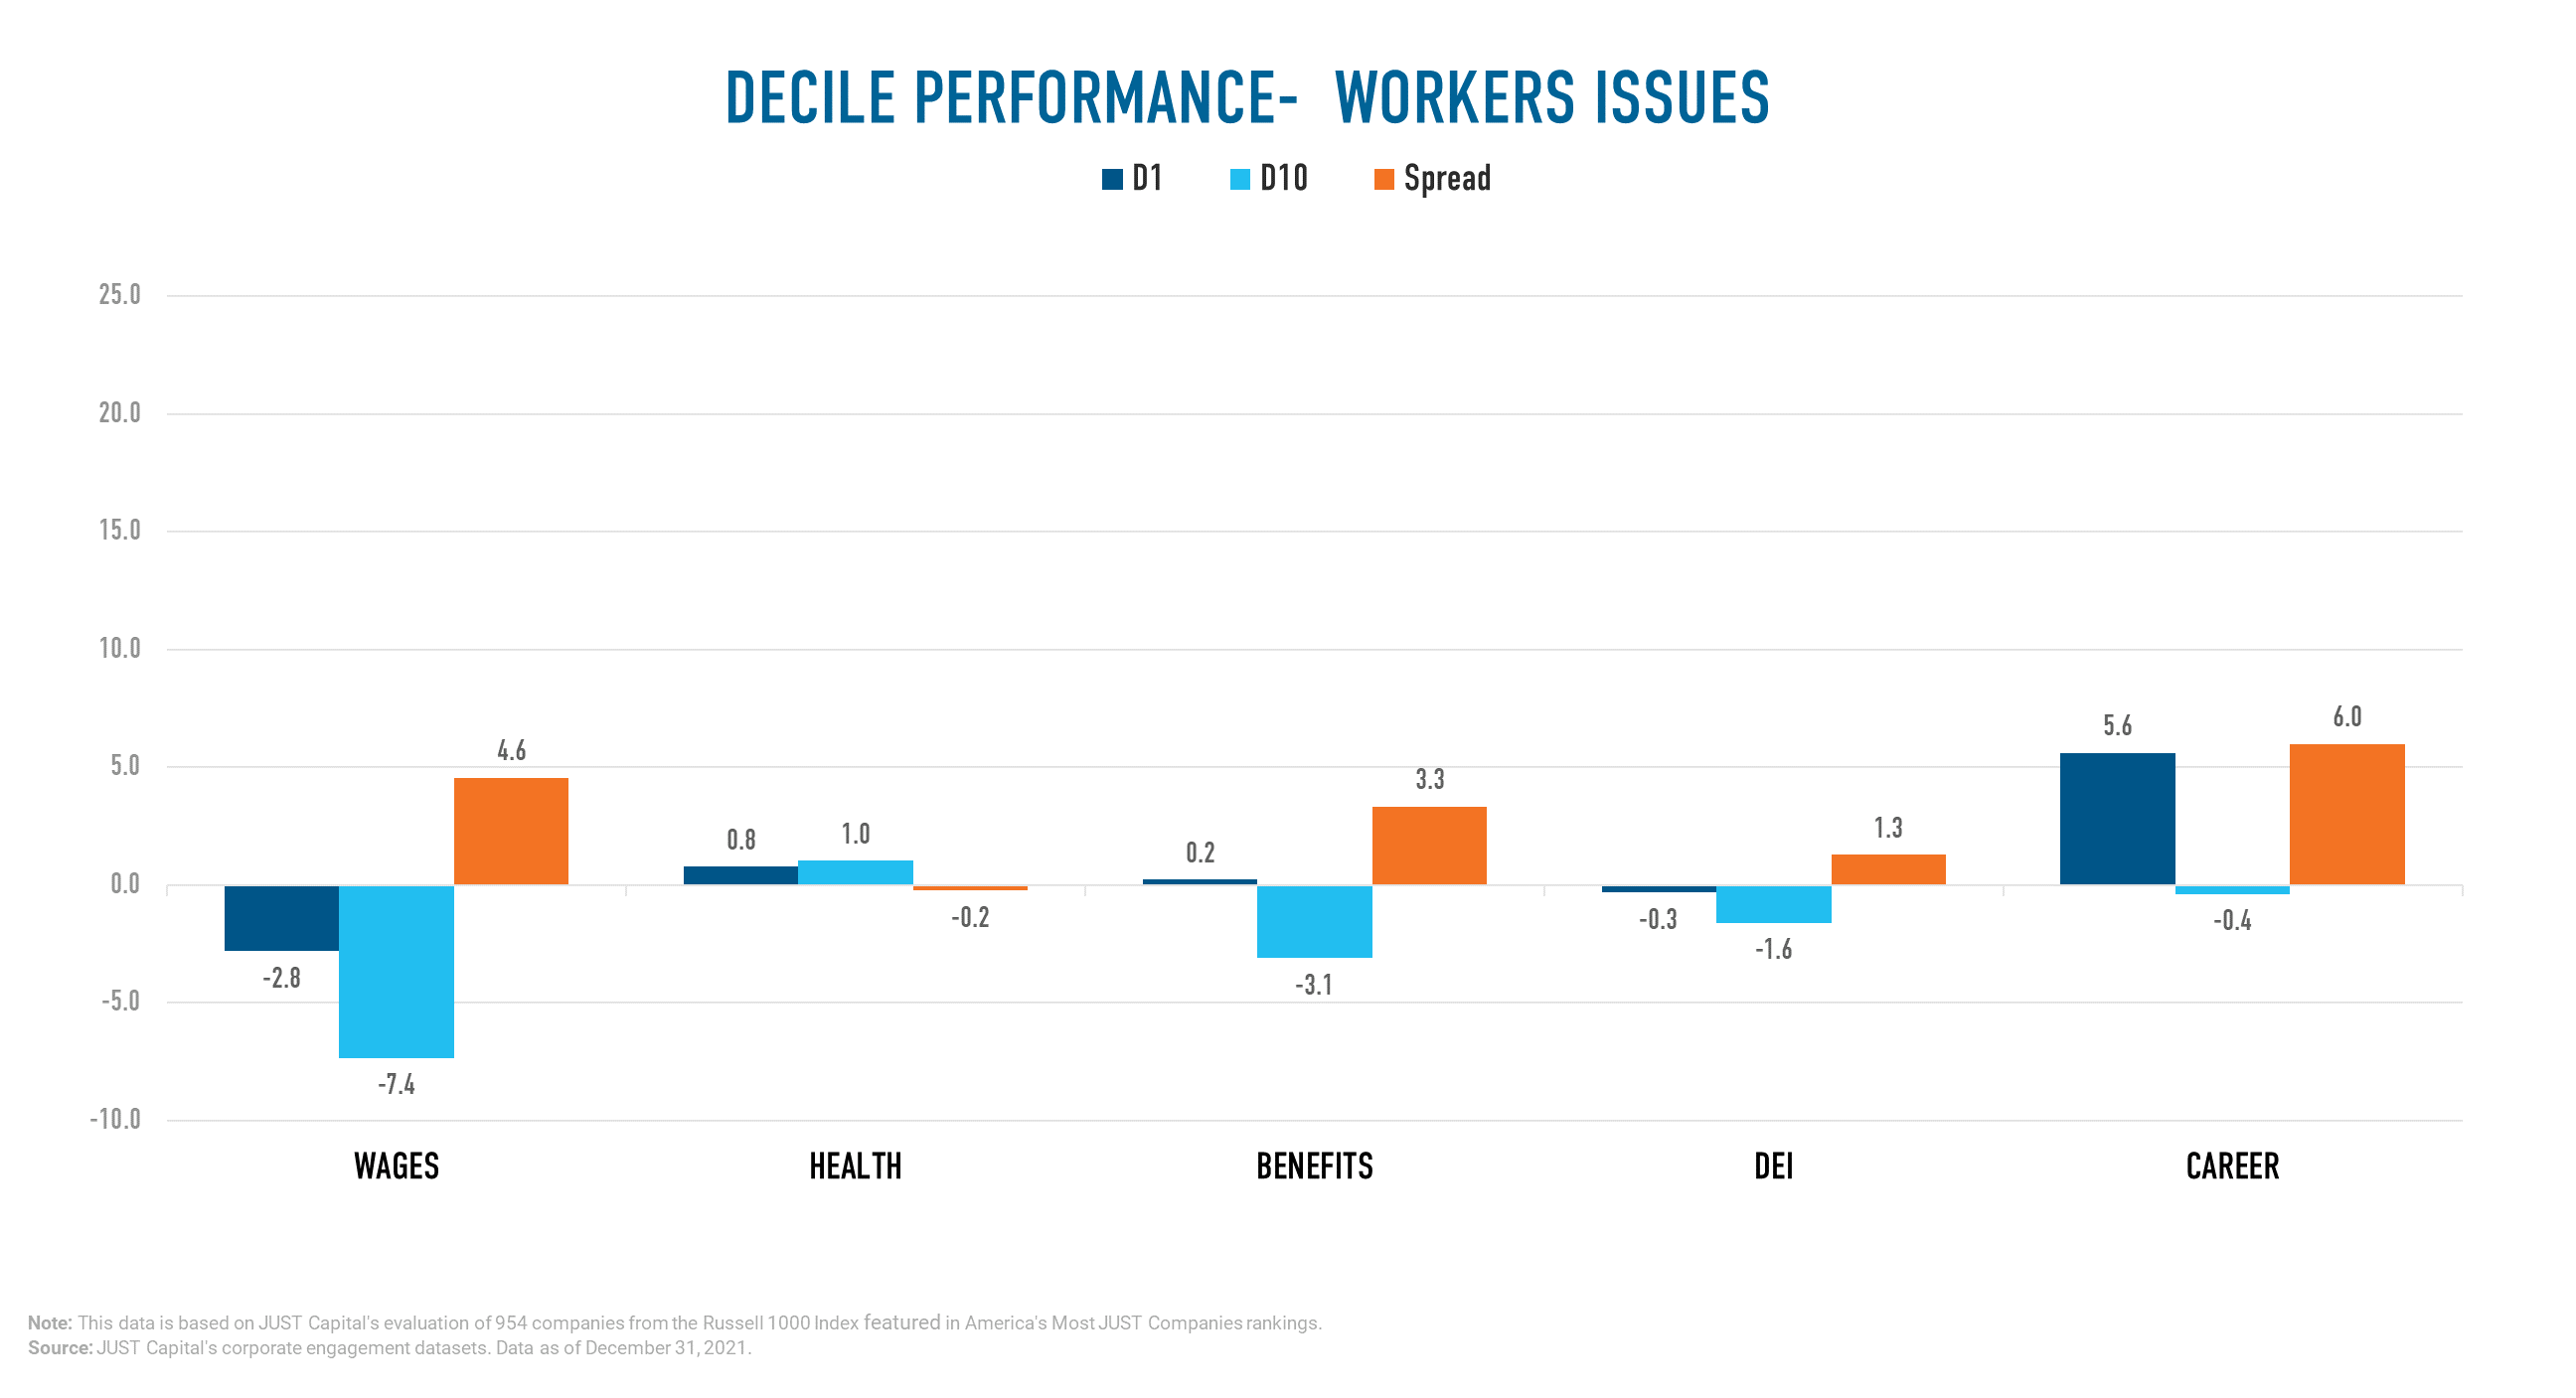
Year to date (YTD), we saw every Worker Issue besides Health outperform. Underperformance in Health was driven by negative performance from the bottom decile companies.
Shown below are the both top and bottom five contributors to the top decile (D1), the best-ranked companies as measured by their Workers score, and the bottom decile (D10), the worst-ranked companies as measured by their Worker score.
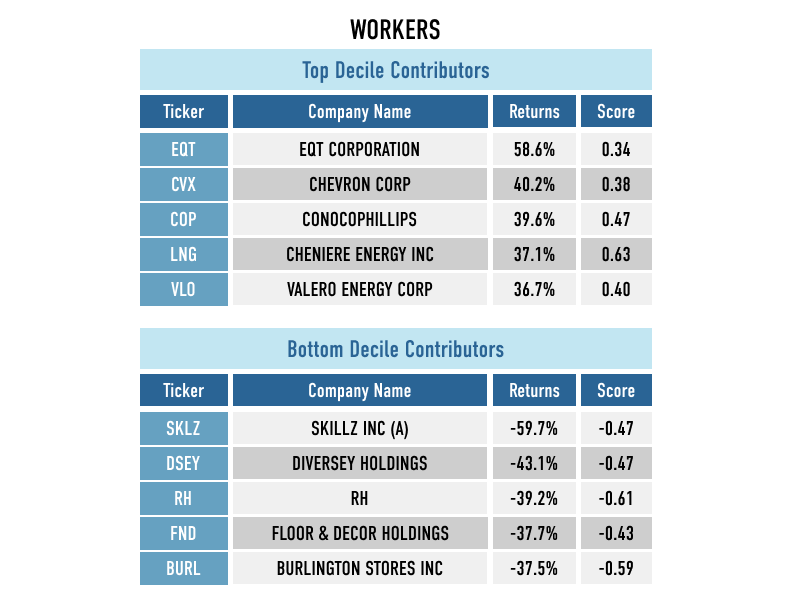
Interestingly, four out of top five contributors to D1 worker performance were all in the energy sector. We have seen energy names do well YTD, driven by improving demand and the Russia-Ukraine war’s curtailing supply and drawdown in inventories.
Among the top detractors, the mobile gaming platform Skillz was the biggest negative contributor.
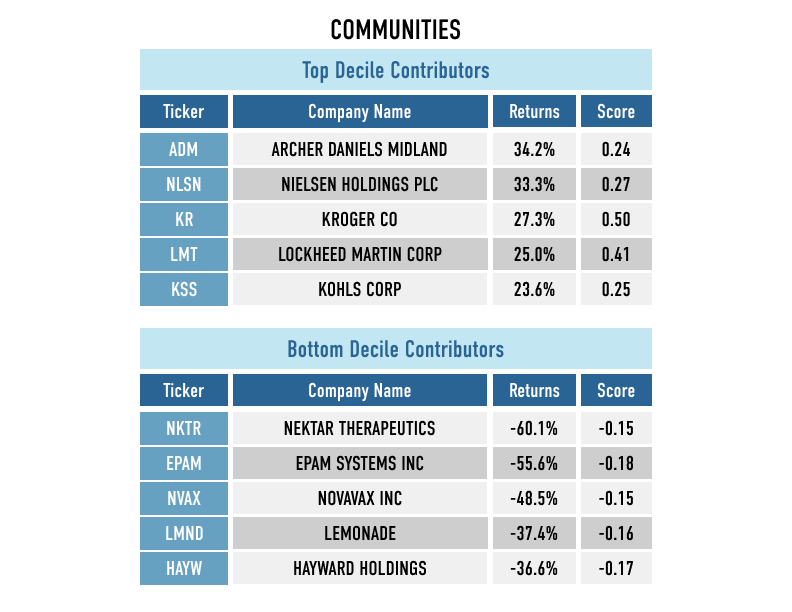
The Communities stakeholder measures a company across four Issues:
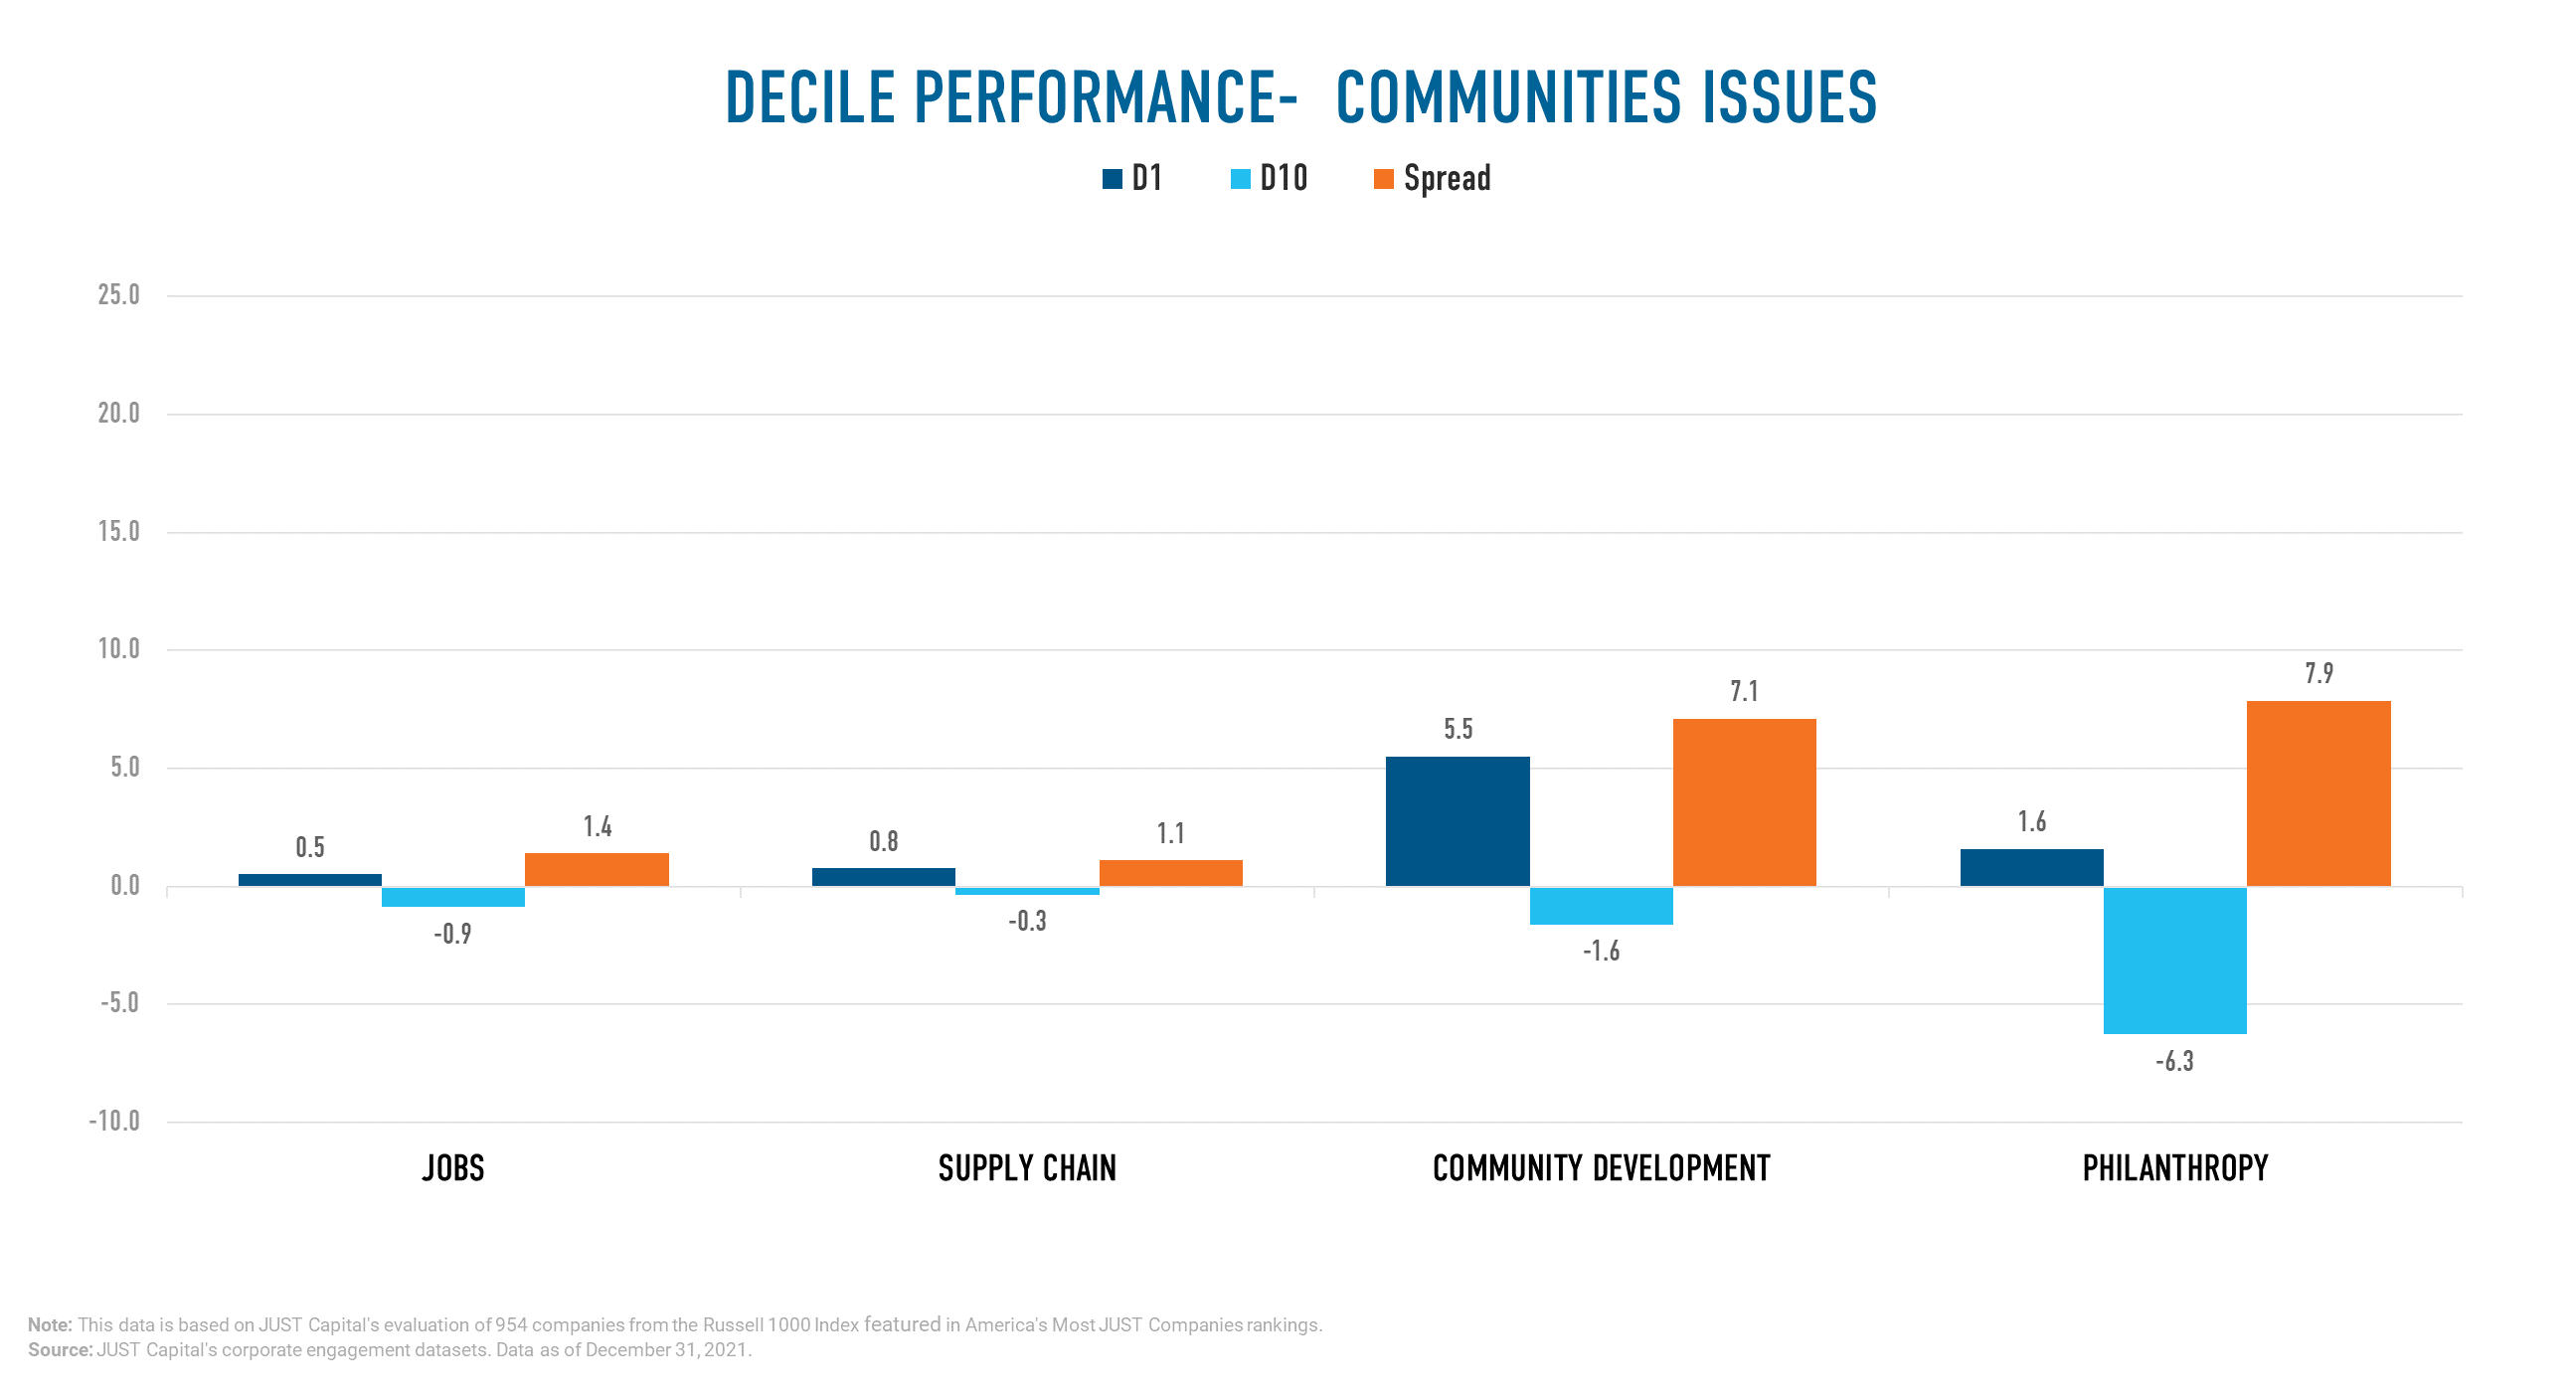
All issues within Communities were positive contributors to the stakeholder’s performance.
YTD we saw Philanthropy outperform other Issues within Communities. Shown below are the both top and bottom five contributors to the top decile (D1), the best-ranked companies as measured by their Communities score, and the bottom decile (D10), the worst-ranked companies as measured by their Communities score.
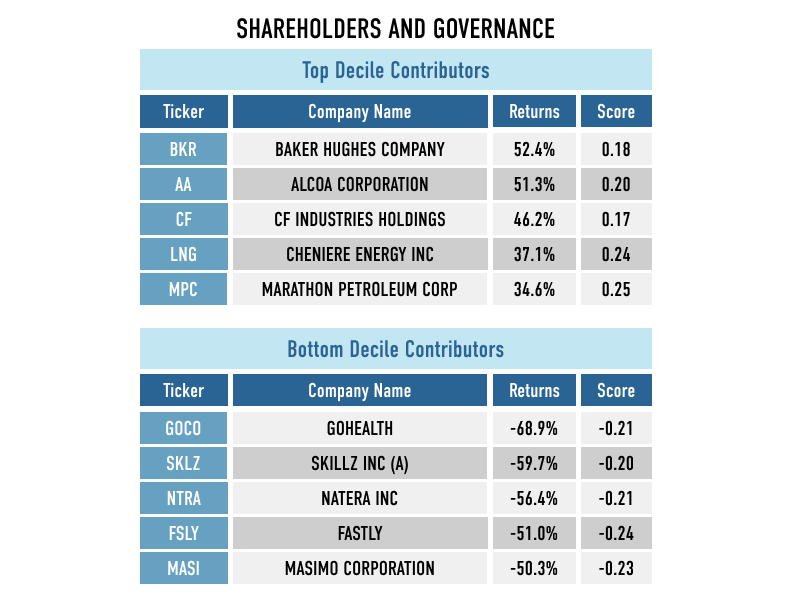
The Shareholders and Governance stakeholder measures a company across three Issues:
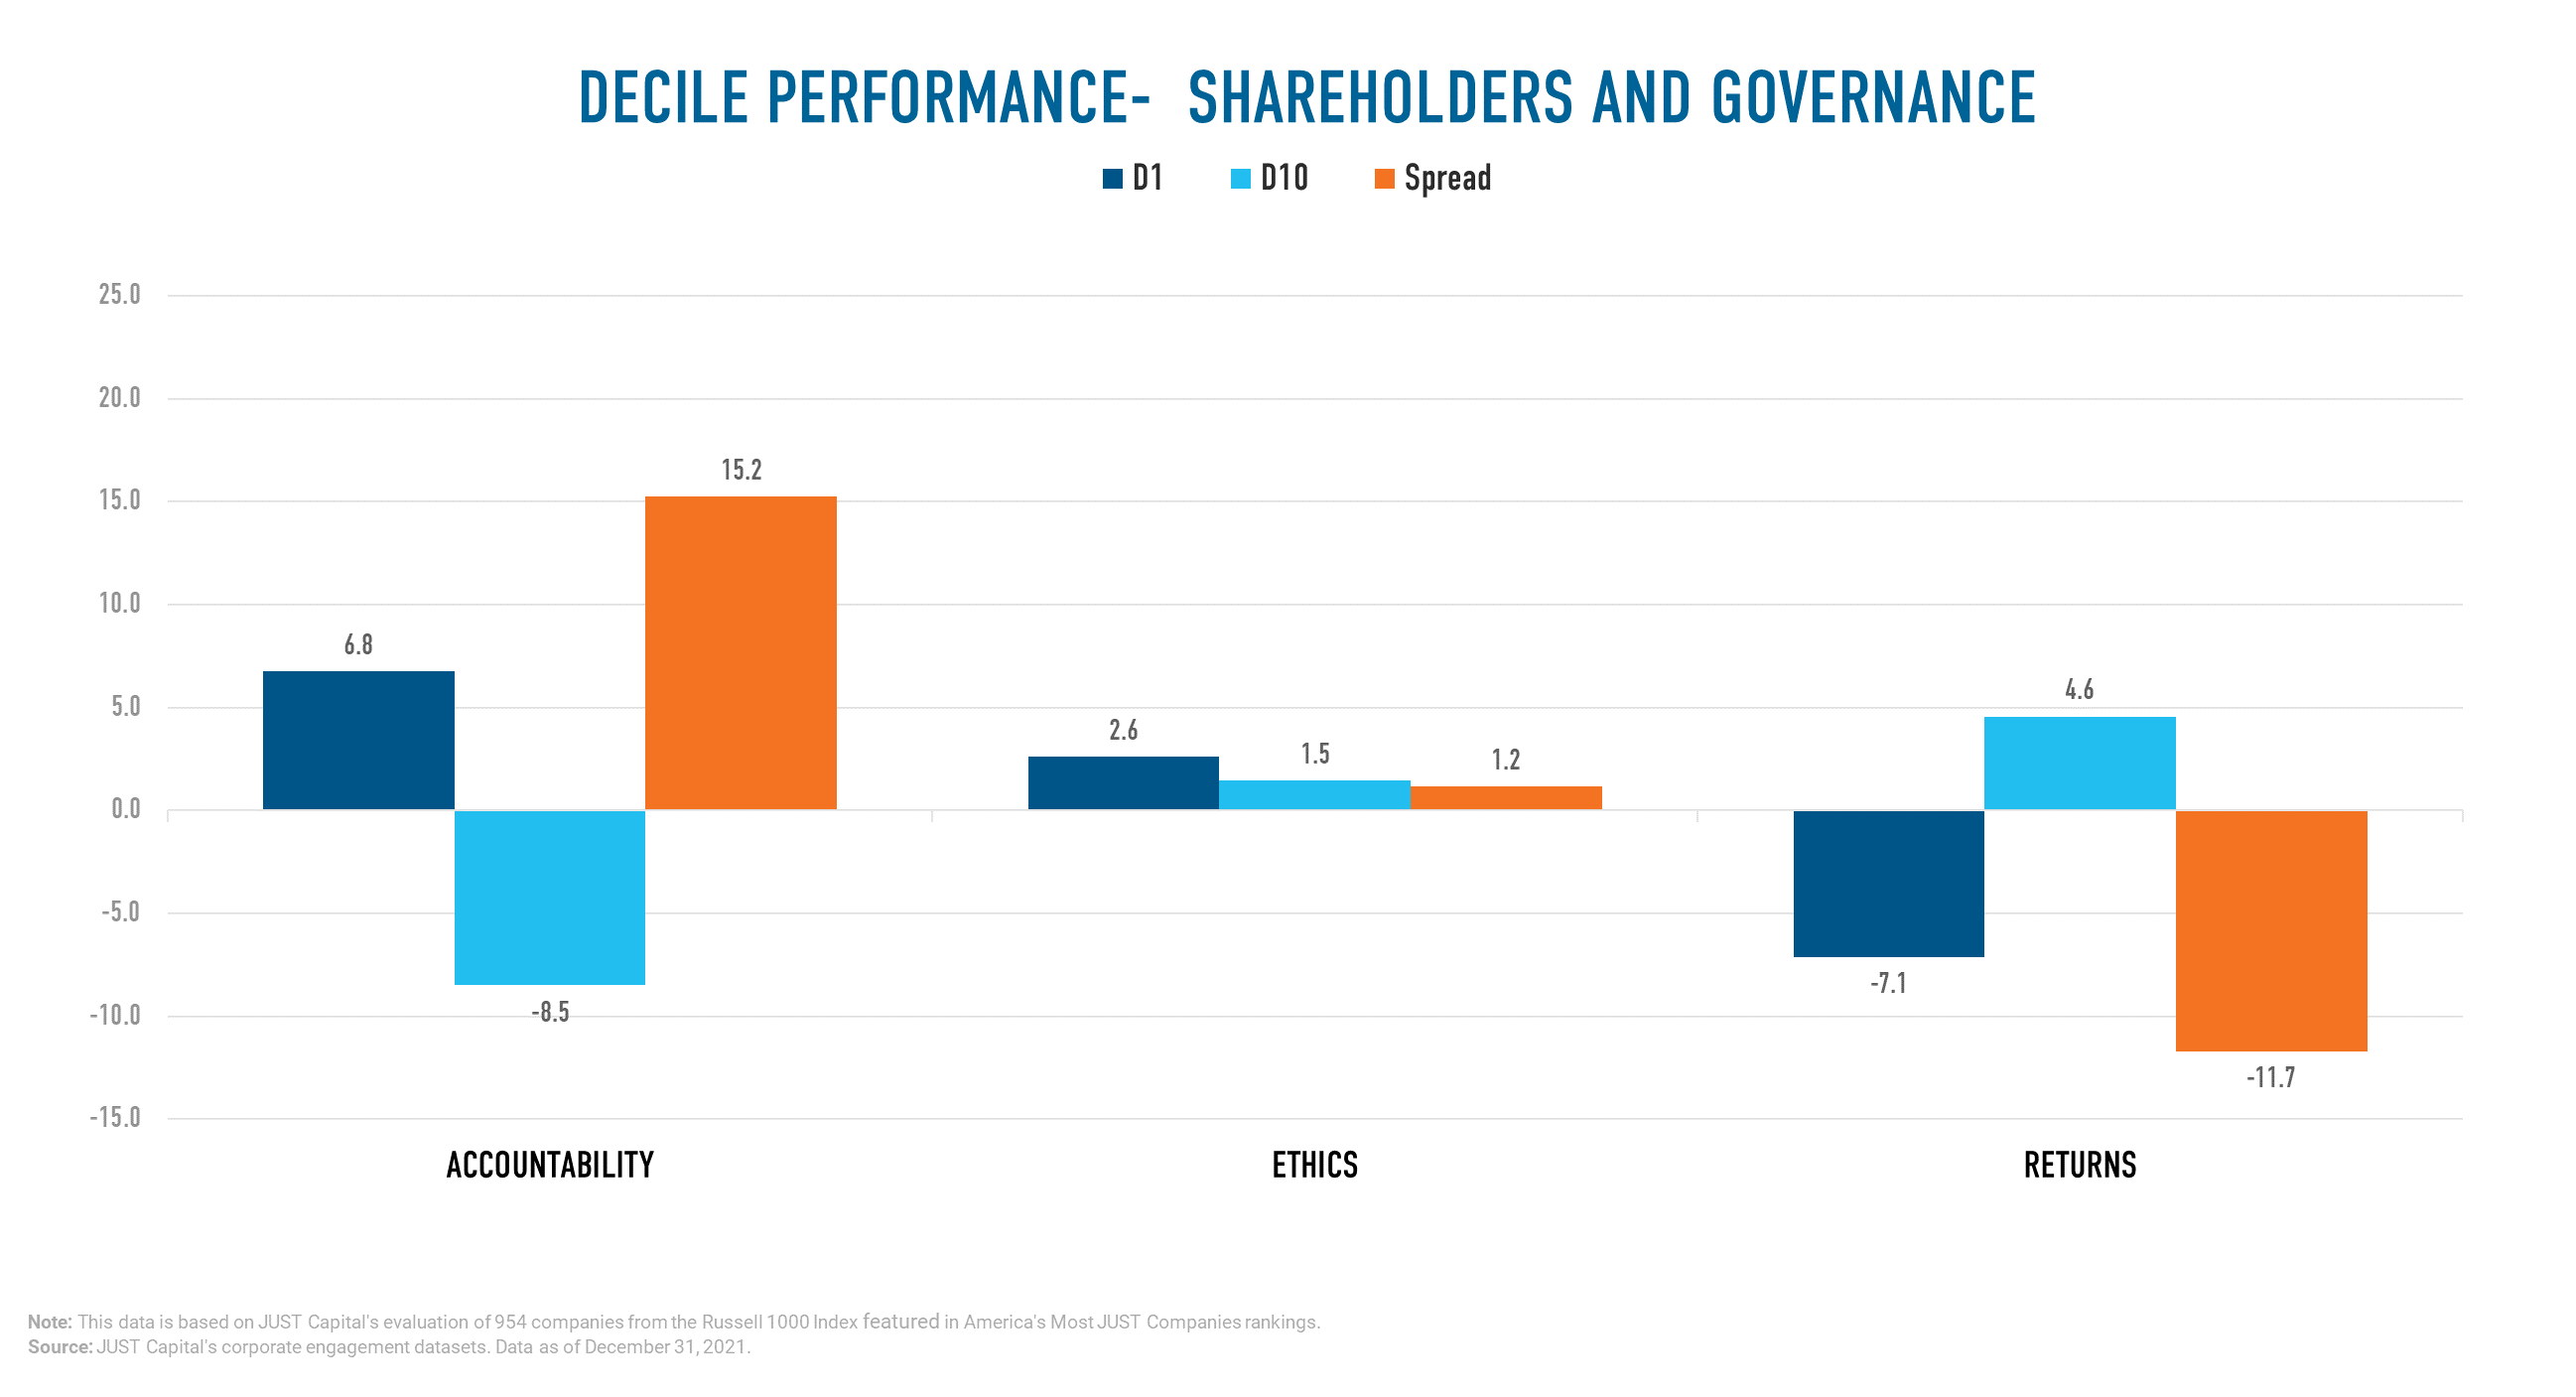
YTD we saw Accountability outperform the other Shareholder and Governance Issues, with a long-short spread of 15.24%. Returns was a negative contributor to performance, and Ethics exhibited close to neutral performance.
Shown below are the both top and bottom five contributors to the top decile (D1), the best-ranked companies as measured by their Shareholders and Governance score, and the bottom decile (D10), the worst-ranked companies as measured by their Shareholders and Governance score.
The Customers stakeholder measures a company across four Issues:
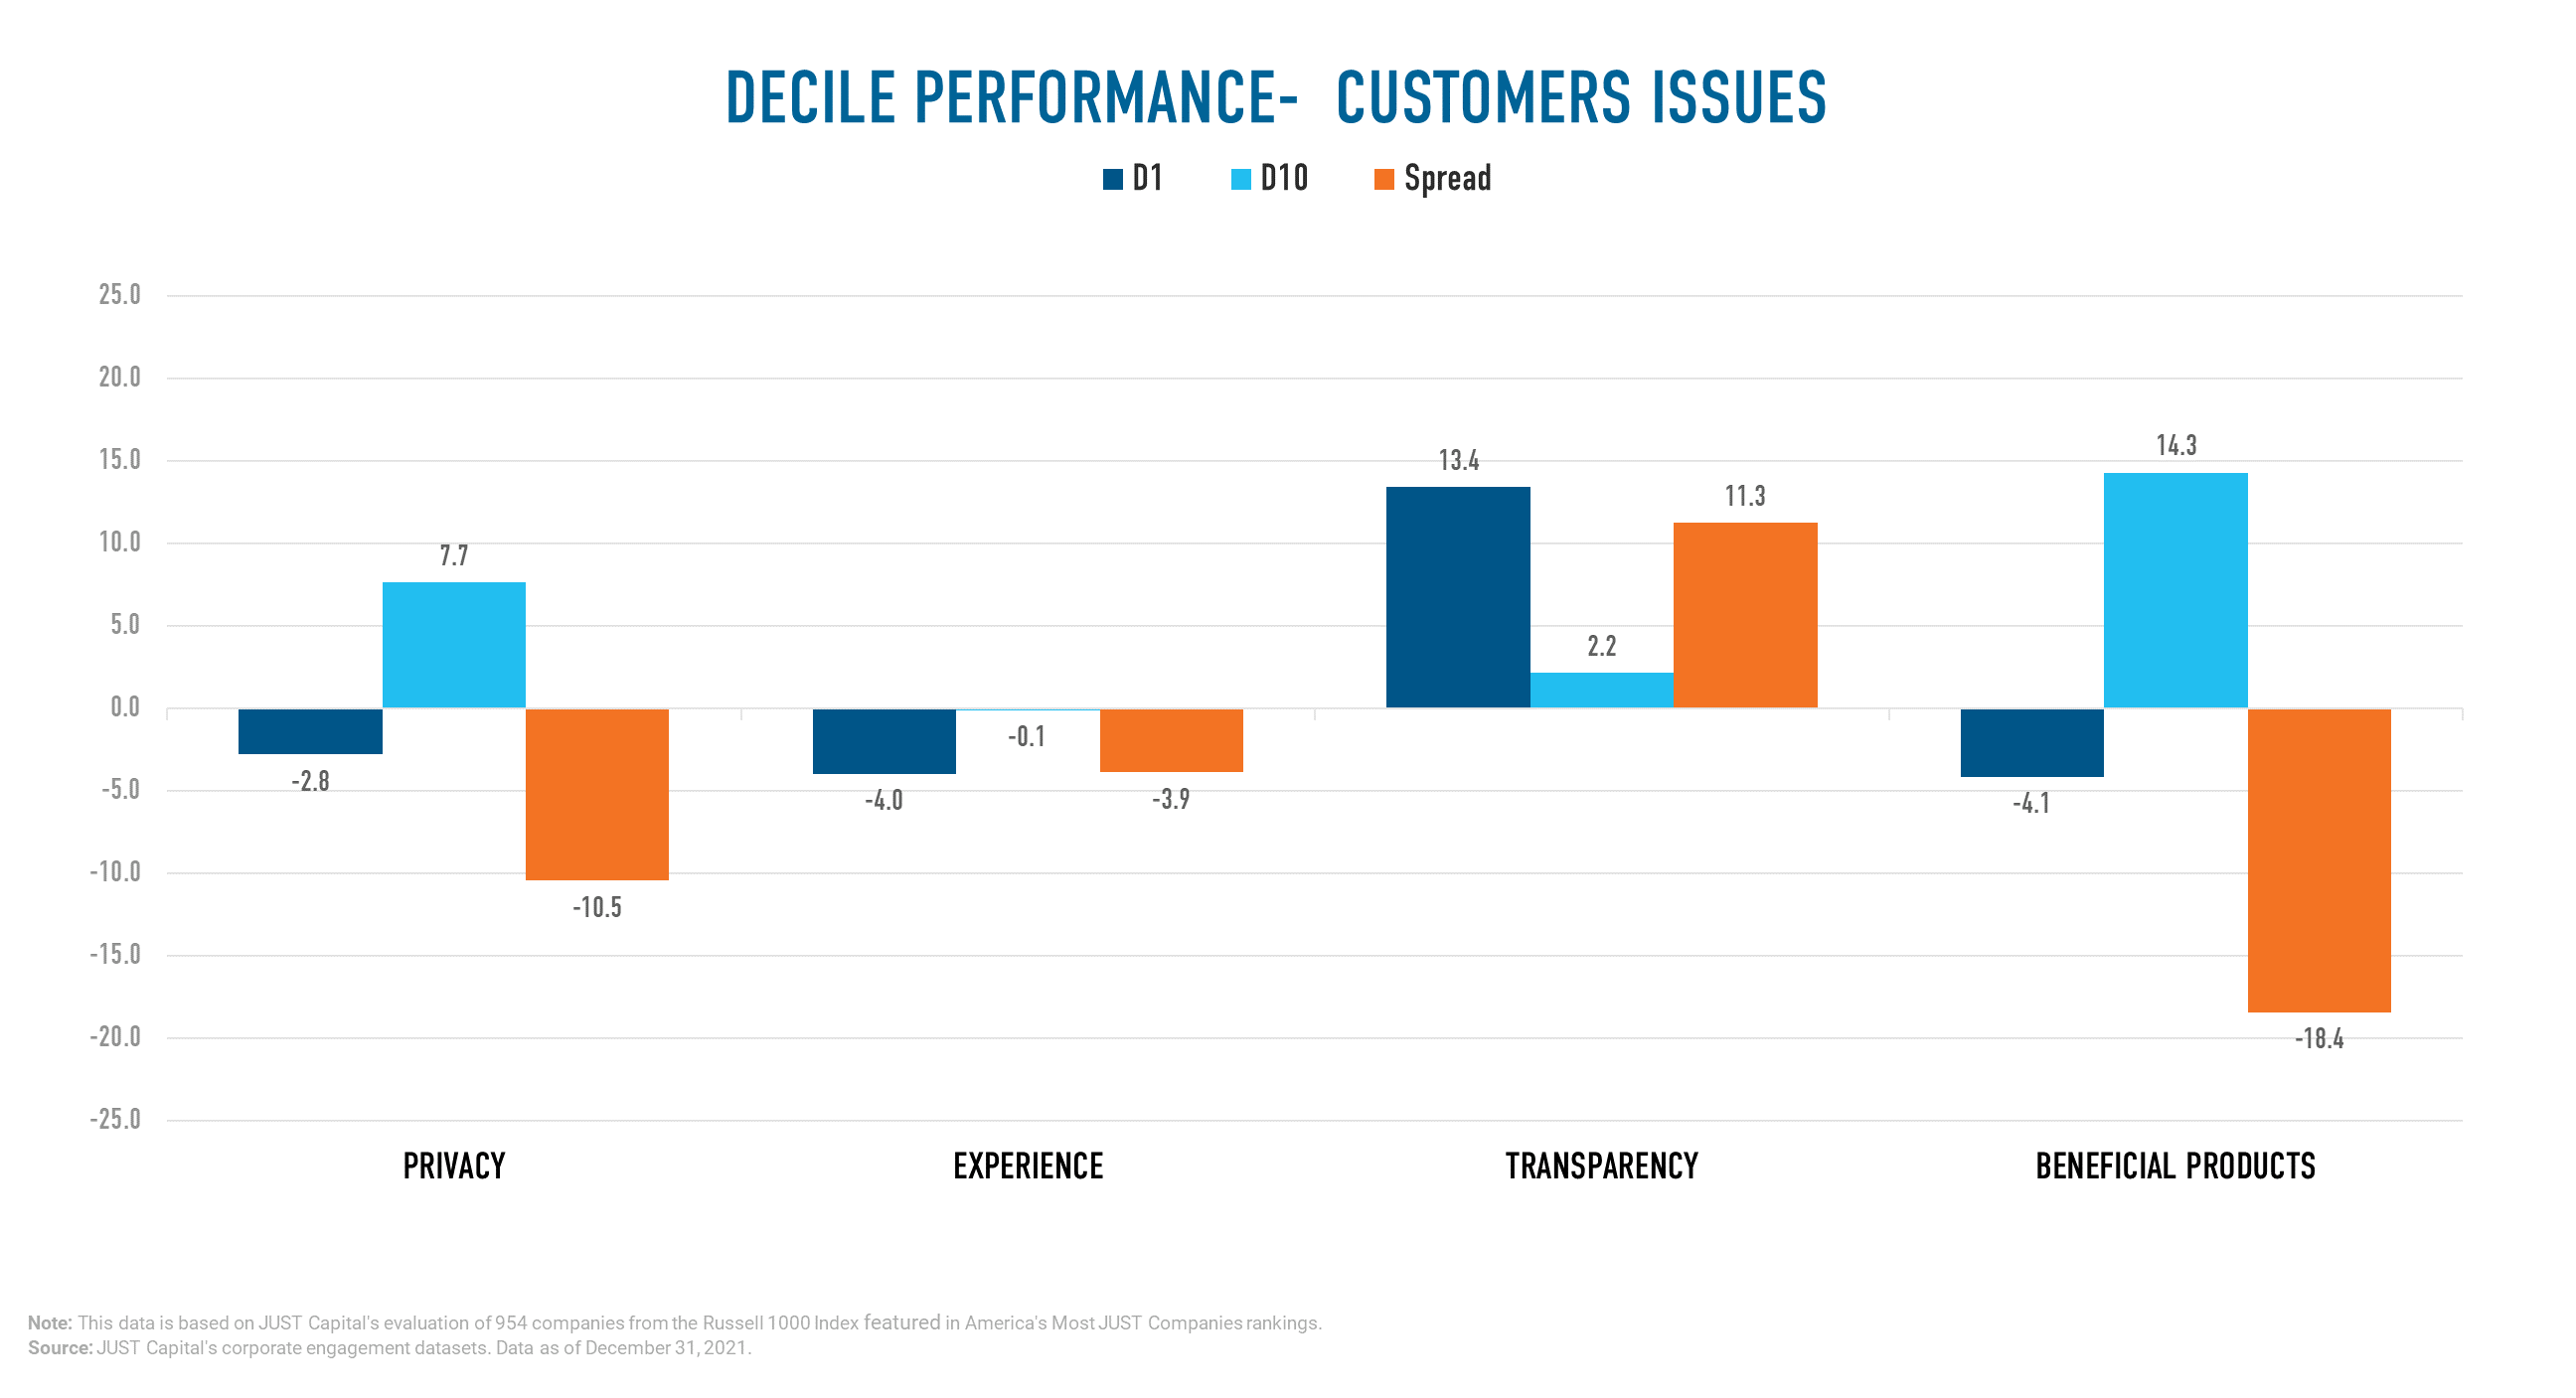
YTD we saw the Transparency outperform the other Customer Issues with a long-short spread of 11.26%. Beneficial Products, Privacy, and Experience were negative contributors to Customer performance.
Shown below are the both top and bottom five contributors to the top decile (D1), the best-ranked companies as measured by their Customer score, and the bottom decile (D10), the worst-ranked names as measured by Customer score.
The Environment stakeholder measures a company across four Issues:
YTD we saw Pollution Reduction outperform other Environment Issues. Resource Efficiency was also positive, while Sustainable Products and Climate Change had negative performance.
Shown below are the both top and bottom five contributors to the top decile (D1), the best-ranked companies as measured by their Environmental score, and the bottom decile (D10), the worst-ranked companies as measured by their Environmental score.
Computation Methodology
We monitor the performance of these stakeholders and Issues on a long-short basis. The long and short portfolios are selected based on the factor scores as the top and bottom deciles within the universe of companies we track in the Russell 1000. Top decile (D1) companies are those that rank highest based on the factor score, and bottom decile (D10) companies are those that rank lowest based on the factor score.
D1 Performance is computed as (Equally weighted average of returns of stocks in D1 bucket) – (Equally weighted average of returns of all stocks within the Universe).
D10 Performance is computed as (Equally weighted average of returns of stocks in D10 bucket) – (Equally weighted average of returns of all stocks within the Universe).
Spread is computed as D1 Performance – D10 Performance.