More and more, there is a growing call to action for companies to rethink what it means to “do the right thing” – not only by their shareholders, but by their workers, their customers, their communities. Companies are being asked to more closely align their purpose with their profits, but there is an alphabet soup of CSR, ESG, and SRI terms and little clarity around how to measure something as vague as purpose.
Our work at JUST Capital seeks to not only define the key elements of just business behavior, but also demonstrate the business case – the proof behind purpose. The new year and new Rankings also bring an updated JUST U.S. Large Cap Diversified Index (JULCD) with fresh opportunities to look under the hood at the collective performance of the companies now included in the Index, quantifying current performance and providing insight into where corporate America is heading on the issues Americans care about most.
Following the 2018 release of America’s Most JUST Companies, our flagship index – the JUST U.S. Large Cap Diversified Index (JULCD) – in accordance with its methodology – was reconstituted on December 21 to reflect the updated Rankings. Comprised of the top 50% of performers in each of the 33 industries, the Index includes a total of 438 constituent companies, up from 424 in the prior year. Additionally in this year’s reconstitution, 107 stocks were added, 93 were removed, and the market value-based one-way turnover of the reconstitution was 12.5%. Of the companies we rank, 457 were not included in the Index.
An appendix is included below, reviewing the JULCD’s 2018 performance through traditional metrics of return, risk, attribution, and factor exposures, in an effort to provide a full portrait of the financial performance of these companies.
Forming the basis of our 2018 Rankings are a diverse set of 76 metrics stemming from seven key issues, which were defined through our annual survey research as top priorities for the American public. Companies in the JULCD Index – again, made up of the top 50% of companies in our Rankings by industry – perform well on the majority of these metrics, and compared with ranked corporations excluded from the Index, JULCD companies on average:
We’ve drilled down into each of these metrics – identified by the public as being central to just business behavior – to better understand the work these companies are doing align their profits with their purpose.
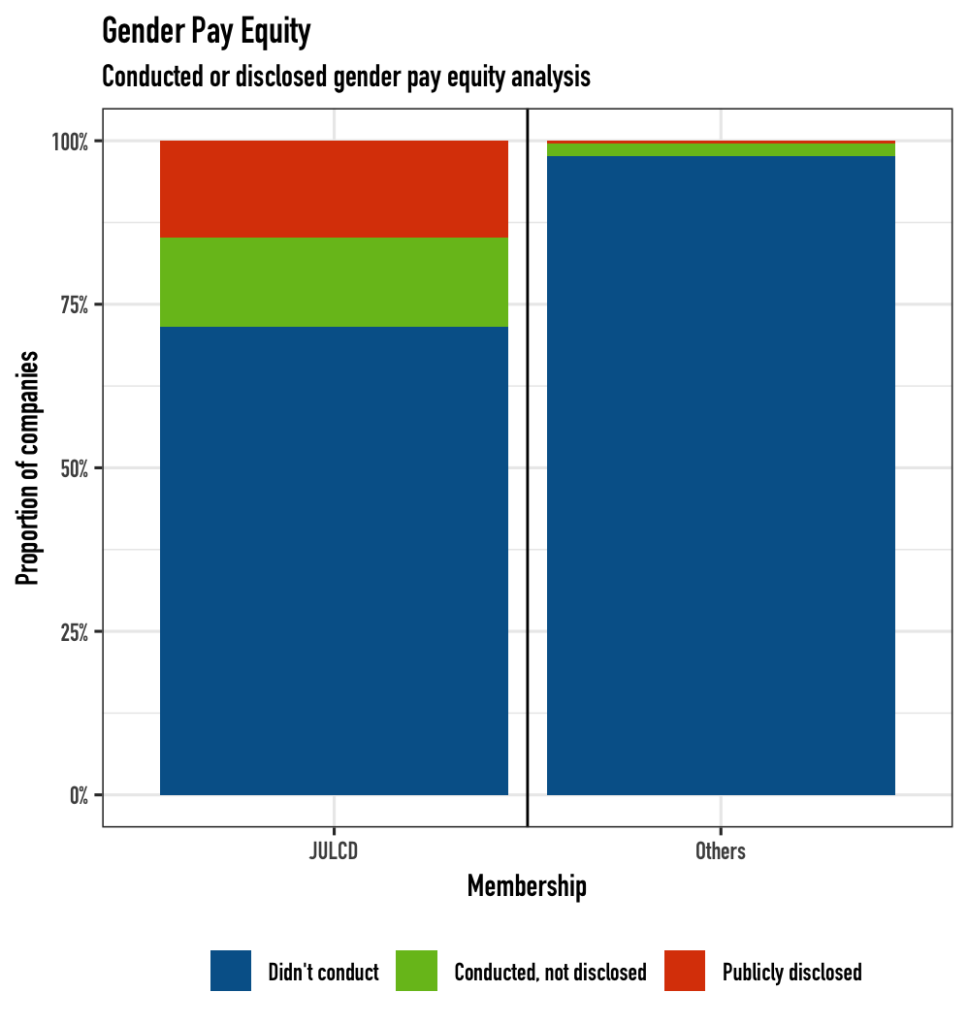
In our 2018 survey, the American public shared that a commitment to gender pay equity is a key element of just business behavior when it comes to addressing worker issues. While corporate America – including JULCD constituents – overall has a long way to go, companies in the Index perform notably better on this issue. 28% of JULCD constituents have performed gender pay equity studies, including 15% that have publicly disclosed the results. In contrast, only 2.5% of excluded companies have performed such studies.
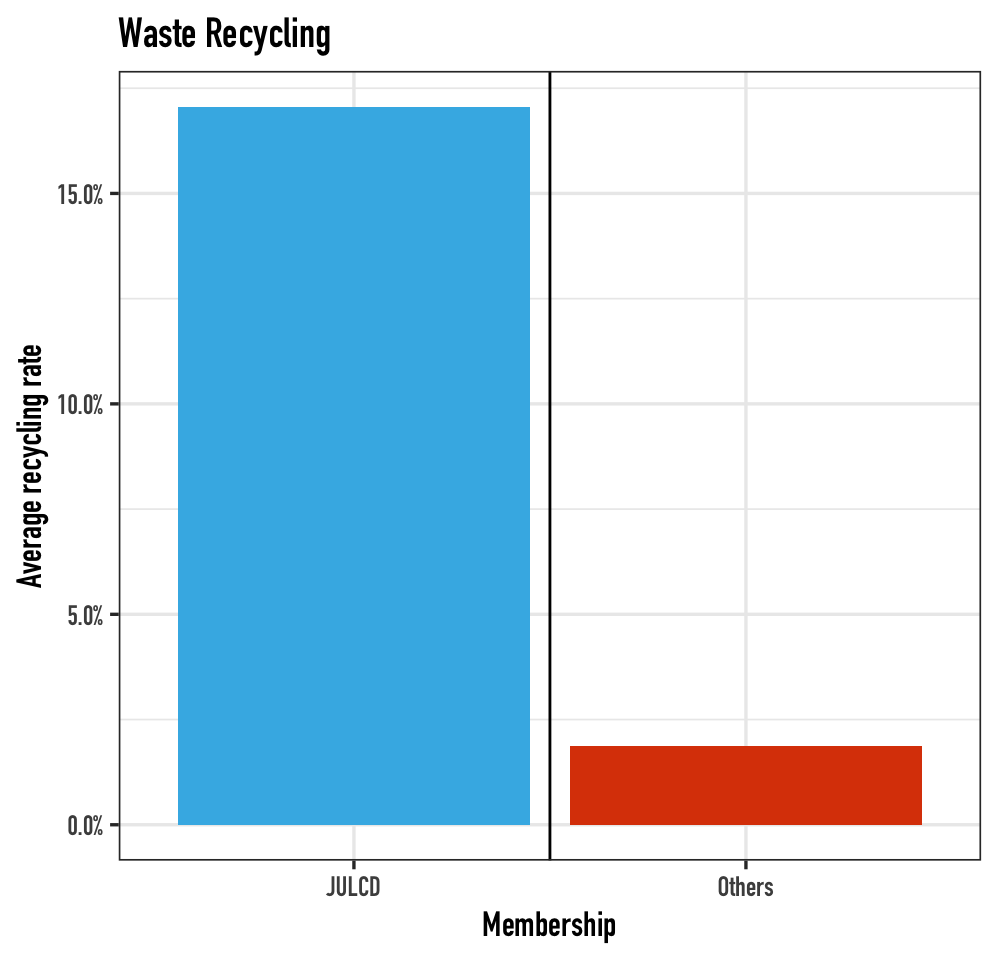
When it comes to measuring environmental impact – another key element of just business behavior according to Americans – recycling and waste management plays an important role. JULCD constituents are much more likely to recycle than excluded companies, and do so at higher rates. In our Rankings, any company that doesn’t disclose its recycling rates is assigned a value of zero. While 125 JULCD constituents report recycling rates, only 17 of excluded companies do so, and the average JULCD recycling rate of 17% is 9x higher. The average recycling rate of the 125 JULCD recyclers is 59% while the average rate of the 17 other companies is 50%.
For our 2018 Rankings, we have gathered or estimated the compensation of the median worker for the companies we rank. This metric can be aggregated across groups of companies by taking the mean or median of included companies. As shown below, whether one uses the mean or median of all JULCD constituents and compares it with that of all ranked companies not in the Index, the median worker of JULCD constituents earns approximately 7% more than that of companies not in the Index. Perhaps most importantly, for workers at the lower end of the wage scale, the median worker pay for the bottom 10% of companies in each group favors JULCD members by 11%.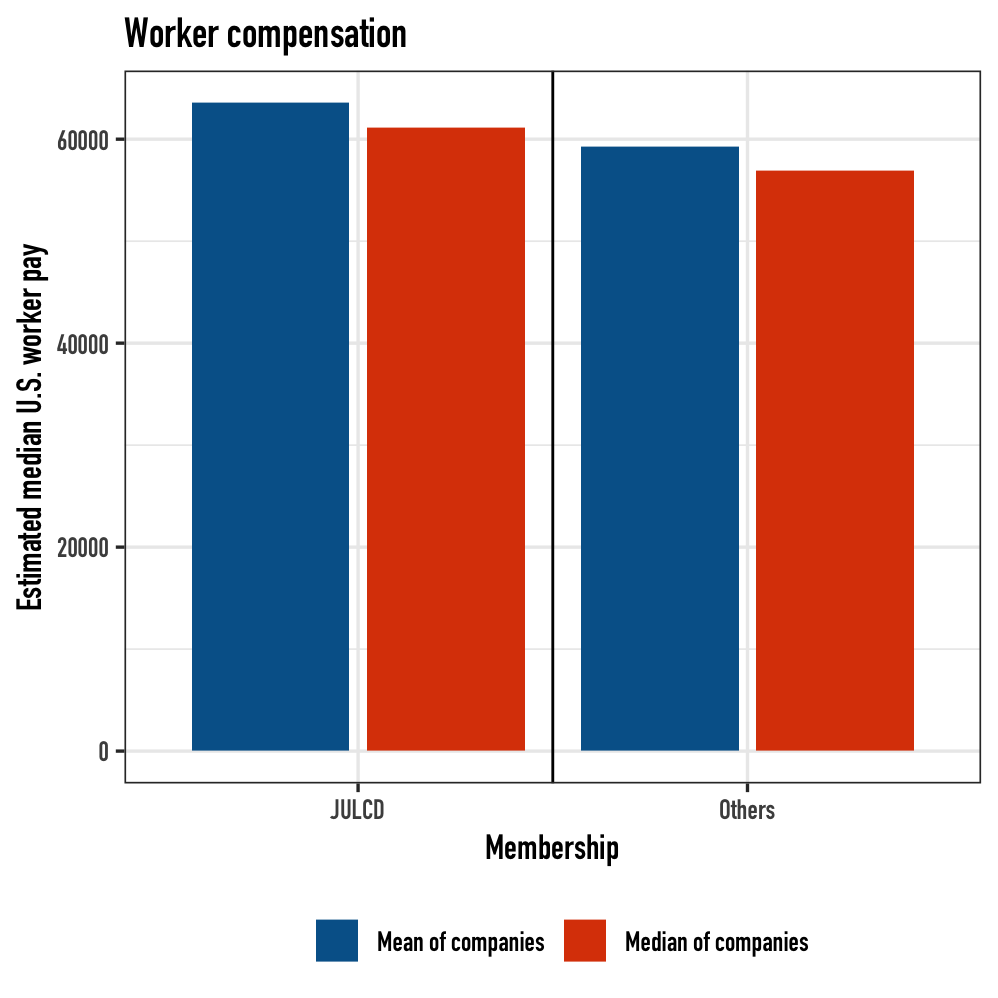
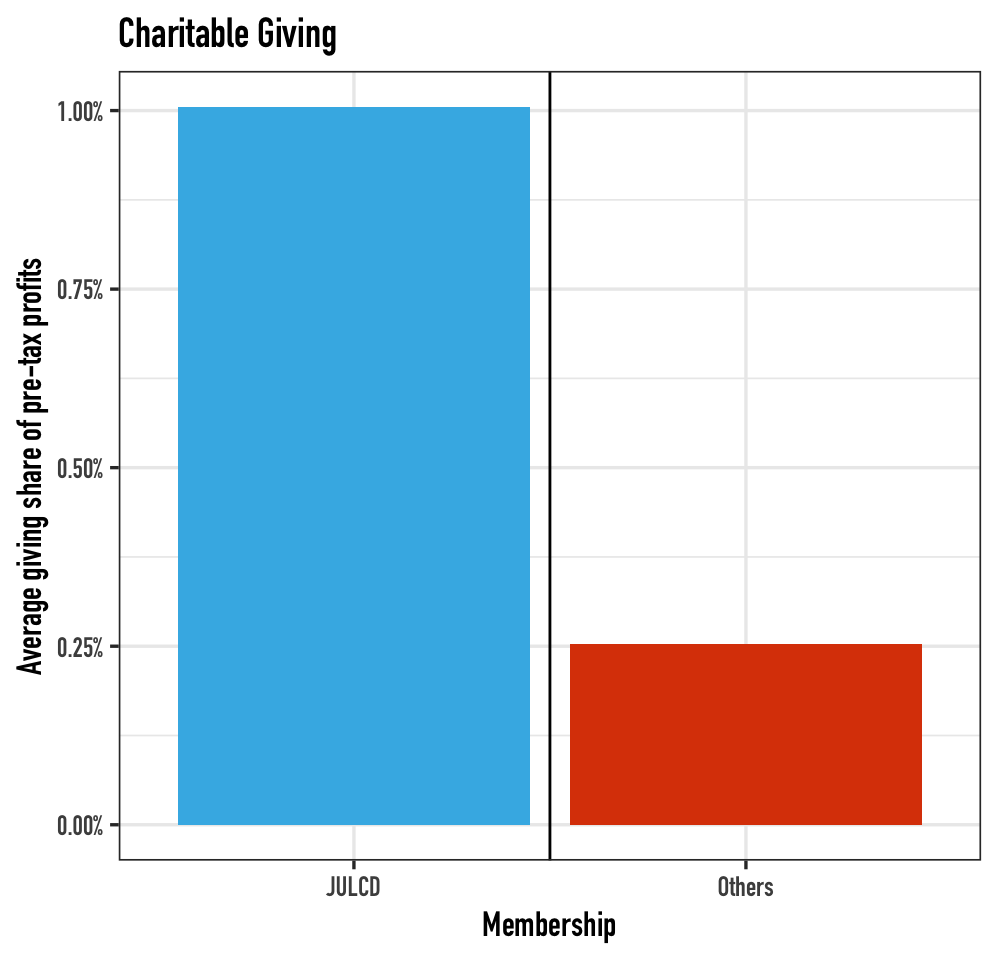
Americans also agree that community support is central to being a just company – including giving to charitable causes.. As with the recycling metric, companies that do not disclose their charitable contributions are assigned a value of zero. 263 companies in the JULCD disclose their giving, compared to 83 of excluded companies, and on average, JULCD companies give 1.01% of their pre-tax profits, while excluded companies only give 0.25%. Digging in further, while the average giving rate of the 263 JULCD givers is 1.66% it’s just 1.39% for the 83 excluded companies.
In addition to worker issues, the American public has identified job creation – both worldwide and in the U.S. – as an important measure of just corporate behavior. On average, JULCD constituents employ 2.7x more U.S. workers than excluded companies do (32.7k compared with 12.3k). Based on medians they employ 1.9x more (9.8k vs 5.2k).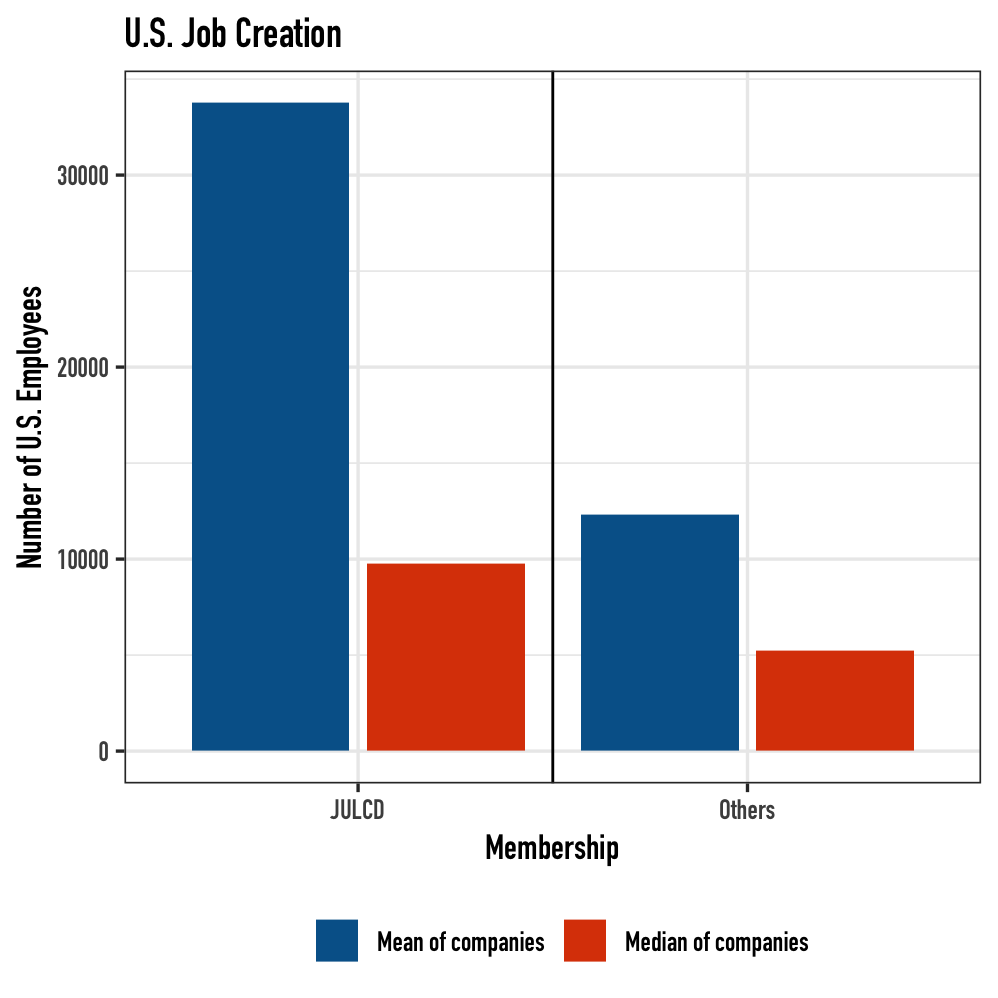
In addition to decent compensation, Americans agree that just companies should offer quality benefits, including work-life balance – including flexible working hours and day-care services. As shown, 71% of JULCD constituents offer at least one of these benefits, more than 2x as those companies not in the Index. In addition, JULCD constituents are 8x more likely to offer both benefits.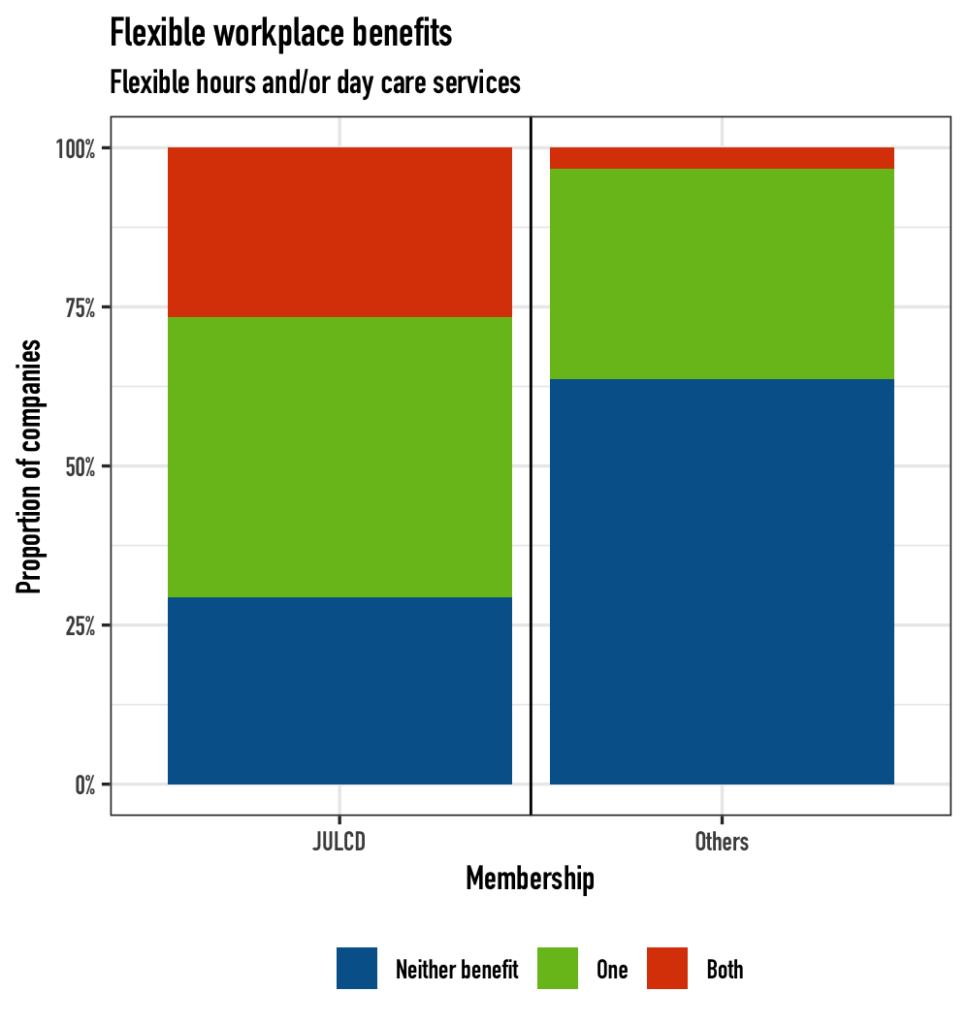
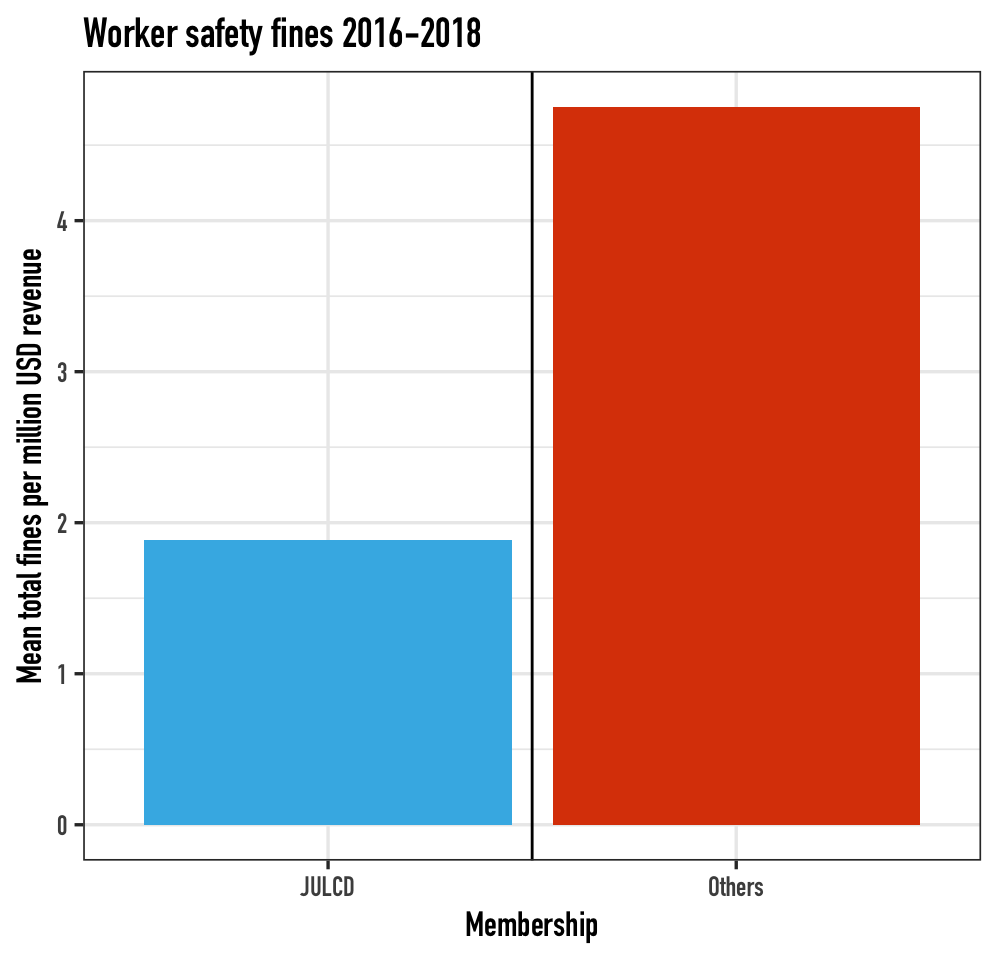
Americans agree that workers are entitled to a safe working environment, and in order to measure corporate performance on this issue, JUST Capital tracks worker safety fines imposed on ranked companies by OSHA and the Mine Safety Administration. This chart shows the average of such fines for JULCD members, as well as excluded companies, over the three years ending May 2018. On average, JULCD constituents were fined 60% less per million dollars of revenue than companies not in the Index. While the prevalence of fines across both groups is comparable, the scaled fined amount for JULCD members is 65% lower.
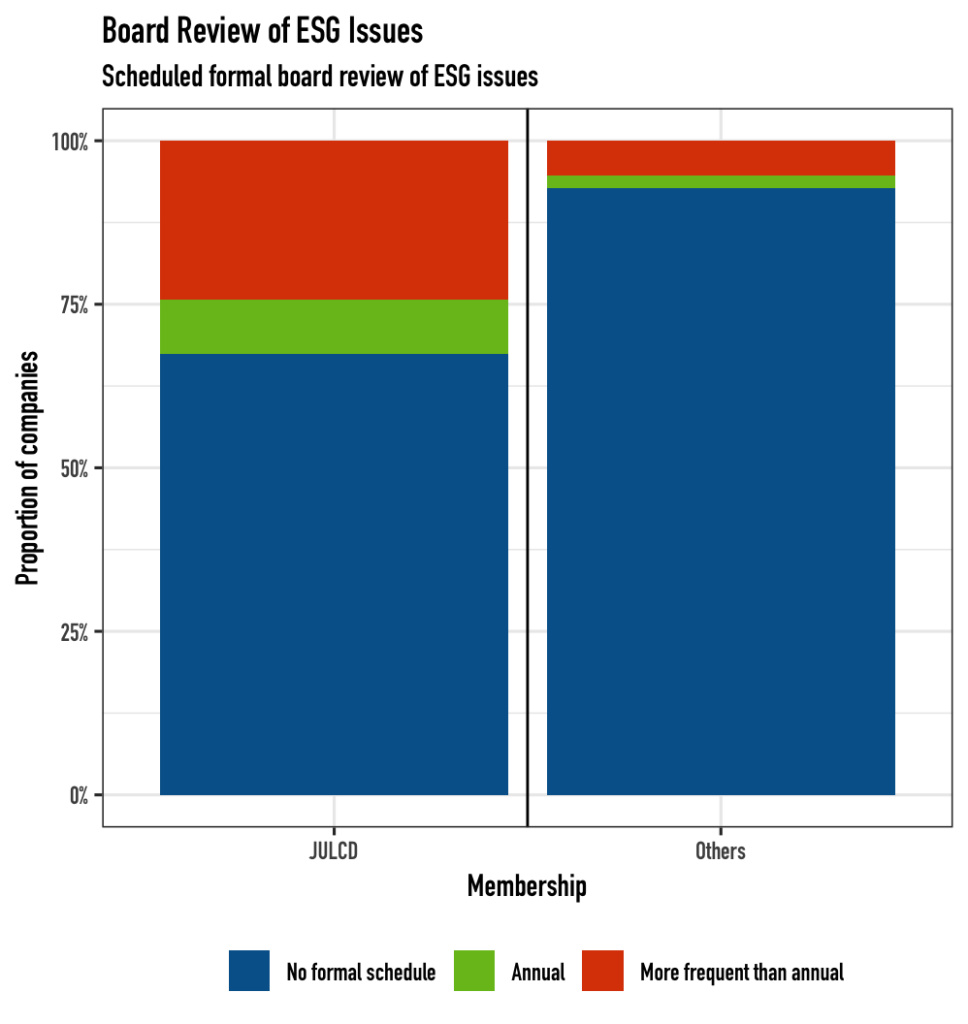
In tracking corporate performance on leadership issues, JUST Capital evaluates the oversight that boards of directors have of environmental, social, and governance (ESG) issues. We’ve tracked whether boards have a formal schedule to consider such issues, and the frequency of those meetings – as shown in the chart. Overall, one third of JULCD constituents have a formal schedule to consider such issues, which while still far too low, is 4x more than excluded companies.
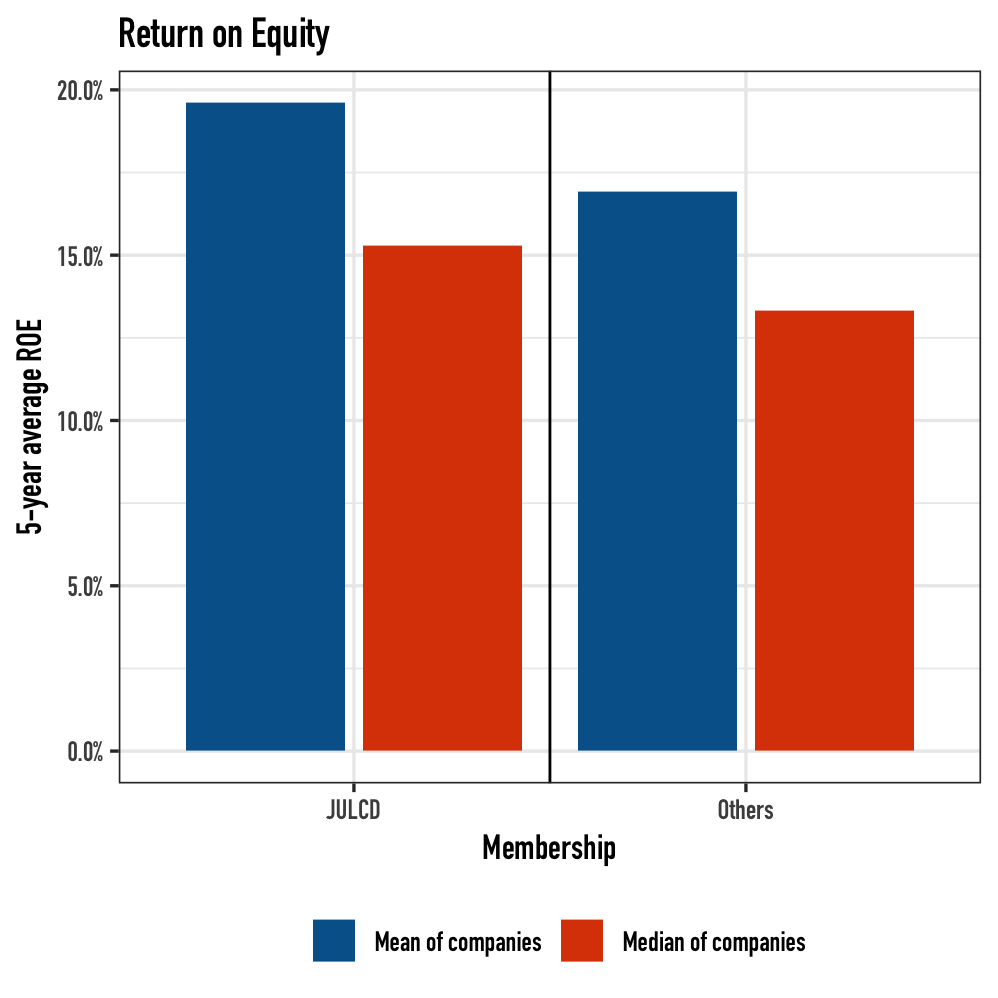
In tracking leadership issues, our ranking methodology also includes profitability, an issue which is of course critical to management and investors. Based on 5-year average return on equity (ROE), JULCD constituents also outperform excluded companies. On average, JULCD constituents have delivered a 19.6% ROE compared with 16.9% for excluded companies. JULCD constituents also outperform based on median ROE, returning 15.3% compared with 13.3% for excluded companies.
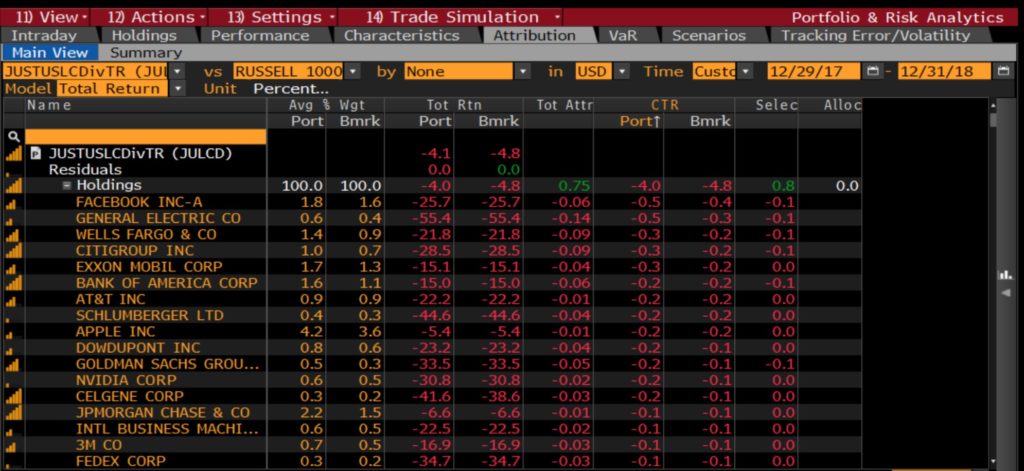
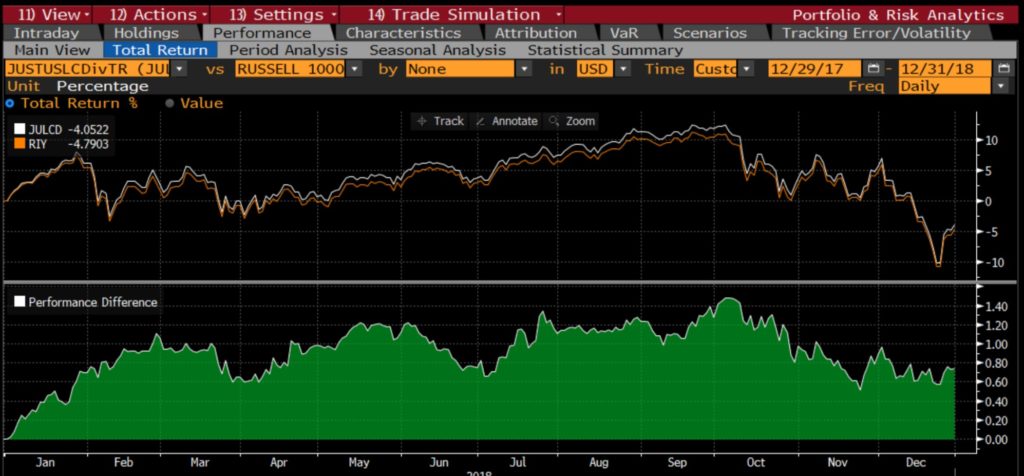
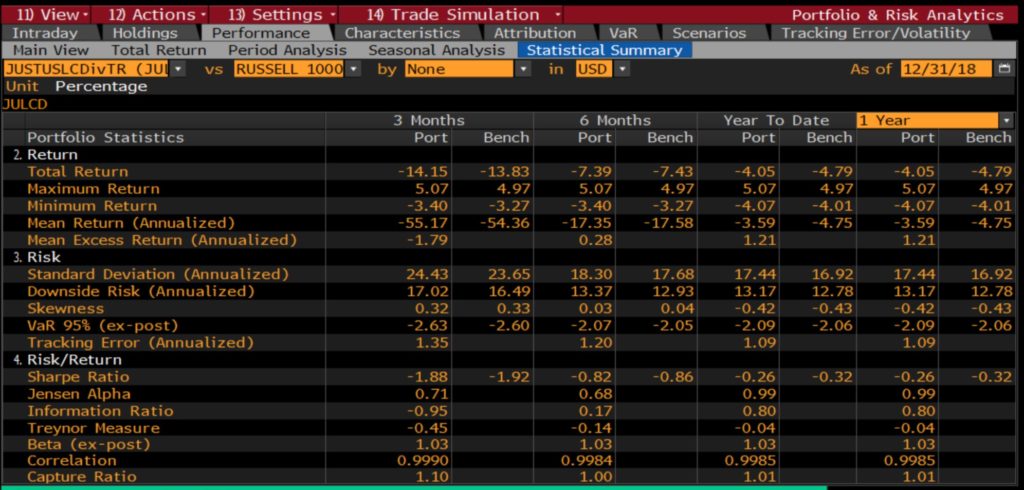
We examine JULCD’s key 2018 market performance indicators below, based on Bloomberg analytics.
In the worst-performing year for US equities since the Global Financial Crisis, the JULCD index outperformed the Russell 1000 by 74 basis points. JULCD’s volatility was comparable to the Russell 1000’s, tracking error was moderate, its Sharpe ratio was higher than the Russell’s, and IR was 0.8.
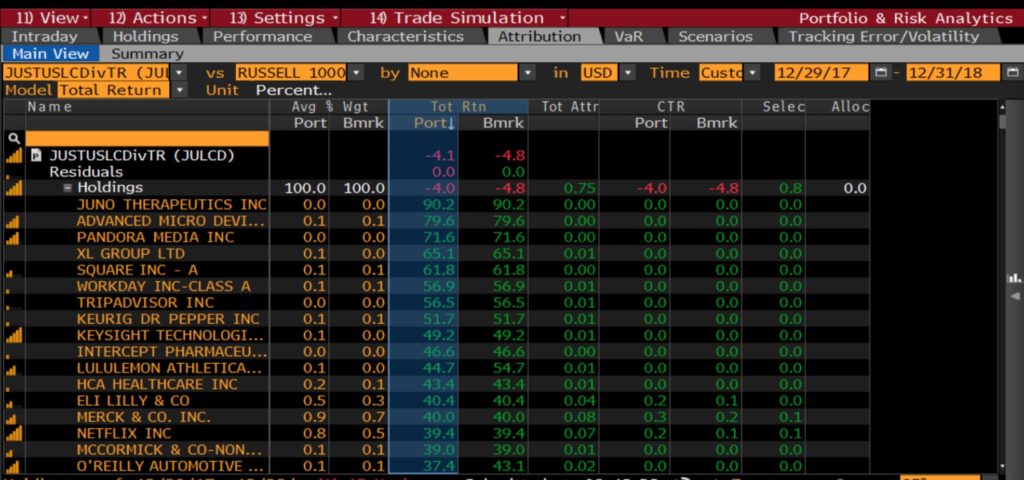
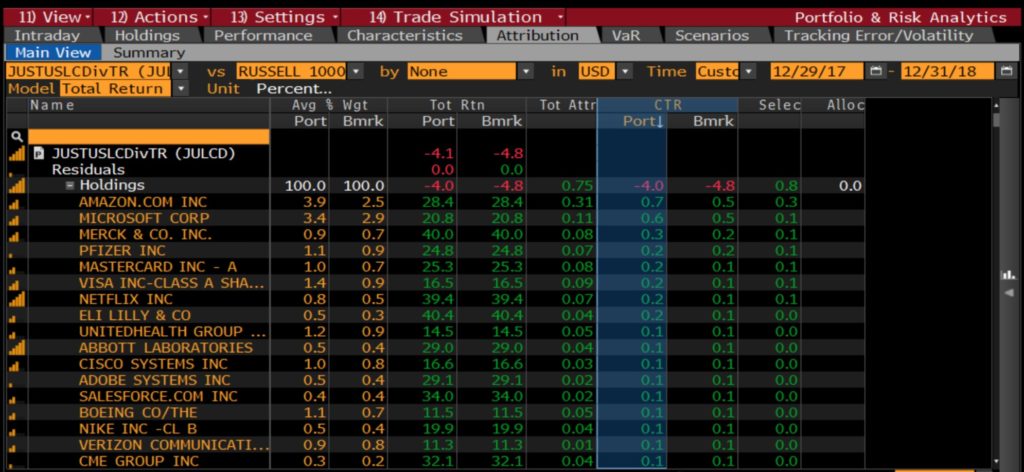
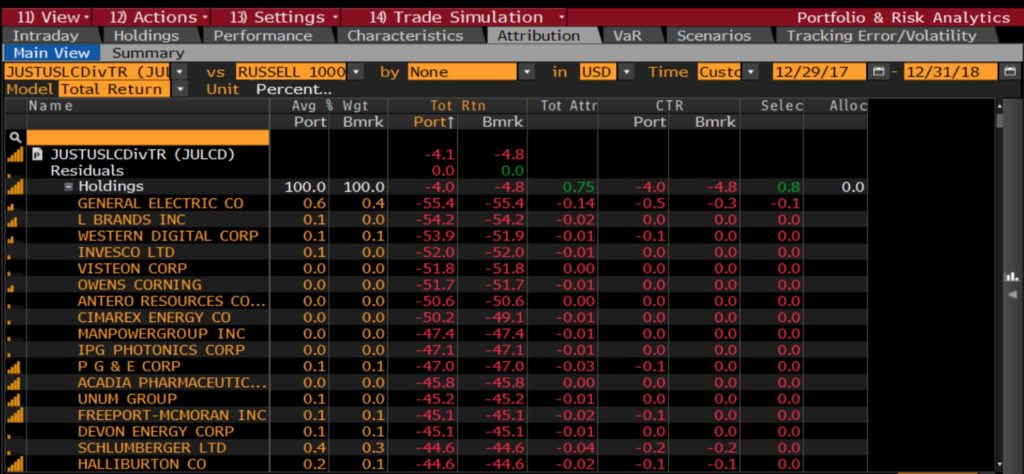
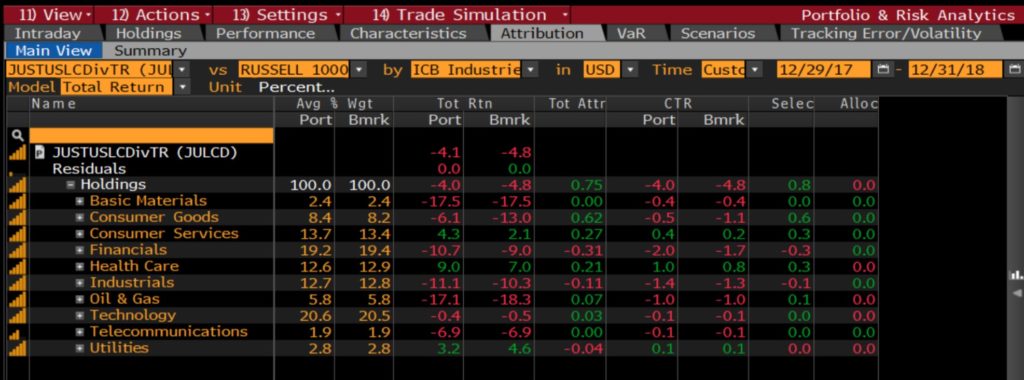
Due to its industry-neutral methodology, the source of the JULCD’s outperformance is entirely due to stock selection. As shown below, there were no industry allocation effects in 2018, and the JULCD’s stock composition added value or was neutral relative to the Russell 1000 in eight out of 10 ICB industries. Three industries had significant outperformance: Consumer Goods, Consumer Services, and Health Care, while Financial constituents lagged.
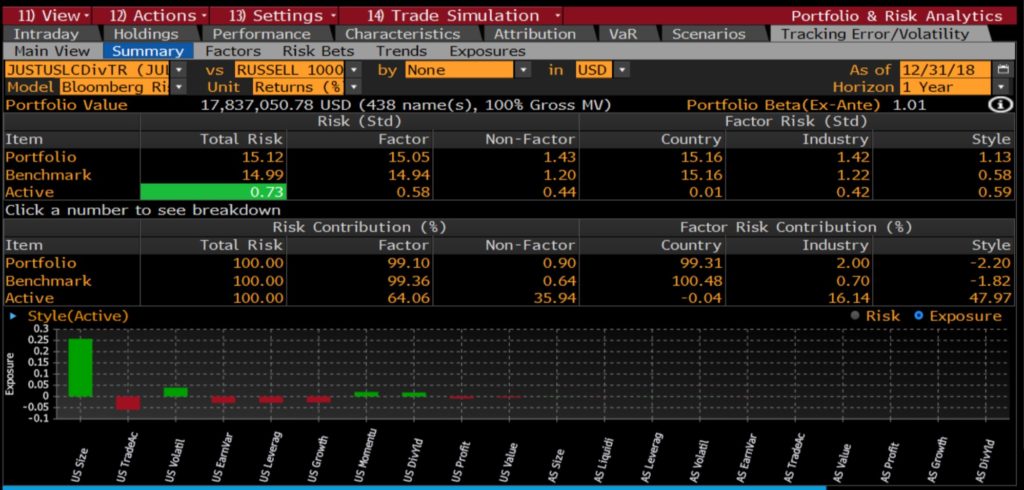
Based on the Bloomberg risk model and current JULCD index composition, JULCD’s ex-ante beta is 1.01 while its active risk is 73 bp. The only significant style factor exposure is to U.S. Size (large cap tilt).