
According to Morningstar, U.S. ESG funds experienced net outflows in both 2023 and 2024, reversing a decade of growth as traditional sustainability strategies face mounting skepticism. The latest data from GS Sustain also points to 23 consecutive months of outflows for North American sustainable equity funds. Amid this retreat, I’m excited to share that JUST Capital’s stakeholder-focused approach is demonstrating remarkable resilience as of June 30, 2025.
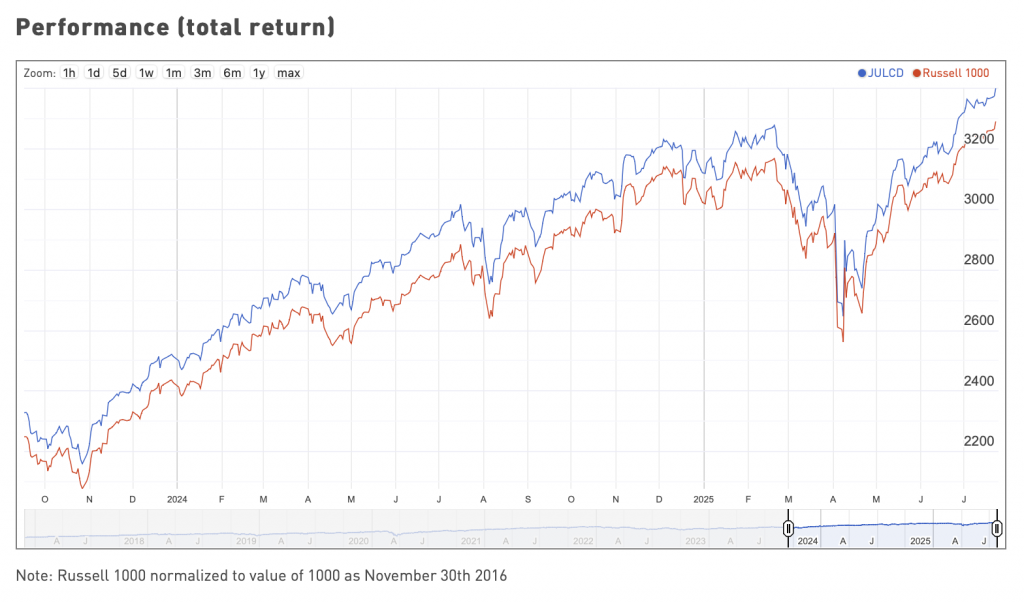
Since inception in December 2016 the JUST U.S. Large Cap Diversified Index (JULCD) has delivered cumulative returns of 231.9%, outperforming the Russell 1000 Cap-Weighted Index by 11.4 percentage points. Meanwhile, our JUST 100 Index has generated an impressive 49.7 percentage points of alpha over its benchmark, with returns of 125.7% versus 76.1% for the Russell 1000 Equally Weighted Index since March 2019.
We also see persistent outperformance at the company level. Those in the top decile of JUST overall scores have outperformed their counterparts in the bottom-decile by a remarkable 90.2 percentage points since January 2018. Notably, companies that prioritize worker investments – providing fair wages, comprehensive benefits, strong health and safety protections, robust training and advancement opportunities, and fostering inclusive workplaces – see the biggest dividends. Top-decile performers in our Worker stakeholder have generated a spread of 129.7 percentage points over their bottom-decile peers since January 2018.
Investors are noticing the opportunity. While traditional ESG investing has declined, the JUST ETF attracted net inflows in both 2024 and year-to-date 2025.
All of this is supported by our proprietary research, which points to an “efficient frontier” of stakeholder performance that varies by industry, by financial measurement, and by the underlying stakeholder issue in question. If you’d like to learn more, please reach out.
Be well,
Martin
Business Insider reports that several U.S. senators are pushing Delta for more information on their new pricing plan, which aims to use AI to set ticket prices.
Fortune looks at how the overwhelming increase of bots on the internet – accounting for 50% of all internet traffic last year – is poised to become more of a problem as AI proliferates. More inside.
Bill Gates, Steve Balmer, and others are putting $1 billion over the next 15 years into “AI for good” to support people who work in undeserved jobs like parole officers, social workers, and more. The American Bazaar has the story.
The Wall Street Journal looks at the growing number of technology companies aiming to upend food delivery with AI powered robots.
Fortune reveals that researchers from top AI companies are warning that they’re losing the ability to understand how their AI is thinking.
The New York Times examines how the immigration crackdown is straining the caregiving industry, particularly senior centers in the U.S.
GM’s profits shrank by $1.1 billion due to tariff impacts. The Wall Street Journal has the story.
Inc. looks at the pushback Starbucks is receiving from its new RTO mandate – which would ask many of its corporate employees to relocate to Seattle or Toronto within 12 months.
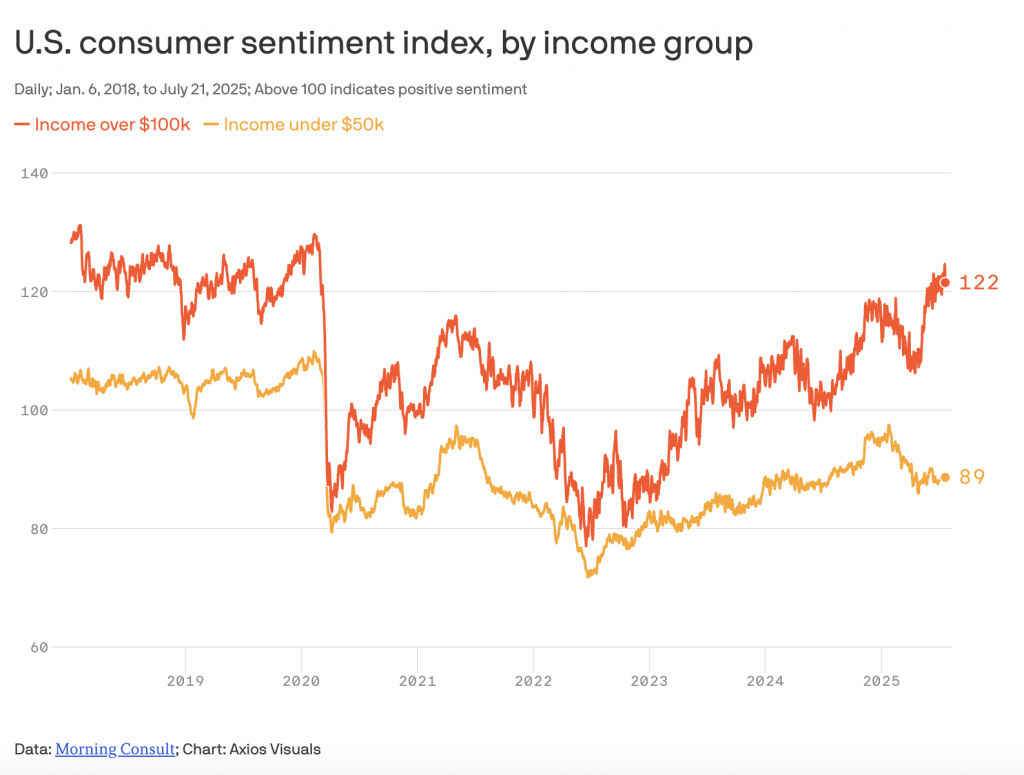
Axios looks at the growing sentiment gap between rich and poor Americans and finds the divide growing wider than it has in many years. Explore the findings here.

Human capital management (HCM) is an important consideration for the many institutional investors who believe that analysis reflecting how a company’s workforce is managed can impact long-term value. Institutional investors are increasingly recognizing the potential materiality of workforce-related metrics such as turnover, strong benefits, diversity, health and safety, and pay equity, and many believe these factors provide insights into intangible value, operational stability, talent retention, and innovation capacity. However, institutional investors often struggle to acquire the right data to effectively compare individual firms and industries. Additionally, in the United States, HCM disclosures remain limited and are mostly subject to disclosure only at the company’s discretion. For decades, before expanding principles-based rules several years ago, the Securities and Exchange Commission required only the disclosure of one specific metric – the number of employees – and even that failed to account for gig workers and contractors or to adequately delineate other non-traditional employment models, such part-time or seasonal workers.
This report synthesizes insights from 14 institutional investors – seven asset owners and seven asset managers – who manage and invest assets for funds ranging in size from $50 billion to the trillions. It explores how investors approach HCM data, the challenges posed by limited disclosure, their view on the materiality of HCM data, and how they navigate these barriers in their stewardship and engagement practices.
This report is based on interviews with 14 institutional investors, divided equally between asset owners and asset managers. Participants represented a range of management styles, including passively managed portfolios tied to indices and actively managed funds that consistently incorporate HCM metrics into their strategies.
The seven asset owners participating in the survey included the Office of the New York City Comptroller, the Office of the Illinois State Treasurer, and the California State Teachers’ Retirement System (CalSTRS), while others elected to anonymously respond. Asset owners ranged in the amount of internally managed assets they held, from as little as none to more than 90%. The seven asset managers participating included Schroders PLC, Zevin Asset Management, EOS North America of Federated Hermes Limited, and four anonymous respondents; they tended to manage all of the assets they held internally, and more than one manager provided engagement and stewardship services to other funds for assets that they did not control.
The topics covered in the survey interviews included the investors’ use of HCM data, their views on its materiality, and the challenges they face in accessing actionable information. Investors shared their thoughts candidly, often drawing on specific examples from their work.Since participation was voluntary and the report’s primary stated focus when recruiting participants was HCM metric issues, funds that value HCM and are willing to provide their time and perspectives on the issue are likely overrepresented here. For that reason, the report likely has a bias toward self-selecting the funds most interested in HCM issues. While the respondents may not be representative of the average institutional investor, there is still value in understanding their perspective since several of the HCM topics do receive high levels of support from shareholder proposals. These areas receive tremendous attention and public commitments from companies during engagements, and they highlight central HCM topics that funds with less of a focus on HCM issues do pay attention to (albeit to a lesser extent), as evidenced by shareholder proposal voting and voting policies throughout the investor sphere. Ultimately, the perspectives shared in this report represent the vanguard of investor work on HCM issues while not necessarily representing institutional investors as a whole.
Many investors see HCM as interconnected with other stewardship issues. Each investor was asked to name their fund’s top priorities so we could understand where HCM issues fit in with their broad stewardship goals. Overall, their responses show that HCM’s prominence in investor priorities reflects its far-reaching implications across various dimensions of stewardship and performance.
The key themes highlighted in this section illustrate how the participants prioritize stewardship issues that span governance, environmental challenges, workforce management, and social equity. Together, they reflect a holistic approach to managing risk and creating long-term value across their portfolios.
Governance and Board Oversight
Governance remains a foundational concern, encompassing board diversity, effectiveness, independence, and accountability. Investors prioritize ensuring that boards are equipped to oversee key risks and drive long-term value creation. Several investors emphasized the importance of diversity in leadership, most commonly expressing the need for racial and gender diversity but also naming other categories like diversity of age, perspective, and thought. Most often investors cited:
Climate and Environmental Risks
Several respondents reported prioritizing climate-related risks and opportunities, particularly in industries transitioning to sustainable models. Metrics like carbon accounting, water usage, and biodiversity impact were frequently raised. Just transition issues represent a nexus between climate and HCM because as climate-responsive policies dictate changes in energy sources and use in particular, many companies and investors are also focusing on how to lessen the affected industries’ negative impact on communities and workers, including how to support these groups in transitioning to other jobs and industries. Most often investors cited:
Human Capital Management (HCM)
Investors widely recognize workforce-related issues as central to operational stability and long-term value creation, citing turnover, diversity, health and safety, and freedom of association as critical metrics. Additionally, they connect workforce health and safety to operational integrity and productivity, emphasizing the need for metrics on injury rates, safety policies, and employee well-being. Most often investors cited:
Diversity, Equity, and Inclusion- (DEI-)Related Issues
Although DEI-related issues have become a lightning rod for many companies and investors, the surveyed investors’ interest in workforce culture, engagement, productivity, training, and satisfaction – factors that underpin many serious DEI programs – remains relatively intact. Several participants expressed the belief that racial and gender diversity can drive innovation and talent retention and that the diversity of the board and management ranks are meaningful metrics to assess a company’s efforts on representation and its governance strategies. These participants argued that better data is needed on representation, recruitment, and retention across demographic categories, and they reported discussing these issues during company engagements and in data requests to companies. Most often investors cited:
Corporate Accountability and Human Rights
Corporate accountability, including transparency in lobbying and aligning policies with stakeholder interests, emerged as a common theme. Some investors also tied this to broader human rights concerns. Most often investors cited:
Institutional investors incorporate HCM data into a variety of activities, from proxy voting to engagement and investment analysis. However, the participants expressed that the lack of standardized disclosures limits the effectiveness of these efforts.
Specifically, when respondents were asked to agree or disagree with the following statements:
Investors highlighted several metrics as particularly valuable for understanding workforce dynamics:
Marina Severinovsky of Schroders further explained how HCM ties into financial outcomes that investors can use to outperform other managers:
From our research on HCM, we found three key areas that impacted alpha greatly: employee sentiment and culture, board diversity, and employee compensation and turnover. These metrics link together to form a fuller picture. Compensation fairness, living wages, inclusion, and culture all contribute to employee sentiment, which is linked to turnover and directly impacts P&L.
Emily DeMasi of EOS at Federated Hermes Limited spoke about the intersection of metrics like turnover and demographic information, as well as its usefulness for assessing the quality of workforce management. When their stewardship team has that information, DeMasi said, they take cues from those disclosures and it impacts their votes on board members and shareholder proposals:
Our decisions are more around stewardship and voting decisions, and similarly, it would help us understand where gaps exist in talent. If you would break down a turnover number into more granular demographics, it could get us to whether we should really be pushing for inclusion instead of just diversity from a stewardship standpoint, and as far as voting decisions, we see more and more shareholder proposals related to worker voice, whether that be from a very basic freedom of association, neutrality shareholder proposal, and up to including a worker on the board. There’s a wide spectrum between those two things, but if we understood how well or poorly a workforce was being managed, then it would directly influence whether or not we would end up supporting those types of proposals or not, and whether we’d want to hold a board member [who’s] either part of the committee charged with overseeing these issues, or the chair of the nominating and governance committee. There’s not enough data out there to really inform those decisions the way we’d prefer.
One asset owner spoke about worker safety and its importance in ensuring that the company is managing employees well, keeping litigation costs low, and encouraging employee retention in dangerous fields:
Materiality is obvious in some industry- and company-specific metrics like cell phone towers owned by REITs and fatalities for workers. It is very complicated because contractors versus employees versus temporary workers hired by the property management company for that specific tower area are disclosed differently. Different terminology that companies use differently, but fatality rates are definitely material for companies and industries where injuries are most likely, like mining, construction, etc. We know these are material, but we don’t have the data. OSHA guidelines leave room for variability in what and how companies disclose, and it is resource intensive.
One asset owner noted that the information they look for spans multiple categories and enables them to fully understand how well a company is managing its workforce and policies by looking very broadly at a variety of data points:
We’re always looking for transparency. Every company should publish its EEO-1 report, disclosure of issues that show effectiveness of the company’s efforts to manage things like harassment and discrimination. We want demographic reporting, and information related to efforts in recruitment, promotion and retention by EEO-1 categories. We want to know about inclusive policies and benefits and whether the company collects and protects private information. We are in favor of freedom of association policies and labor and human rights reporting. The issues are different at different companies so we need a wide variety of information to compare.
Will Pomroy of Federated Hermes Limited explained their comprehensive evaluations across several metrics and on both an absolute and relative basis to peers:
There is definitely a lot of case-by-case analysis on what is particular to an individual business or sector. That said, within the ESG tear sheet that our analysts produce, there are common metrics that are looked at for each name to be considered for investment. They include employee turnover rates, employee accident rates. workforce diversity metrics, broken down by workforce as a whole and at management level, and an average pay or median pay metric included. All of those metrics are looked at, both on an absolute basis and on a relative-to-peer basis to help contextualize.
Another asset manager spoke of their detailed analytical process that compares metric performance among sub-industry peers:
We use many metrics, like turnover, professional development measured by training hours, percentage of work represented by collective agreement, health and safety, such as total recordable injury rate (TRIR) and fatalities, health and safety policies. We have our own proprietary models so we are only using the underlying data from the rating agencies providers and we go down to the GICS sub-industry. We have our proprietary materiality map of the material risks and opportunities from across the sub-industries. And we include the actual academic or industry evidence that backs it up so it’s super transparent for our investors. We go metric by metric across each one of the 163 sub-industries to determine if we have statistically significant enough coverage of this metric to include it into our model.
Several investors reported being very responsive to controversies that arise among portfolio companies. One asset manager described their HCM engagements as being led by idiosyncratic company issues or industry-level effects for metrics that don’t necessarily rise to the portfolio level, saying, “We really focus on controversies and issues that are material to the industry or the company in particular. We don’t do thematic engagements on HCM across our portfolios.”
The lack of consistent HCM disclosures imposes significant costs on investors, both direct and indirect. Some firms invest heavily in third-party data providers, while others devote substantial time and staff resources to filling information gaps and evaluating non-standard disclosures. Most investors dedicate significant time and money to collecting and analyzing HCM data but are unable to provide specific costs because they don’t segregate costs from their other stewardship data and engagement activities. However:
One asset owner detailed the inefficiencies created by inconsistent data:
It’s hard to quantify, but in terms of time it requires five to seven hours a week in terms of trying to amass and validate info. EEO-1 report searching is time-consuming because it’s not in a standardized place or location. In terms of opportunity cost, it’s very hard to benchmark companies against each other, to target the worst versus best, which is a good thing to know as a universal owner. Instead, we are left to guess who is a laggard, and ultimately that’s not impactful.
Investors participating in the survey almost uniformly described the state of U.S. HCM disclosures as inadequate, citing a lack of standardization, incomplete data, and companies’ resistance to sharing meaningful metrics. As one asset owner articulated:
The state of disclosure is absurdly deficient. Because it isn’t standardized, you can’t use it for making investment decisions. Even for stewardship and voting decisions, the lack of clarity means sometimes spending weeks drafting proposals and negotiating, only to end up with data that isn’t decision-useful.
Another asset manager summed up the frustration with the current state of HCM data:
It’s inconsistent and sparse, varied by industry and maturity of the company. Most of the data that is available are not the best indicators of performance or risk/opportunity management. It’s hard to gauge what is good performance versus bad, which metrics are comparable versus those that vary due to industry or business model considerations.
Emily DeMasi of EOS at Federated Hermes Limited highlighted the deficiencies in the way data is disclosed:
It’s just fragmented and uncomparable. We see more data being disclosed, but not in a way that allows us to make the decisions that I think investors want to make on that data. If I could only have one data point, what would it be? It would be turnover, and it is shocking how few companies actually disclose a turnover number, voluntary or involuntary. When you see that number over time, it gives you a lot of insight into how well the human capital is being managed in any company and then you would be able to see it across peers.
Will Pomroy of Federated Hermes Limited spoke about the large differences he sees in the U.S. versus U.K. markets:
I see, sitting here in the UK, the basic lines in a financial statement such as personnel expenses are easily identifiable and straightforward to get a sense of, actually, what is the cost of labor for that business and how productive is that time and how does that then interrelate with employee turnover rates and accident rates and the like. You can begin to get a reasonable first impression of the company’s human capital management practices, whereas in the US, I think one struggles to begin to piece together that initial picture to then be able to dig deeper to form a more detailed view.
Another asset manager noted that it seems like progress has been slow for certain movements:
It’s very weak. The HCM required disclosures in the proxy statement from the SEC is not uniform, so it makes it difficult to use as a point of comparison and we don’t have a lot of other information. We have spent a lot of time trying to get companies to disclose racial and ethnic composition of the board and that seems like it should have been solved many years ago. We’d like to be talking to companies in depth about their workforce issues but there’s just very little information out there.
Karen Kerschke of the Office of the Illinois State Treasurer added that the lack of data creates challenges in engaging with companies:
During engagements, companies will often assure us that they are performing better on HCM than other companies, but there is no way to verify such claims without public disclosure that is comparable between the company and its peers.
One asset manager stated:
Within human capital, there are questions like, are there safe and lawful working conditions, are there whistleblower mechanisms, protection of freedom of association? That’s baseline. How are they from an industry standard perspective, looking at their compensation and benefits, what is their strategy around that in terms of board governance, and then in best practice, what are their talent pipeline initiatives? So we’re looking at it a couple of different ways because you just can’t quantify it with one.
Another asset manager spoke about some positive changes in disclosures over time:
We have been pleased to see an increase in qualitative disclosures on HCM and DEI, and appreciate that many of the largest employers in our portfolio disclose in alignment with our guidance. We find Ethan Rouen’s research on the relative lack of HCM disclosures across the market useful.
Several investors cited the work of the Human Capital Management Coalition (HCMC), a network of over 30 institutional investors that advocate for four foundational HCM disclosures. One respondent from an HCMC member, Marina Severinovsky of Schroders, noted:
U.S. companies disclose HCM information in their 10-K forms, however the narrative presentation of this information and the breadth of topics included make it difficult to compare companies. More standardized disclosure would enable investors to make more informed assessments of companies’ human capital management performance, including:
1. how many workers, including employees and independent contractors (disaggregated) the company uses within its direct operations;
2. total cost of the workforce, including wages, bonuses and other benefits, presented in a way that evidences a discernible through-line from the company’s audited financial reports to issuer disclosures;
3. turnover, disclosed in a disaggregated manner to separate voluntary and involuntary turnover, accompanied by a description of management’s actions to attract and retain workers, and build an inclusive culture; and
4. diversity data, including diversity by seniority (such as required through annual EEO-1 reporting and gender pay gap data), sufficient to understand the company’s efforts to access and develop new sources of human capital and any strengths or weaknesses in its ability to do so, particularly as it relates to work to foster an inclusive culture. These disclosures are important to inform the investor view of how a company is building a diverse and inclusive culture and exposure to litigation risk.
What Metrics Investors Would Like to See Companies Report
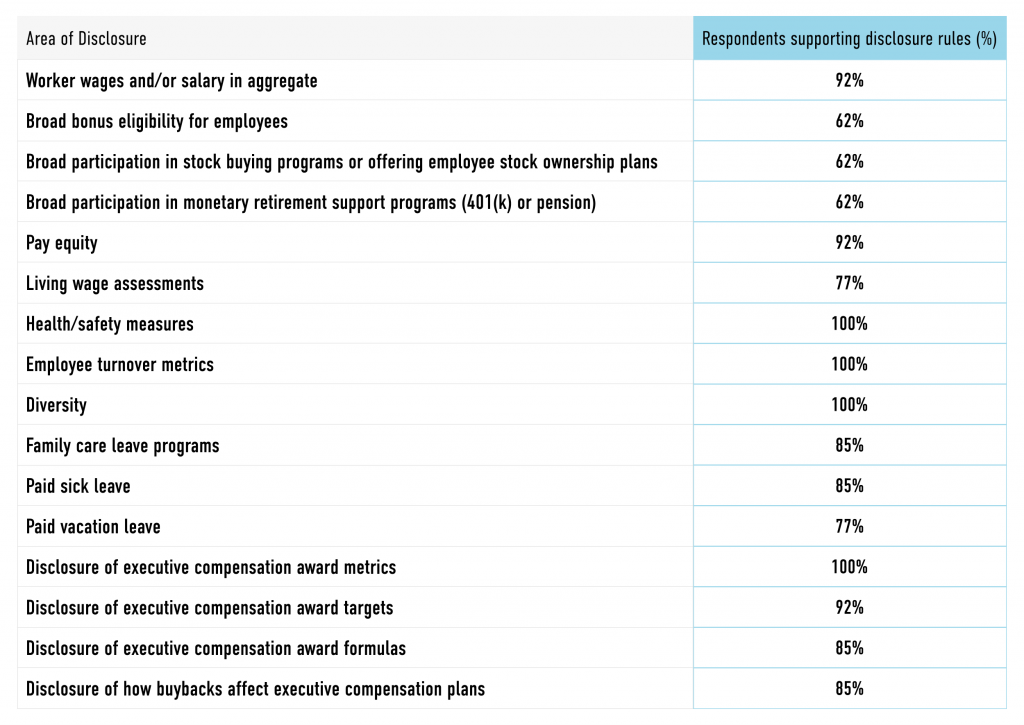
There is substantial support from the surveyed investors for enhancing required disclosures to make HCM data more available, clear, and comparable. We asked which of these metrics and data points participants would like to see disclosed under rules that would make them clear and comparable among companies, and as the following table shows, investors were highly supportive for most disclosures of pay and benefits.
Investors view HCM data as material across industries, though the relevance of individual metrics varies by sector. For example, workforce safety is critical in manufacturing, while diversity and inclusion are prioritized in technology.
Rekha Vaitla of CalSTRS tied HCM data to risk mitigation:
Turnover, pay equity, benefits information, and training and development are critical for understanding a company’s stability. These metrics directly inform our view of long-term risk and opportunity. For us, it’s a calculation of risk; we see that there is risk here that we need to mitigate for beneficiaries. We need to understand what is the stability of the companies that we’re invested in and what is their ability to retain workers and to grow and retain value in the long term.
One asset owner emphasized the importance of comparability:
Materiality comes from being able to benchmark. Without standardized data, we’re left guessing. Comparisons between companies are essential for identifying risks, but we can’t do that without comparable information from all companies.
Marcela Pinilla of Zevin Asset Management said:
Rate of turnover, and rate of retention and promotion of diverse talent (broken out by gender, race/ethnicity) tells a workforce story. Do associates or executives of color who join the company stay in their job? Do they get promoted? We also want to get insight into the bigger picture of job quality. This includes wages and benefits like paid sick leave, reproductive care access, pay equity, and anti-competitive practices like noncompetes in employee contracts that hinder wage growth and job mobility. Disclosure is the baseline request so that investors and stakeholders have decision-useful information to analyze and evaluate progress, and it’s also important to factor in qualitative information such as stakeholder input and employee feedback.
Marina Severinovsky of Schroders noted several metrics that her organization believes give companies a competitive edge in workforce management:
We identify human capital management as a priority issue for engagement, noting that people in an organization are a significant source of competitive advantage…Several metrics we consider material [are]: Paid time off and wider benefits including sick pay, company culture/sentiment, number of employees, total cost of workforce, voluntary and involuntary turnover, and workforce diversity data. We see these metrics having a direct impact on company performance, and companies can create a key competitive advantage by treating them as material.
Karen Kerschke of the Office of the Illinois State Treasurer noted the risk to investors from poor management of HCM issues:
Workers are the most important asset for any company. When companies recognize this and treat their employees well, they are better positioned for long-term success and to unlock sustainable value creation for their investors. Unfortunately, there have been alarming trends among some of the largest companies in the United States and elsewhere to treat workers more as disposable commodities than as vital assets. This includes tolerating high employee injury rates, turnover rates, subverting labor standards, or hiring contract workers with limited protections. Trends such as these represent poor human capital management practices that can create material operational, legal, regulatory, and reputational risks that can lead to depressed financial performance.
Multiple participants brought up the difficulty of defining what is material in terms of HCM metrics before having access to the data. Emily DeMasi of EOS at Federated Hermes Limited stated:
So, we would like to look at the total cost of the workforce, look at workforce demographics and then, the two most basic things that you think every company would report consistently, and comparably, is number of employees, including part time, contract, gig or consulting workers, however that is defined. And lastly the really key metric of turnover. But until we have those reported on a regular basis and people are making decisions on that, it’s honestly really hard to say which are the most material. It’s almost like the chicken and the egg. So those are the issues that have consistently come up as to what asset owners believe to be the most material for making decisions, but until we are enabled to see it and start making decisions on it, that’s the only way to sort of prove the case and prove that they are the most material.
Another asset manager worried about the data not being available to be rigorously tested in academic study, as well as being known to some in the market (such as employees) but not being actionable and known to investors:
I think there is an assumption of materiality because for a lot of companies knowledge is stored with the staff, but we don’t have access to study that because the data is not public. So I can’t point to academic studies, but if we had the data out there, the academic studies would follow and then we would be able to show materiality. Anecdotally, one of my relatives left a job because she felt like she hit a glass ceiling, and when she looked internally at promotions and retentions, she realized every senior-level woman had quit within the last three years. And so while she didn’t have any personal experience with gender discrimination, she inferred that the lack of females in leadership meant that she wouldn’t be able to advance at the company. So that kind of information is helpful for analyzing recruitment and retention. The employees know, and look at it often. And they are using it for decisions. As an investor on the outside, we don’t have that information.
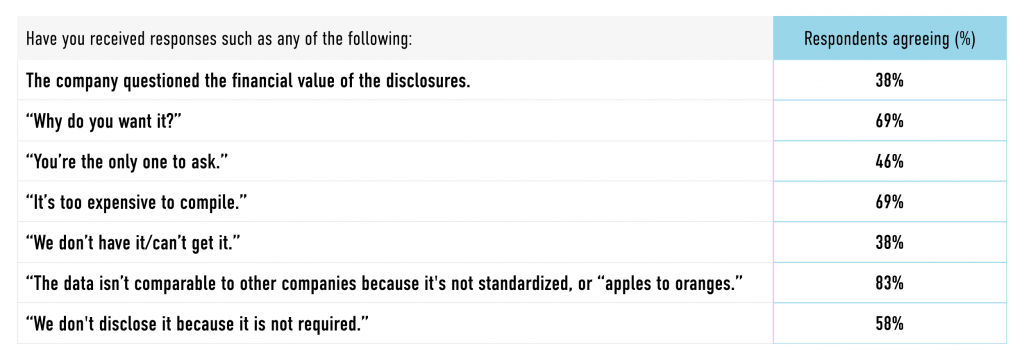
Investors frequently engage with companies to advocate for improved HCM disclosures, but they often encounter resistance. Common pushbacks include claims that data collection is too expensive or that metrics lack comparability.
Several investors said “it’s not required” is the most-heard rationale from companies for not disclosing HCM data. Some participants said companies question the value of certain disclosures, like metrics on the board and workforce representation along racial and gender lines.
As one asset owner remarked:
Engagement responses from companies are enormously variable. Companies with strong HCM stories are more willing to disclose, but others are resistant, especially in the U.S., where disclosure requirements are weaker.
Investors often hear similar responses from companies. When we asked if they’d heard any of the following responses to their requests for disclosure, participants most often said they heard that the company didn’t want to release information because it wasn’t “standardized” or “apples to apples.”
HCM data is critical for improving investors’ understanding of corporate value, returns, and risk mitigation, yet the current state of U.S. disclosures limits investors’ ability to benchmark companies. The asset owners and asset managers participating in this study believe that standardized reporting frameworks that include metrics like turnover, diversity, pay equity, and safety data are essential to closing these gaps.
Many investors believe that workers are the most important asset for any company, which is borne out in part by the rise of intangible asset value at companies over time. When companies treat their employees well, they’re more competitive with peers and better positioned for long-term success. Standardized disclosures would allow investors to identify leaders, hold laggards accountable, and drive sustainable value creation. By improving transparency, U.S. companies allow investors to make more informed decisions and foster a stronger, more sustainable economy.
Investors in our survey are eagerly waiting for companies and regulators to step up to improve the quality and quantity of HCM data so that they can make investing and stewardship decisions with deeper knowledge and greater accuracy. In the meantime, they are expending considerable money and effort to glean what they can from non-standardized reporting, external data providers, and their own analysis and direct conversations with corporate leaders.
Ultimately, these investors are seeking clear and comparable metric disclosures by all companies on key metrics. By addressing these gaps, the U.S. can align its practices with global standards, enabling more effective stewardship and fostering a more sustainable and equitable economy.

In recent decades, institutional investors have greatly expanded their assessment of risks and opportunities at both the company and portfolio levels to go beyond a narrow analysis of financial statements such as the balance sheet and income statement. Through frameworks variously referred to as corporate governance, intangible value analysis, and increasingly, investor stewardship, this type of inquiry allows the investor to gain a wider perspective on what drives returns. Over the past decade, the consideration of environmental, social, and governance (ESG) factors has also fallen into this category.
At its core, this expanded assessment allows fiduciaries to perform due diligence and assess issues before they become problematic to company operations, as well as better understand the drivers of growth and value creation. Examples include evaluating the qualifications of a company’s board to ensure a prudent mix of expertise, analyzing how a company treats its workers to maximize productivity and gain access to the best available talent, and engaging with companies to determine how environmental pressures translate into financial risks and opportunities.
Forging relationships with company leadership and regularly communicating with them also allows investors to respond more quickly to company crises if problems do arise in their portfolio investments. Casting informed proxy votes on issues such as director elections, executive compensation, shareholder proposals, and corporate actions such as mergers or changes to company charters or bylaws are prime examples of good stewardship. Institutional investors – and to some extent, even corporate executives and boards – are increasingly relying on a wide variety of stewardship metrics and data to gauge company performance (also here and here). These metrics not only have the capacity to impact financial performance in the long run but also often reflect risks and opportunities that, while material to company performance, are not yet quantifiable or adequately reflected in earnings and company assets or liabilities.
This report aims to capture the essential elements investors look for when they consider forward-thinking stewardship in their investments, the ways they link stewardship to financial value, and the challenges they face now and, potentially, in the future. It uses data from survey interviews with more than two dozen institutional investors, whose ability to participate anonymously allowed them to share their views candidly.
This report is based on survey interviews with 29 institutional investors, including 17 asset owners (e.g., pension funds) and 12 asset managers. Participants represented a broad geographic range within the U.S., with assets under management (AUM) varying from tens of billions to hundreds of billions of dollars. Participation in the survey was voluntary, which introduced the potential for self-selection bias, but care was taken to invite investors with a variety of views on stewardship and corporate governance.
The survey topics spanned the breadth of responsibilities for stewardship teams, including:
For context, some investors use the term “ESG” as a shorthand for evaluating the unique extra-financial risks and opportunities each portfolio company or potential investment faces. The term “ESG” has been used for more than 20 years to signify issues that have an indirect but substantial relationship to the financial statements and present opportunities for shareholders to engage with companies. However, many have criticized the term “ESG” for oversimplifying risks, elevating issues that are not materially financial, and politicizing investment issues. The term “ESG” is generally used to refer to environmental, social, and governance issues. Environmental criteria assess how a company is positioned with regard to various risks and opportunities stemming from environmental stresses and regulations, social criteria evaluate how companies manage issues relating to employees, suppliers, customers, and the community, and governance criteria examine factors such as company leadership, executive compensation, audits, internal controls, and shareholder rights.
The survey’s conversational format allowed participants to freely discuss topics or bring up aspects of risk analysis and investment that were not directly asked in the structured questions.
Typically, the majority of assets held by the asset owners in our survey were passively managed, with between 50% and 67% of their equity funds tied to indices, most often the Russell 3000. These investors emphasized that indexing makes their stewardship and governance responsibilities more critical, as the fund remains a long-term shareholder regardless of performance, controversies, or governance issues at individual companies. As one asset owner noted, “There is no investing away from those risks.” Several asset owners reported having small allocations to portfolios that comprised companies specifically selected on the basis of stewardship concerns, such as investments in diversely owned management firms or businesses (and often, portfolios with allocations to climate-responsive companies), but these accounted for no more than 5% of their AUM.
By contrast, asset managers demonstrated a much greater variety of management styles, with some managing 100% of their equity assets actively (pursuant to a variety of investment selection strategies), while others had a significant proportion invested in passively managed funds. All asset managers incorporated some level of active management, with at least one portfolio explicitly incorporating ESG factors into investment decisions, which they said were popular with some clients. All of those surveyed stated that their stewardship practices were essential to achieving good long-term performance across their portfolios.
Several of the investors surveyed cited studies finding that a focus on factors like stewardship, corporate governance, and sustainability is linked to improved company financial performance (also here and here). Most discussed the consideration of risks and data around workforce issues – including diversity, a living wage, internal pay equity, health and employee wellness, and the use of broad-based incentive structures – as important considerations in their conversations with companies. They also cited other social concerns such as opioid impacts, pharmaceutical pricing, and human rights. For the environment, investors frequently cited climate, water use, “forever chemicals” such as PFAS (per- and polyfluoroalkyl substances) and phthalates, and plastic pollution as serious risks, especially for certain industries and companies. Many see their efforts to discuss these factors with boards and management as a key facet of lowering risk to their funds. They noted the importance of managing these risks, as well as the opportunities that can arise in addressing them, in terms of future profitability for the companies and industries most affected by these issues.
Nearly all investors agreed that stewardship is essential for identifying and managing a wide range of investment risks. These risks often include environmental liabilities, social unrest or scandals, and governance failures – all of which could damage a company’s financial performance. Investors expressed confidence that by factoring in the risks, and the attendant opportunities that often arise, they could gain a more comprehensive understanding of a company’s long-term viability and value.
There has been significant discussion on the variability of ratings and data services for ESG factors, with intense debate over whether this diversity of opinion reflects a healthy ecosystem or disarray and a lack of cohesion in the field. Several of the surveyed investors resisted the idea that they blindly follow ratings or recommendations from external services, with one asset manager explaining:
Most people don’t understand that we don’t just use someone else’s ratings or data to make decisions. We review the data ourselves, and make our own algorithms–we don’t rely on someone else to tell us what is a good or bad factor or metric.
Other asset managers and owners echoed this sentiment, expressing frustration over market participants misrepresenting or exaggerating investors’ reliance on recommendations from proxy voting advisory firms.
Every investor we surveyed relied on multiple data providers, with the majority using more than one proxy advisory service. Over 70% of asset owners reported using services such as Institutional Shareholder Services (ISS), Glass Lewis, MSCI ESG Ratings, and Bloomberg, in addition to others like Sustainalytics, Refinitiv/LSEG, and S&P Global Trucost.
When asked to identify the most critical issues, metrics, or data for their funds, nearly every asset owner and manager highlighted board composition and qualifications as top priorities. While executive compensation, human capital management, and climate issues were also commonly cited, more than 90% of respondents placed the highest importance on board composition and qualifications. Shareowner rights was the second most-cited priority.
Investors desire the ability to evaluate and compare risks across companies, peers, asset classes, and the market, especially regarding systemic risks that passive investors encounter when they become universal owners. As one asset manager put it, “Stewardship is part of the fundamental risk assessment that is embedded in very traditional approaches to valuation of risk and return.” One asset owner noted how they try to capture issues even when they aren’t immediately apparent on the income statement or balance sheet but could be material to the investment:
You don’t see governance on the balance sheet unless you look closely. But if you do an evaluation of governance, you can tie it back to where it might intersect with the balance sheet, either positively or negatively at some point in the future.
Another described stewardship as supporting their fund’s efforts to achieve superior performance:
We always had the link to performance in mind for everything we do, every vote we make, and every company conversation we’ve ever had. In our program, we look for things like overboarded directors, board independence, board qualifications, pay for performance and pay design. We are always aiming for the link to value and seek high-quality empirical studies on this and even issues like financial auditing, internal controls and transparency in auditing.
Many discussed frustration with what they see as ESG co-opting the discussion on stewardship issues, and respondents’ views on ESG as a framework for addressing environmental, social, and governance risks varied from positive to negative – even among individual respondents’ answers. Some investors have been vocal that the “anti-ESG” movement is born out of a fundamental misconception of how investors identify and respond to ordinary risk factors. But investors in this study repeatedly brought up the political contexts that have become associated with these issues and noted that the lack of a clear definition for “ESG” has contributed to confusion and misconceptions. What is viewed as “ESG investing” is sometimes confused with impact investing or socially responsible investing (SRI), which aim to create social or environmental impact alongside financial returns and may purposely sacrifice market-rate returns to achieve those goals. One participant said, “Everything I do is from an investment lens. Don’t call it impact. That’s really not the intent.”
Common themes emerged from these discussions. Most investors focused on risk analysis with tangible financial impacts, as the following quotes show:
Most of the investors dislike the term “ESG,” saying it oversimplifies their stewardship roles. Several expressed that it allowed governance issues to be overshadowed by environmental and social concerns:
Most states do not have laws or executive orders that prevent public funds from considering ESG factors in investment or stewardship activities. However, many investors in these states still reported being affected by a broader anti-ESG movement, especially due to the prevalence and extent of anti-ESG efforts across other states, including some proposals within their own states that ultimately did not pass.
Asset Owners
While most asset owners in states without this type of stewardship or ESG-related legislation reported that the anti-ESG movement had not significantly altered their work, some noted that the backlash had prompted their funds to commit more resources toward investing and stewardship. Although anti-ESG efforts didn’t shift their core goals, nearly all investors reported an increased compliance workload due to the need for additional reporting, responding to public records requests, media inquiries, and for over a third of respondents, substantial efforts related to subpoenas or legal inquiries.
Several asset owners explained that anti-ESG campaigns made it clear their funds needed to improve communication about how they use data to evaluate investments on issues like corporate governance, geopolitical risk, and workforce issues so the public and beneficiaries better understand their link to performance. Even asset owners in Democratic strongholds where there’s little risk of future anti-ESG legislation felt it was crucial to explain their actions to stakeholders. One asset owner noted, “We are not affected by laws but sense the rhetoric in the environment so we proactively respond and engage our stakeholders.” Another commented:
Nothing has really changed for us, but we are trying to be more vocal about why we incorporate these risks into our investment process. We’re a long-term investor and we have a responsibility to manage these risks. It’s a responsibility to show that we’re managing to financial factors, and financial factors only.
For most asset owners, stewardship issues are addressed via voting and company engagement rather than at the investing level through stock selection. None of the asset owners reported having significant holdings in portfolios specifically created based on stewardship ratings or criteria. Several managed or invested in small portfolios aligned with ESG-type investing principles, typically accounting for 5% or less of their total AUM.
Two asset owners from states without anti-ESG laws in place mentioned that while proposed legislation failed to pass, they had worked closely with internal communications teams to inform the public and legislators about the potential impacts of such laws. Beyond these two cases, the remaining asset owners expressed little concern about future legislation impacting their work. Feeling shielded by their state’s political climate, they were confident in the industry’s future and ready to rebut claims that their stewardship efforts are in any way unsuitable for investors.
Some investors, however, noted impacts on the industry, with concerns that other affected investors might reduce their stewardship efforts. One asset owner said:
I understand the challenge for asset managers that are trying to run global businesses with lots of different constituencies. Ultimately, it’s throwing sand in the gears. It’s a distraction; it takes up time. [Pursuers of anti-ESG] don’t have an alternative; they’re just trying to impede without offering alternative or helpful constructions. It’s political pressure driving this when it should be viewed through a financial lens.
Asset Managers
Asset managers reported various impacts from anti-ESG legislation and the broader anti-ESG movement. While none of the asset managers indicated that their actual investment practices had changed due to these campaigns, most said they had significantly altered their communications and outreach around their portfolios and stewardship issues. Many expressed concerns about attracting unwanted attention or scrutiny, and thus were more reserved about marketing ESG-related initiatives.
Although most asset managers said they have at least one ESG-specific portfolio and clients are generally satisfied with these investments, 72% of surveyed managers indicated that anti-ESG rhetoric had led them to modify how they marketed ESG portfolios and handled related voting activities. The changes were not necessarily anti-ESG in nature, but reflected a redoubled focus on materiality and clearer communication with stakeholders. They felt committed to demonstrating the financial connection between the metrics they use for portfolio management and performance outcomes.
Several asset managers expressed optimism that the anti-ESG movement would compel the industry to clarify investment practices and reduce “greenwashing,” where funds are marketed as ESG-friendly without substantive backing. Some managers welcomed the chance for regulatory or market-imposed discipline to distinguish genuine ESG efforts from superficial marketing. Several managers have been fined recently by the Securities and Exchange Commission for such violations (also here and here).
However, many asset managers were pessimistic about the probable impact of anti-ESG efforts over the next one to three years. Seven managers expected that anti-ESG sentiments would influence their organization’s policies and strategies in the near future, while several more said they were unsure. Despite these concerns, most managers anticipated that their own organizations would continue operating as they had before, particularly those with global clients, citing that international reporting frameworks continue to move forward. As one asset manager explained:
Asset managers and owners have a global mandate. There are many other nations and reporting frameworks that are moving forward such as [the International Sustainability Standards Board], so the appetite for data and analysis will only continue. The borders dissipated in importance long ago. We will continue to exercise a lot of care and ensure the way we communicate abroad is consistent with the realities here.
Twenty-two states have passed laws that have affected ESG investment activities in various ways. These laws include barring the use of ESG factors in investment decisions or proxy voting, prohibiting discrimination against companies based on ESG criteria, or creating lists of prohibited investments for state entities (commonly referred to as “blacklists”) based on evaluations of companies that are perceived to be boycotting specific industries. However, many of these laws include exceptions for investment decisions based on material financial factors, making it unclear whether most investors would be in violation given how they use ESG data.
Four asset owners from states with anti-ESG laws participated in this report. They each described the impact on their investment practices as mild or negligible, stating that the primary effects were increased compliance and staff costs. One asset owner explained that their state law prohibits the consideration of ESG factors in investing unless there is a financially material reason to do so. Since the fund in question already aligned its stewardship and investment functions with financial performance, the law essentially codified their existing practices:
Very few investors want to sacrifice returns for ideology. Our state anti-ESG law basically mandates that we cannot invest on the basis of ESG issues, unless there is a material rationale for doing so. This is what we do and what we’ve done all along, so it really hasn’t changed or limited how we invest.
Another asset owner said, “We continue to drive the development of the data and support of the business case for this work. We keep financial impact front and center in our conversations.”
None of the asset owners in states where anti-ESG laws were in effect had current or prior funds or portfolios that were explicitly selected, invested, and/or managed as “ESG” funds.
Support for shareholder proposals that address social and environmental issues is markedly down in the last several years (also here and here). Many survey participants observed that shareholder proposals have become more frequent and prescriptive in recent years, and anti-ESG proposals (that mainly seek for companies to avoid consideration of environmental and social issues) have risen significantly as well. Some investors indicated that the decline in voting support is a natural outcome of stewardship and investment professionals growing frustrated with the sheer volume and detailed nature of these proposals. As one asset owner said:
I have a lot of problems with the level of detail in some of these shareholder proposals. It’s not that the issues aren’t important, but it’s that the proposals themselves go too far in mandates of what the company should do. I’m not comfortable with that, but often I don’t like that voting against a particular issue makes it seem like I don’t think that issue is important. It is. I just don’t want the overly prescriptive solution that’s been presented.
Another asset owner said:
Our support is down sharply, by double digits, each year for the last three years. We support very few shareholder proposals now, especially on E and S issues. We’ve had feedback from our trustees that they believe these proposals have become less focused on shareholder value and more prescriptive than is necessary.
One asset manager said:
Proposals have shifted the conversation. It’s been hijacked to focus on the wrong things. Support for the environmental and social shareholder proposals often doesn’t matter. Shift the focus to voting on directors on their performance. Use the tools you have, and a prime tool is voting for directors. Because really, it’s backward that everyone is trying to solve environmental and social issues without the knowledge that the board has. So it becomes about board accountability, and that has to be judged by their behavior and decisions.
Half of the asset managers and nine out of 17 asset owners reported receiving subpoenas or other legal requests for information on their stewardship activities and programs. Three additional asset managers declined to answer, and one was unsure. These investors discussed the impact of legal actions on their firms, with one saying it was alarming for a member of their fund management to be called for congressional testimony and expressing concern that the industry was being “unjustly criticized” for breaching fiduciary duty. Three asset managers also noted that their policies had changed in response to these legal pressures.
Four asset managers reported direct response costs exceeding $100,000, while another estimated costs around $50,000. The largest portion of these costs was attributed to fees for hiring outside counsel. In addition to legal expenses, most firms also reported significant staff time dedicated to handling these inquiries, with the upper range equating to between one-half and one full-time equivalent (FTE) position over the course of a year.
One asset manager described receiving an inquiry from an official in another state that had passed an anti-ESG law:
The law indirectly affects us, and the main effect has been holding up adoption of guideline changes. Diversion of staff time is also a big effect. We got an inquiry asking us to explain why we voted for a climate proposal impacting an oil company headquartered in their state, but we supported the proposal in part because the company’s management supported it. We tend to side with companies in this regard. But it shocked us to receive an inquiry implying that we were discriminating against a company whose management we were in agreement with. This creates industry confusion even in cases where [asset] managers want to support businesses in the states that created these laws. It asks [asset] managers to second guess and micromanage the risk management and opportunity processes of companies in the very states proposing these laws.
Five asset owners also reported significant costs related to outside counsel and reallocation of staff resources. Three of these owners estimated response costs exceeding $100,000, primarily due to legal fees. All asset owners affected by subpoenas or legal inquiries described dedicating substantial staff time to handling these responses.
All but two asset owners reported significant public records requests related to stewardship issues in their programs. Four owners estimated the annual costs exceeded $100,000, while the remaining asset owners with substantial requests described the costs primarily in terms of staff time, ranging from “moderate” to the equivalent of one-quarter to one full-time employee (FTE).
Several asset managers mentioned that they are also implementing and/or exploring voting choice programs to enhance investor and beneficiary engagement. As technological and logistical advancements rapidly emerge, more asset managers see voting choice programs as a way to improve client engagement (also here) and potentially reduce criticism that asset managers control investments and stewardship activities without sufficient input from clients. Additionally, some asset owners who use asset manager services have been directed to expand or begin using pass-through voting in efforts to pull back voting authority from asset managers to whom they had formerly outsourced authority on certain portfolios.
The insights gathered from this survey show that investors believe stewardship is a critical tool for measuring risk and financial performance. The rise of anti-ESG sentiment and associated legislative measures have created a new landscape for some institutional investors, introducing increased scrutiny, legal challenges, and public relations considerations. However, most investors’ core approach to investment and stewardship remains largely intact and value-focused. Institutional investors continue to view these issues, particularly those within governance and shareholder rights, as critical to evaluating and managing long-term risks and opportunities, maintaining that these considerations are essential to fulfilling fiduciary responsibilities.
Many respondents indicated that clearer communication with beneficiaries and refined strategies will be essential moving forward, particularly in maintaining trust with stakeholders and addressing political challenges. Institutional investors are continuing their commitment to long-term risk management and responsible investment practices via stewardship functions like proxy voting and company engagement.
As Henry Ford said, “If everyone is moving forward together, then success takes care of itself.”
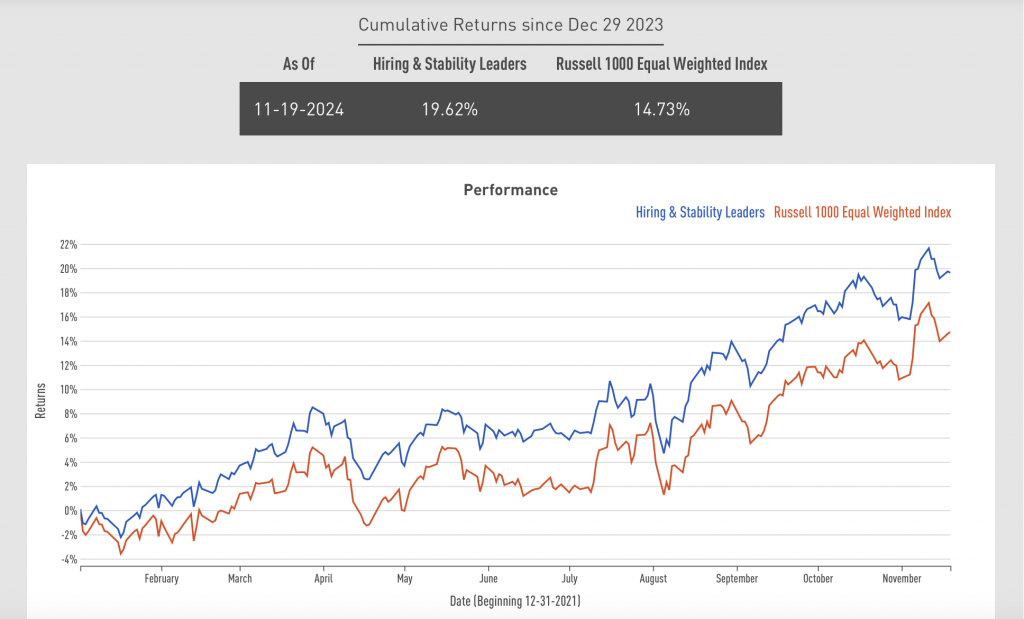
The release this week of our Human Capital Index Concepts puts some real-time market numbers behind this time-tested “employees first” credo. Using our Just Jobs Scorecard analysis, we created three groups of companies comprising the top 20% of performers in each of the Benefits, Employee Wellness, and Hiring & Stability categories. In each case, we tracked these firm’s market performance against the Russell 1000 Equal Weighted Benchmark.
The results are compelling.
All three indexes have beaten the benchmark year to date. Specifically, as of September 30, 2024, the leaders in Hiring & Stability and Employee Wellness were up 16.94% and 16.26%, respectively, outshining the benchmark by 5.09% and 4.41%, respectively. Those in the Benefits category delivered returns of 12.02%, up 0.16% on the benchmark.
We’re working hard to build these into investable products, but if you’re interested, you can view sample scorecards for HPE, Union Pacific, Starbucks, JPMorgan Chase and other companies leading on these issues here.
At a time when the future of work is so uncertain, and with new reports indicating growing resentment among American workers and creeping feelings of stagnation in the job market overall, these results should provide reassurance that at least one core tenet of business leadership – look after your people as best you can – still produces results.
Be well,
Martin

(Yum! Brands)
“When I transitioned from being the Chief Brand Officer to the CEO, some great advice I got was, don’t try to be a black belt in everything. Be a black belt in marketing and be a brown belt in everything else. That’s what I think helped me to be successful early on, because I’m not trying to be everything. I understand I’m not a CFO, but I have a great CFO who can lead the business.”
Forbes lists Just Capital’s Just Jobs Scorecard and corporate partnerships as key resources to craft competitive work-family employee benefits in 2025.
Our friends at The Brookings Institution take a deeper look at the counties Trump won – representing a minority share of GDP, but with notable gains since 2020.
Newsweek lists the 22 states that will be enacting minimum wage increases on January 1, 2025.
The New York Times reports that Spirit Airlines has officially declared bankruptcy after a failed merger and $2.2 billion in losses over the past 5 years.
Reuters reports that a Texas judge has blocked Biden’s federal overtime pay rule.
CEO Today looks at how job pay transparency laws are actually changing hiring for the better.
Fortune breaks down how men and women diverge when it comes to the best benefits for retaining them, with women ranking “work-life flexibility” significantly higher than men. Explore the data here.
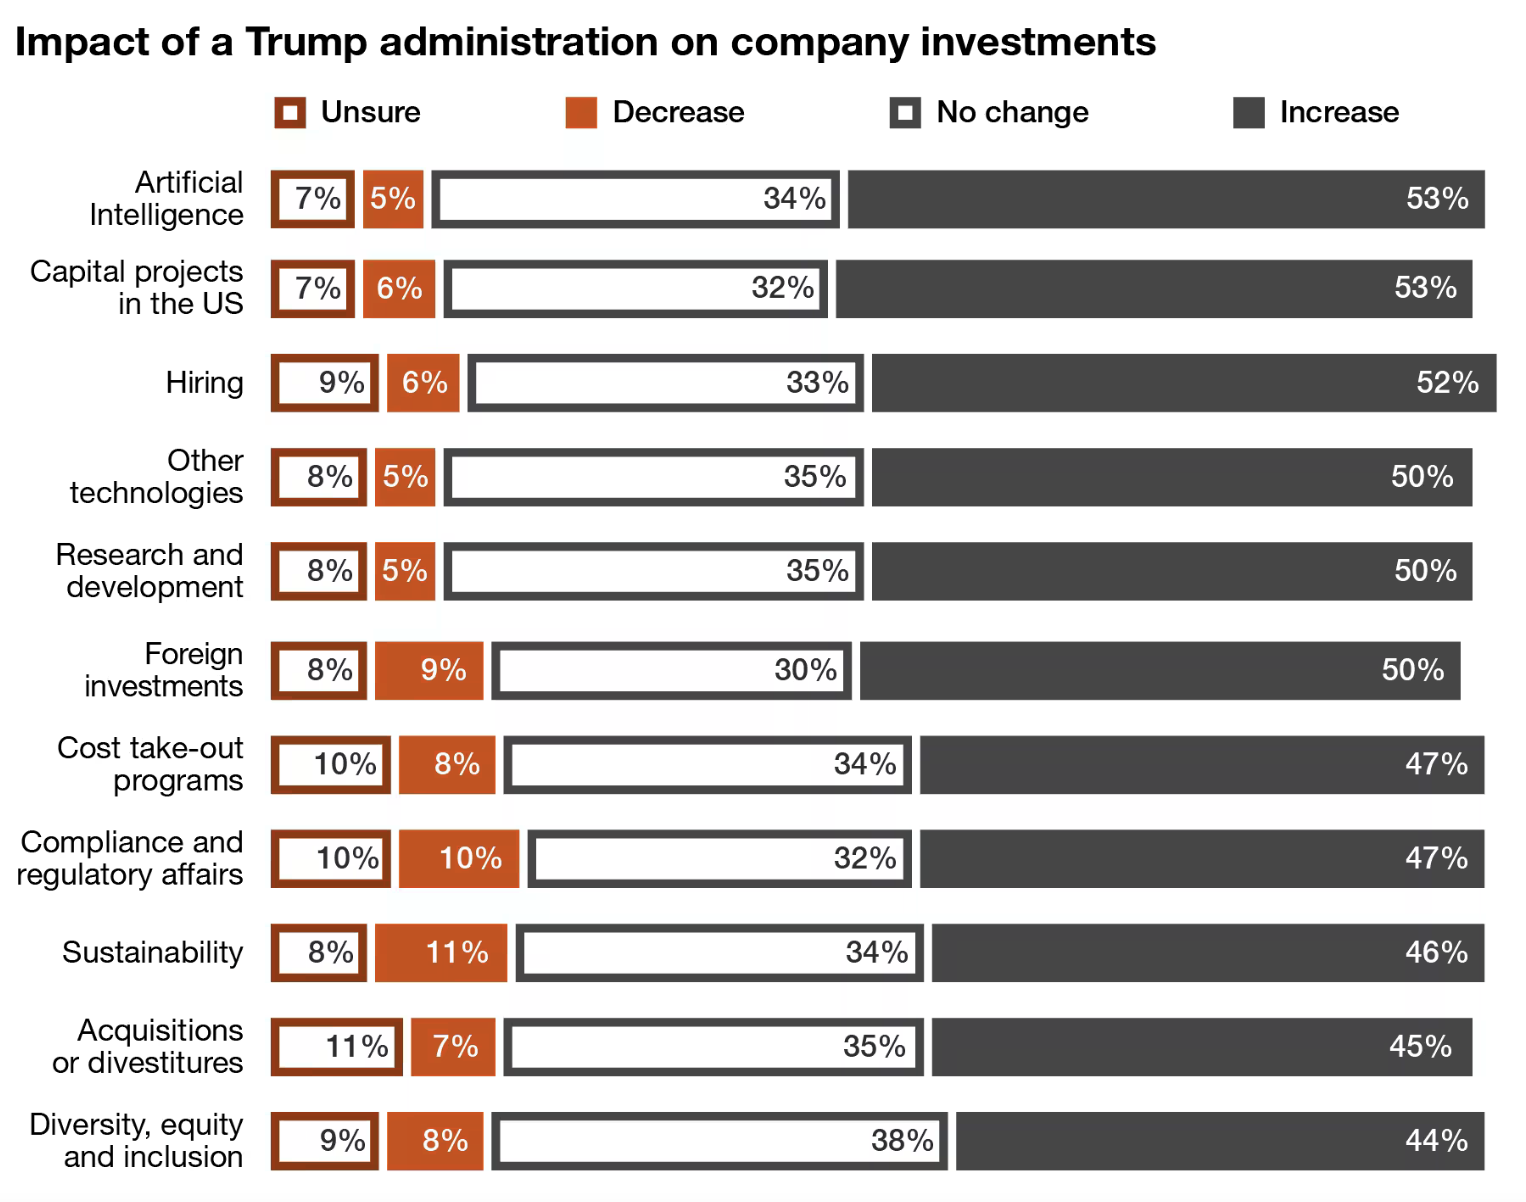
This chart comes from PwC’s recent analysis of how companies are planning to shift their investments, or stay the course, as Trump takes office in 2025. Look at all the insights here.
In the third quarter of 2024, the S&P 500 posted a gain of 5.9%, reflecting the resilience of equity markets as they overcame initial volatility, including a sharp 12% correction in the technology sector. This recovery was driven by a significant shift in Federal Reserve policy, with the Fed implementing a 0.50% rate cut in September, the first such reduction since March 2020.
Sector performance underscored a rotation from growth-oriented areas of the market to more stable, income-generating value sectors. Value stocks out-performed growth stocks, with value sectors like utilities, financials, and consumer staples gaining traction amid market uncertainty. Value stocks returned a robust 9% for the quarter, significantly outperforming growth stocks, which posted a more modest 3.6% gain. Utilities led the way with an impressive 19.4% return, followed by real estate investment trusts (REITs), which gained 17.2%, and financials, which rose 10.7%. These sectors benefited from their defensive characteristics and income-generating potential, which became more attractive as interest rate expectations shifted. Energy, however, was the sole sector in negative territory due to weaker demand and lower oil prices, although it remains up 8.4% year-to-date.
The Federal Reserve’s rate cut also supported a notable rally in small-cap stocks, which outperformed their large-cap counterparts. The Russell 2000 small-cap index gained 9.3% during the quarter, benefitting from the Fed’s dovish stance, as lower rates tend to favor smaller companies that are more sensitive to borrowing costs. This marked a reversal from earlier in the year, when large-cap growth stocks dominated due to their perceived stability in a volatile economic environment.
As of September 30, 2024, our flagship index – the Just U.S. Large Cap Diversified Index (JULCD) has out-performed the Russell 1000 (Cap-Weighted) benchmark by 0.46% year-to-date and by 11.97% since its inception. Additionally, the Just 100 (equally weighted index) has outperformed the Russell 1000 (Equally-Weighted) index by 7.38% year-to-date and by 51.1% since its inception.
Just Capital found that four out of the five stakeholder categories it tracks delivered negative performance in Q3 2024, with the “Workers” stakeholder being the sole positive performer. The Workers stakeholder delivered the strongest performance over this period with a long-short spread of 1.17%. Notably, within the Workers stakeholder, outperformance was driven by both the top and bottom deciles.
Just Capital’s Overall Weighted Score takes into account the 20 core Issues determined through our annual survey research – including paying a living wage, creating a diverse, inclusive workplace, and helping combat climate change – across key business stakeholders: Workers, Communities, Shareholders & Governance, Customers, and Environment. The Overall Weighted Score delivered an almost neutral long-short spread of -0.14%, with the bottom decile serving as the primary negative contributor for the period ending September 30, 2024. Year-to-date the performance spread between top and bottom decile for Overall Score is at 9.11%
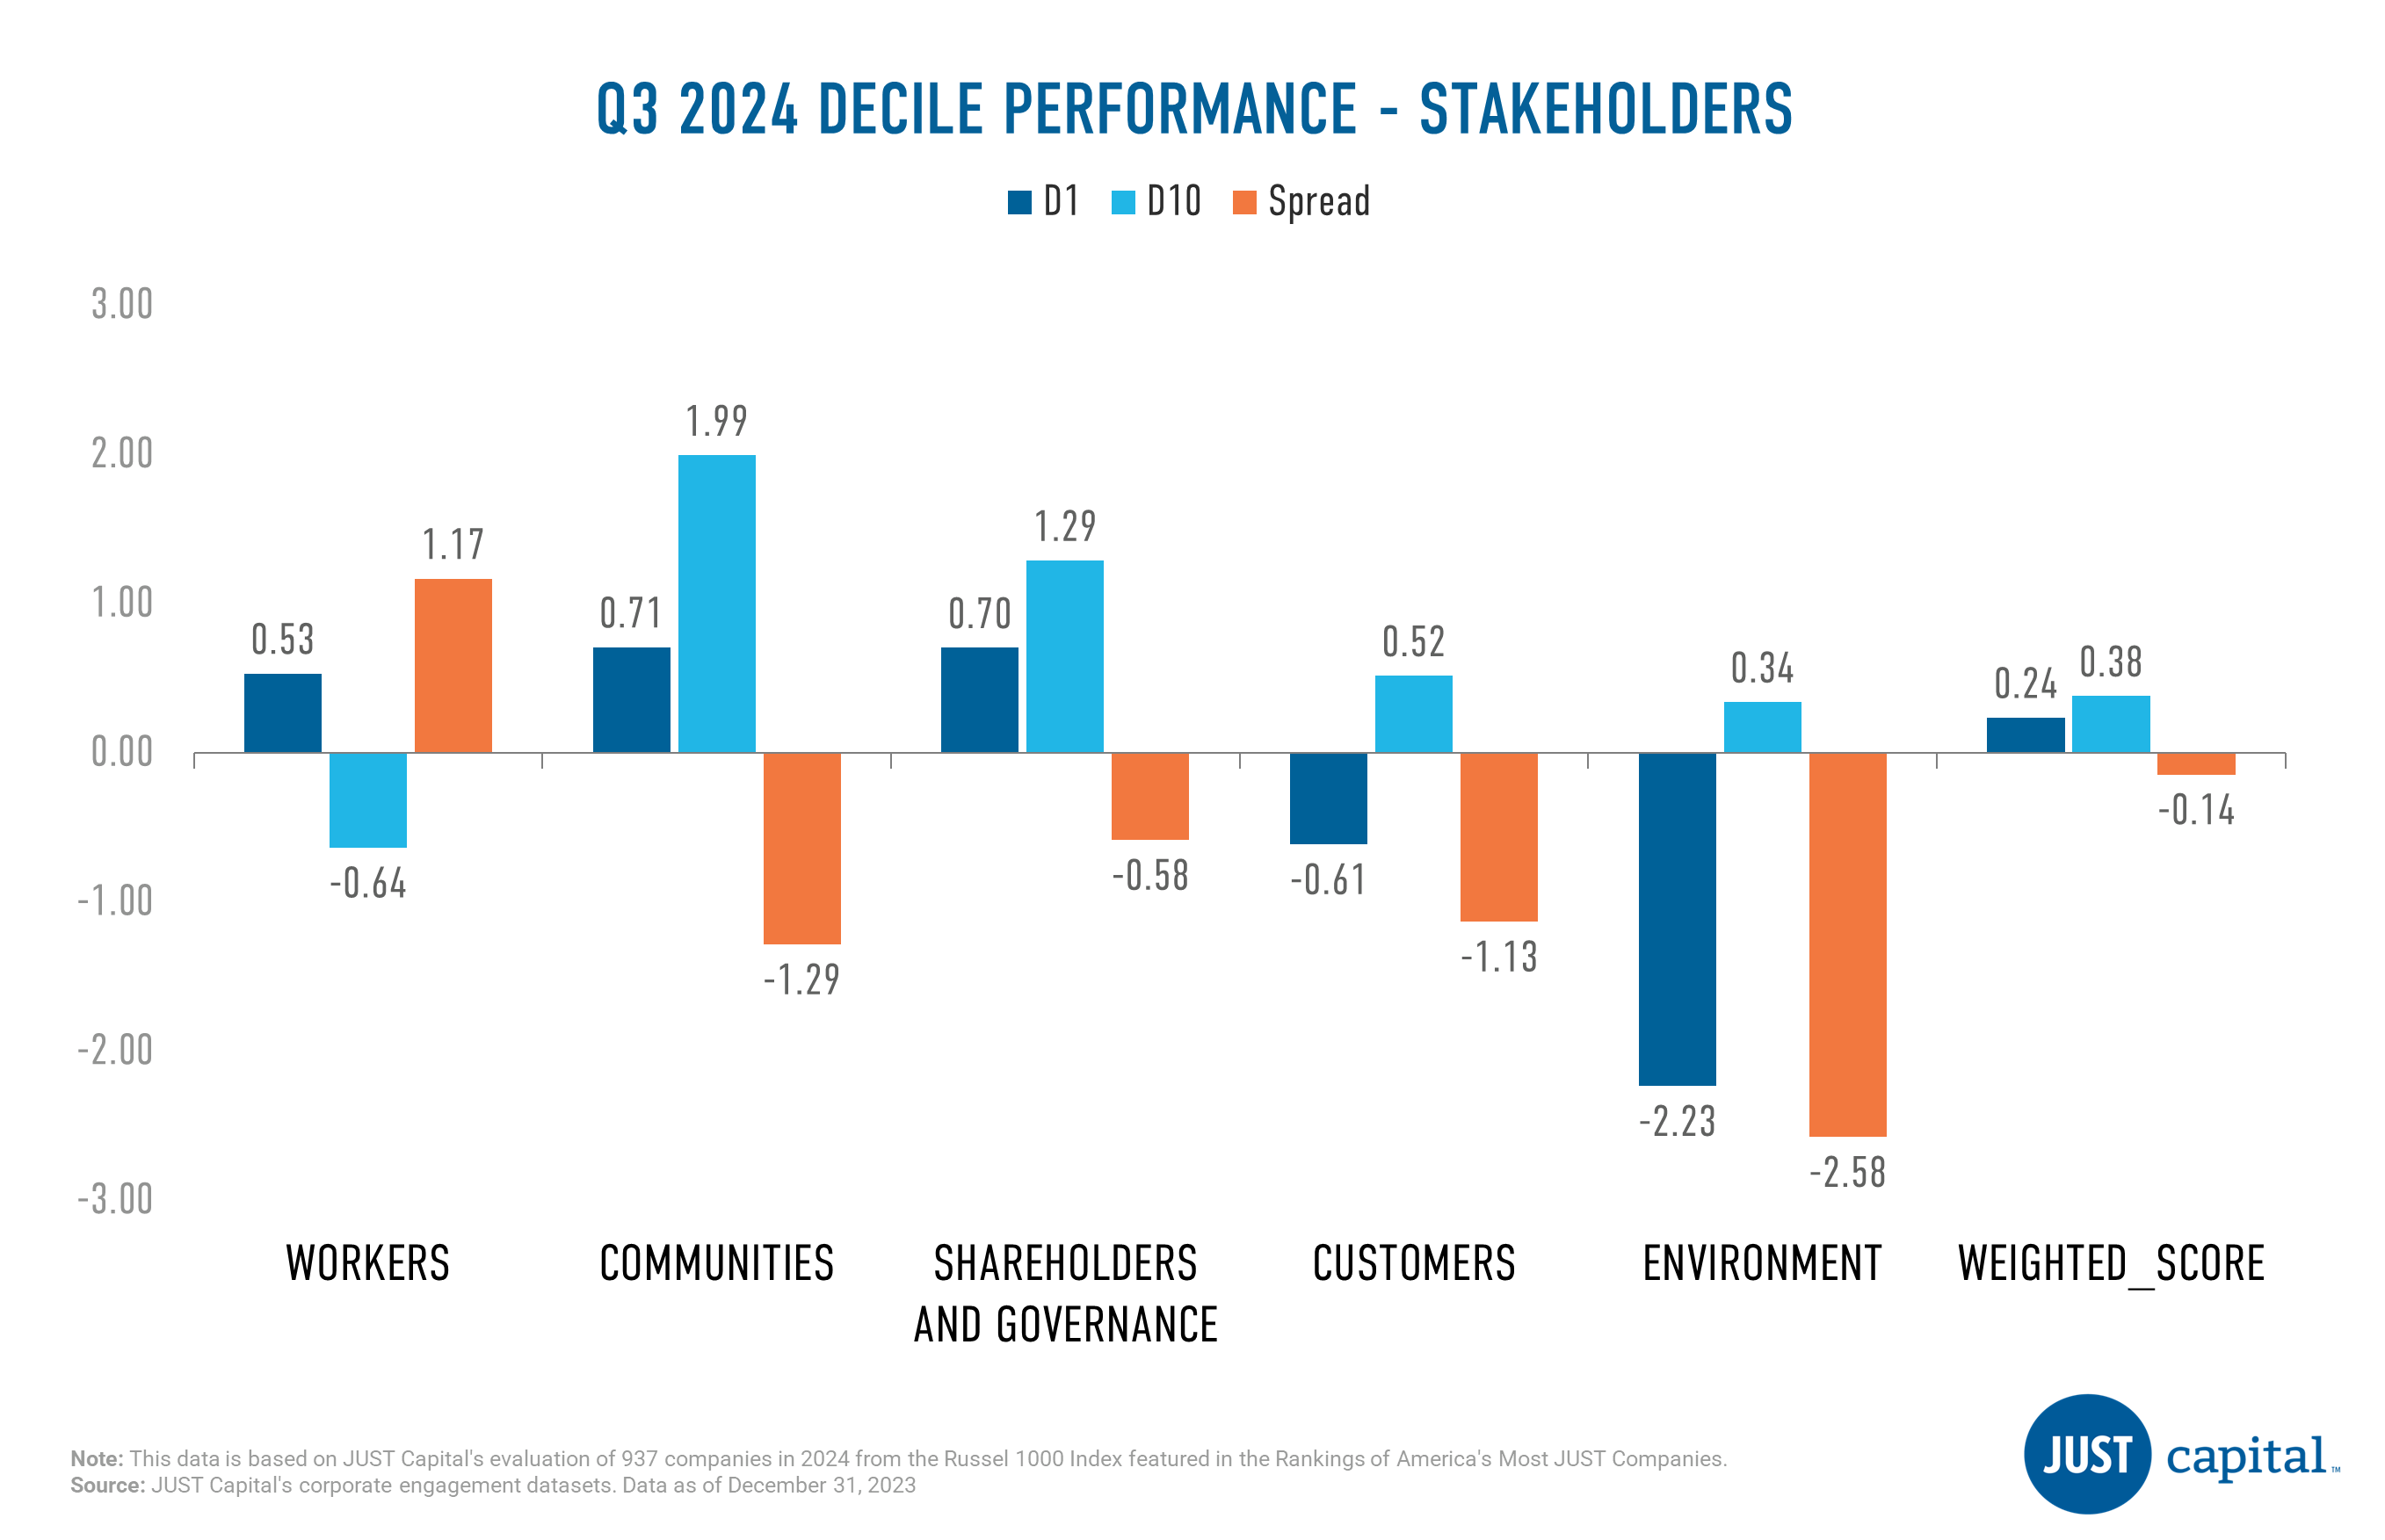
Workers
The Workers stakeholder measures a company across five Issues:
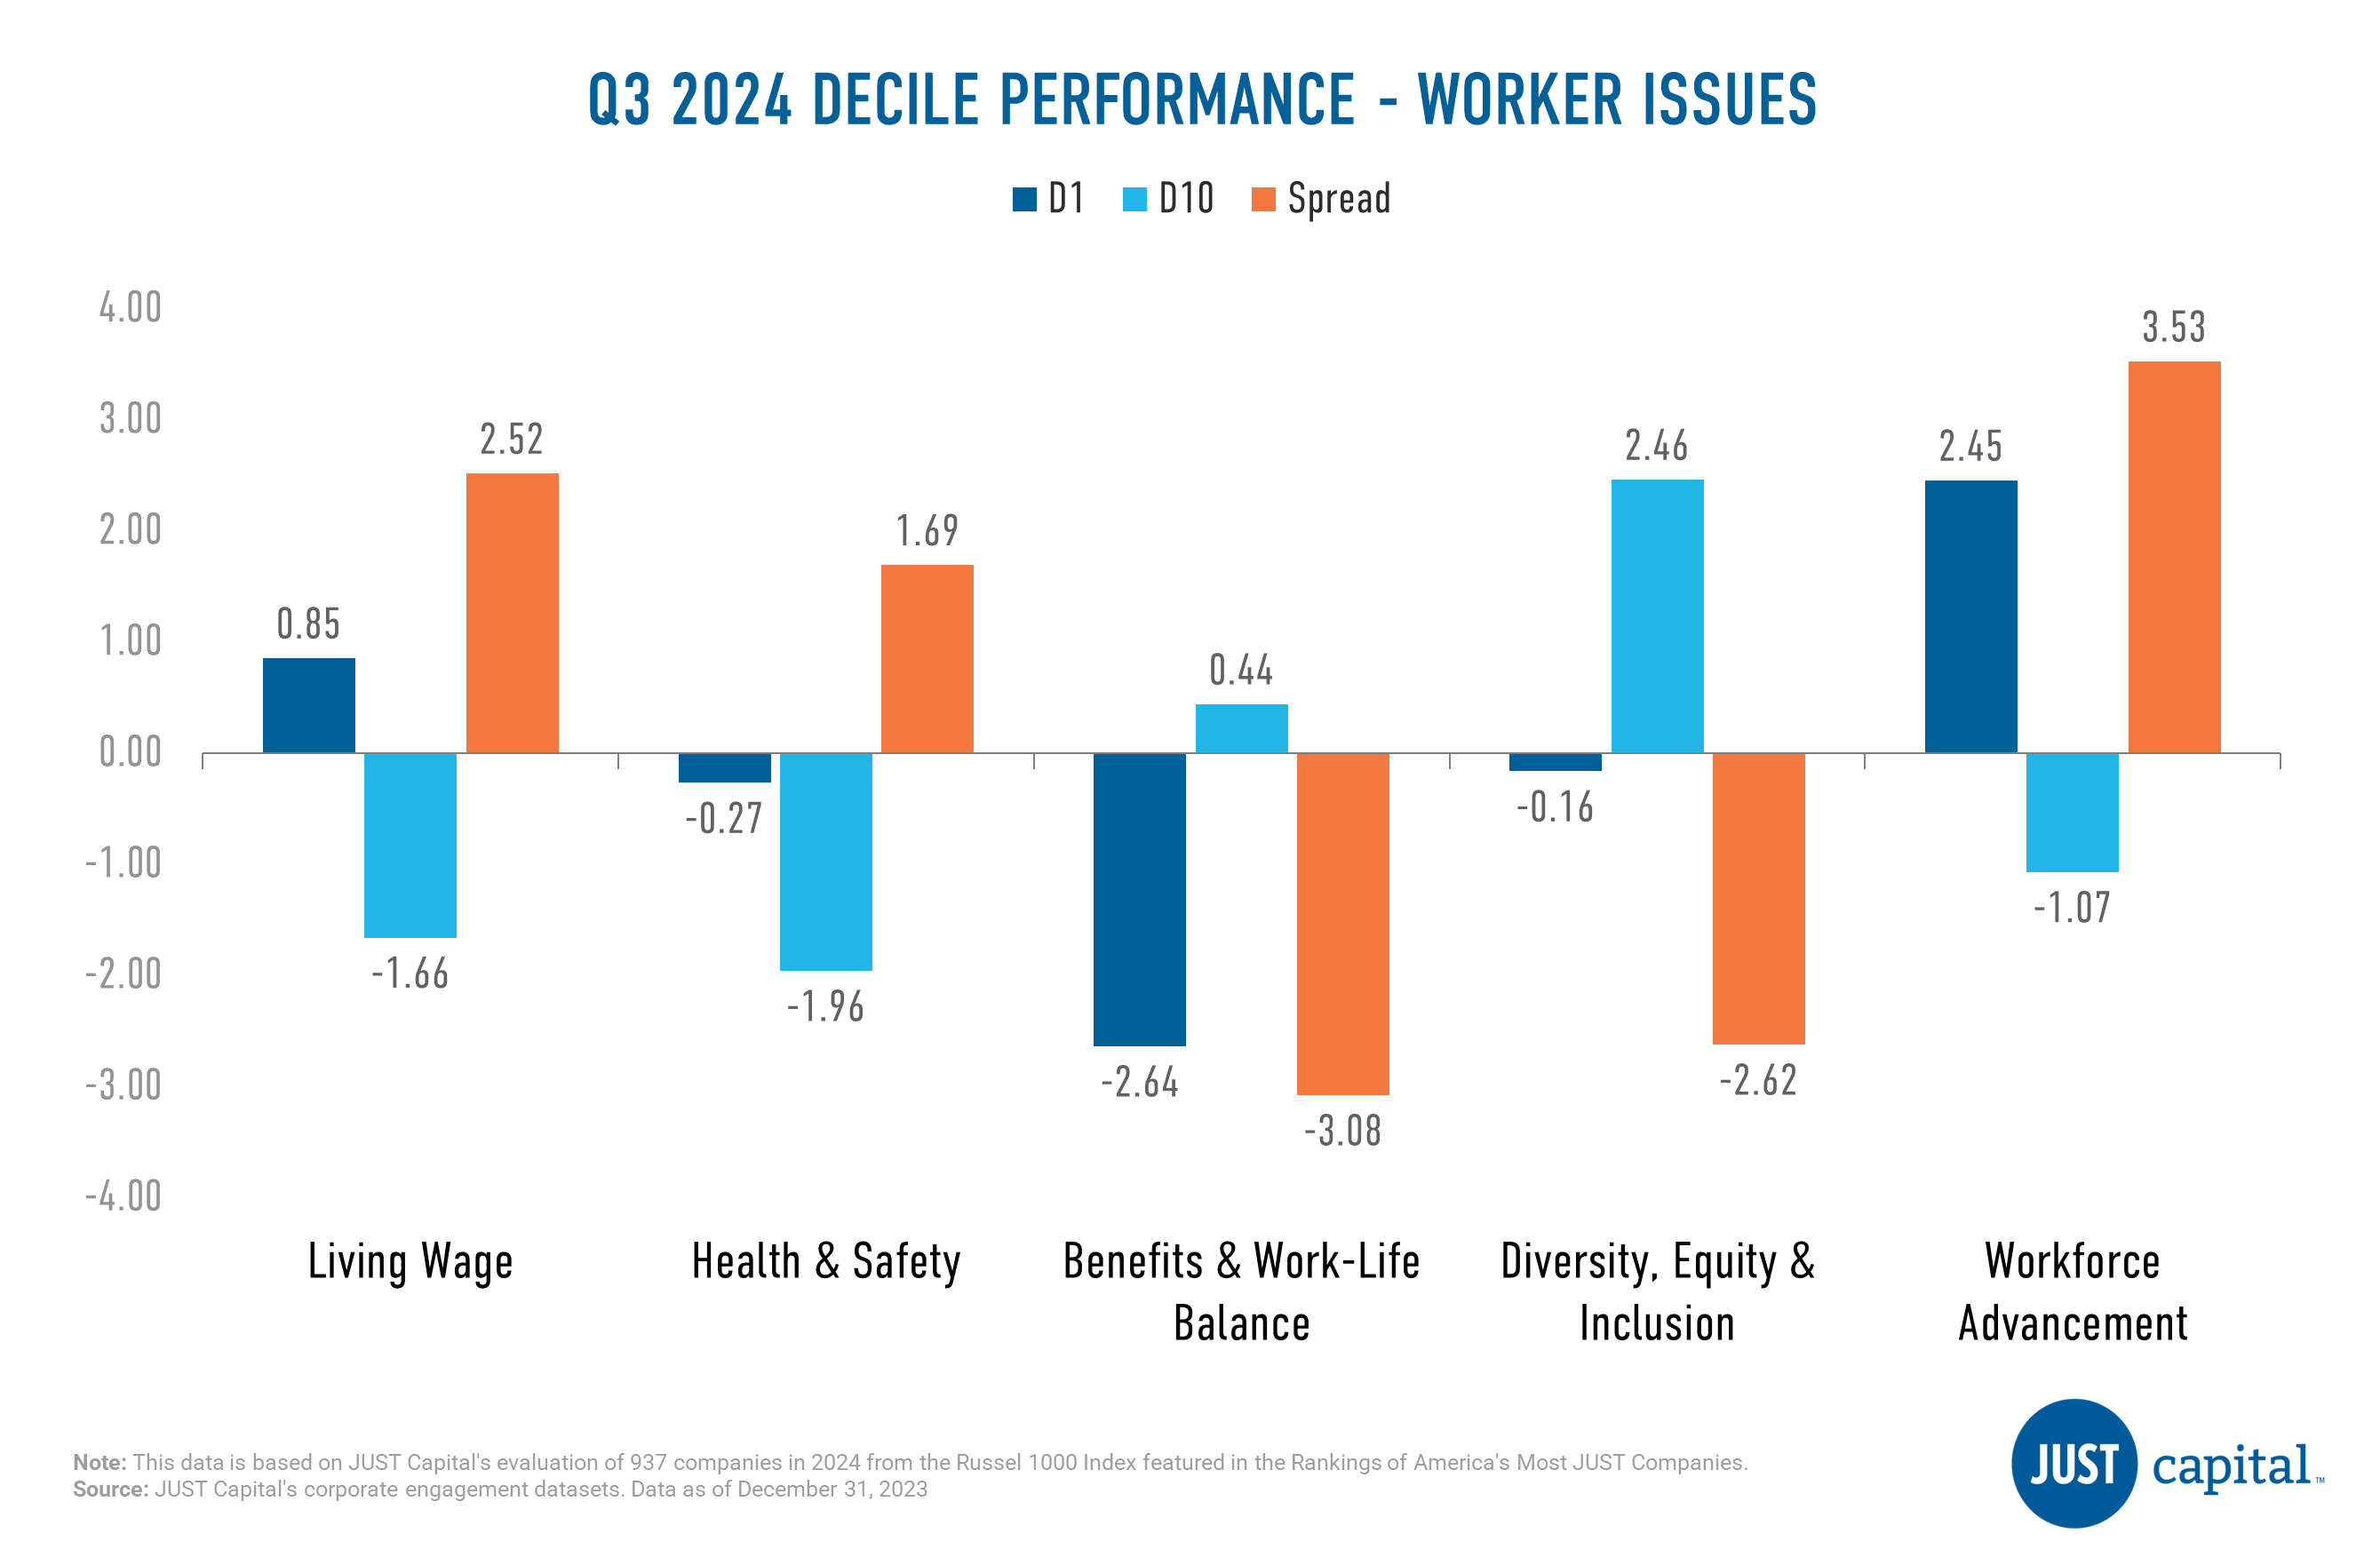
In Q3 2024, we saw three out of five issues deliver positive performance, with the Workforce Advancement Issue faring the best. Benefits & Work-Life Balance was the weakest performer amongst the Worker issues.
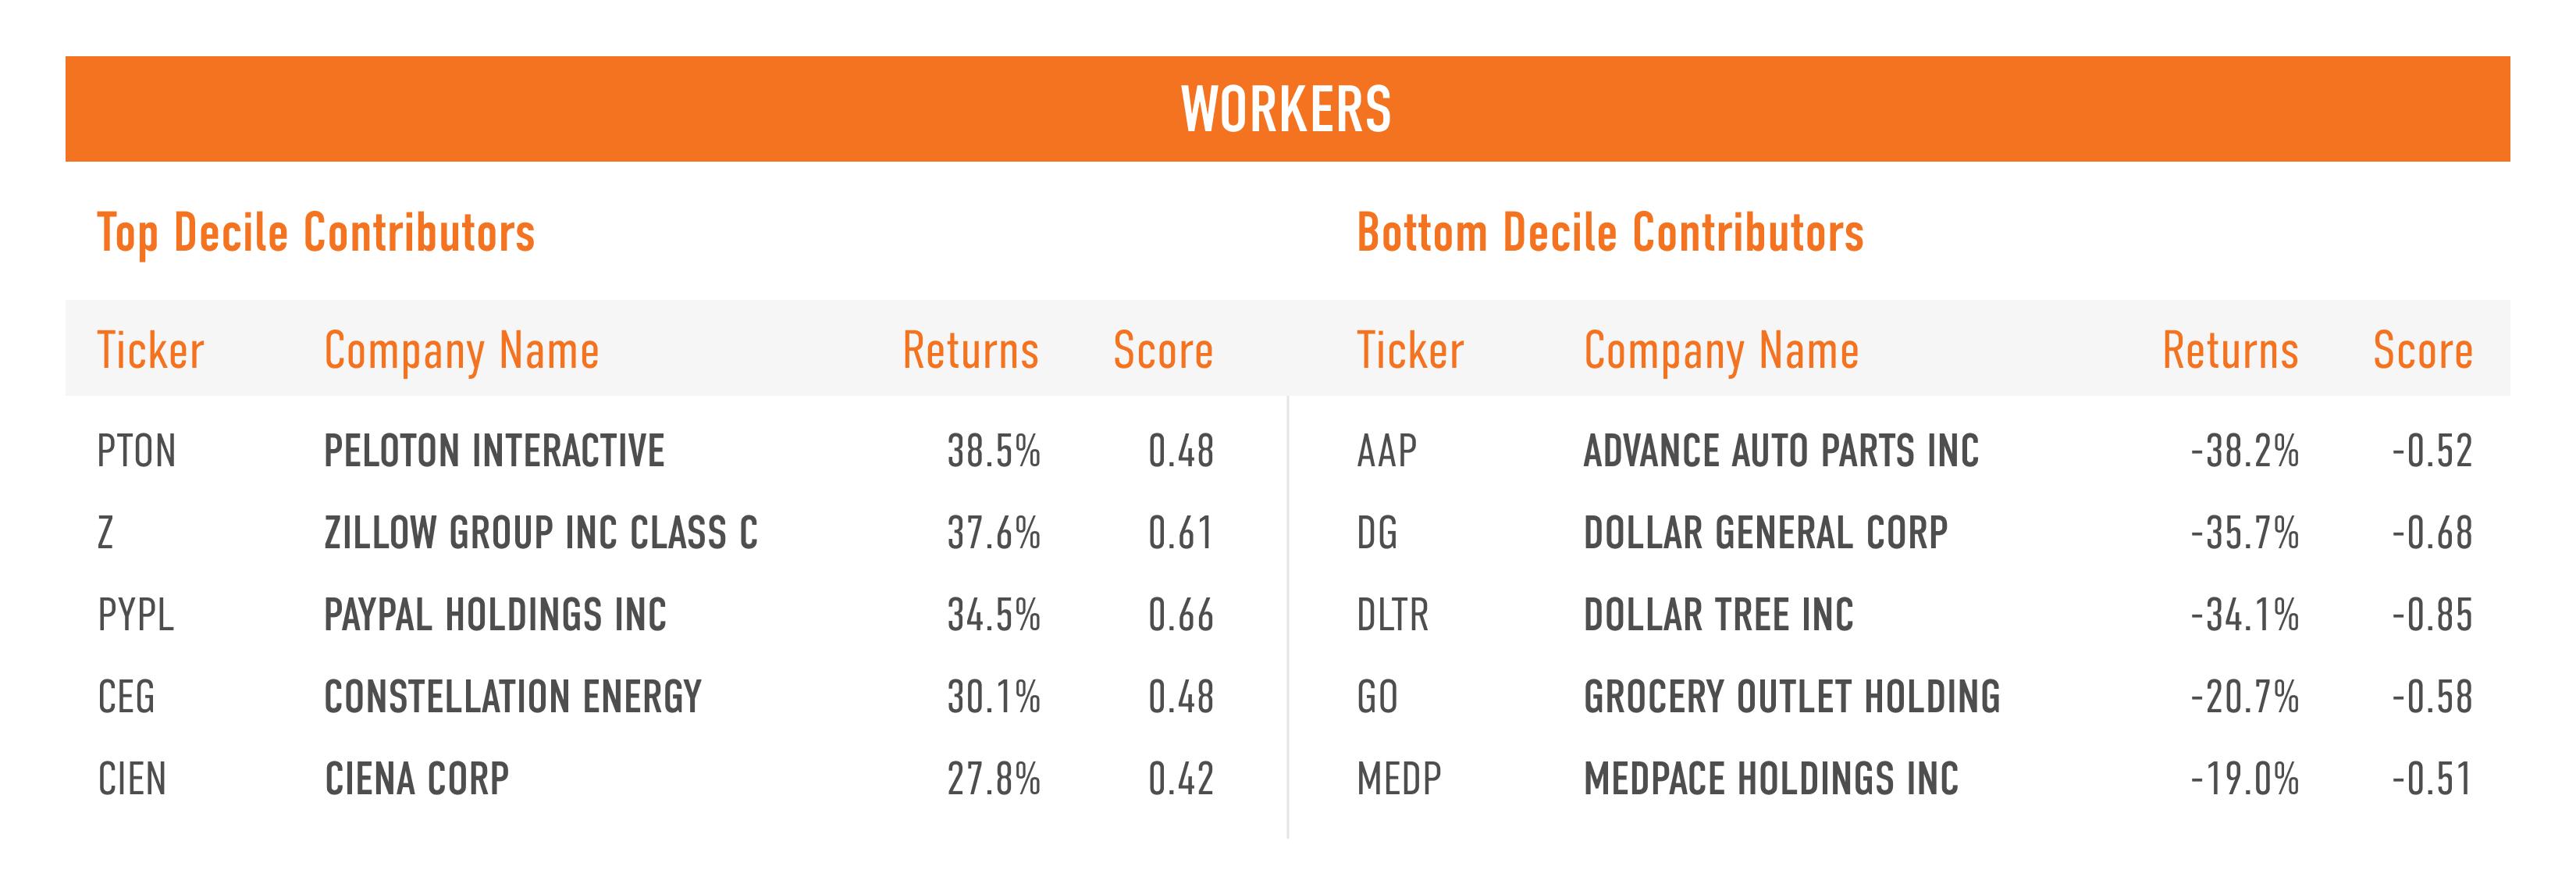
Shown below are the top and bottom five contributors to the top decile (D1), the top-ranked companies as measured by their Workers score, and the bottom decile (D10), the lowest-ranked companies as measured by their Workers score.
The Communities stakeholder measures a company across four Issues:
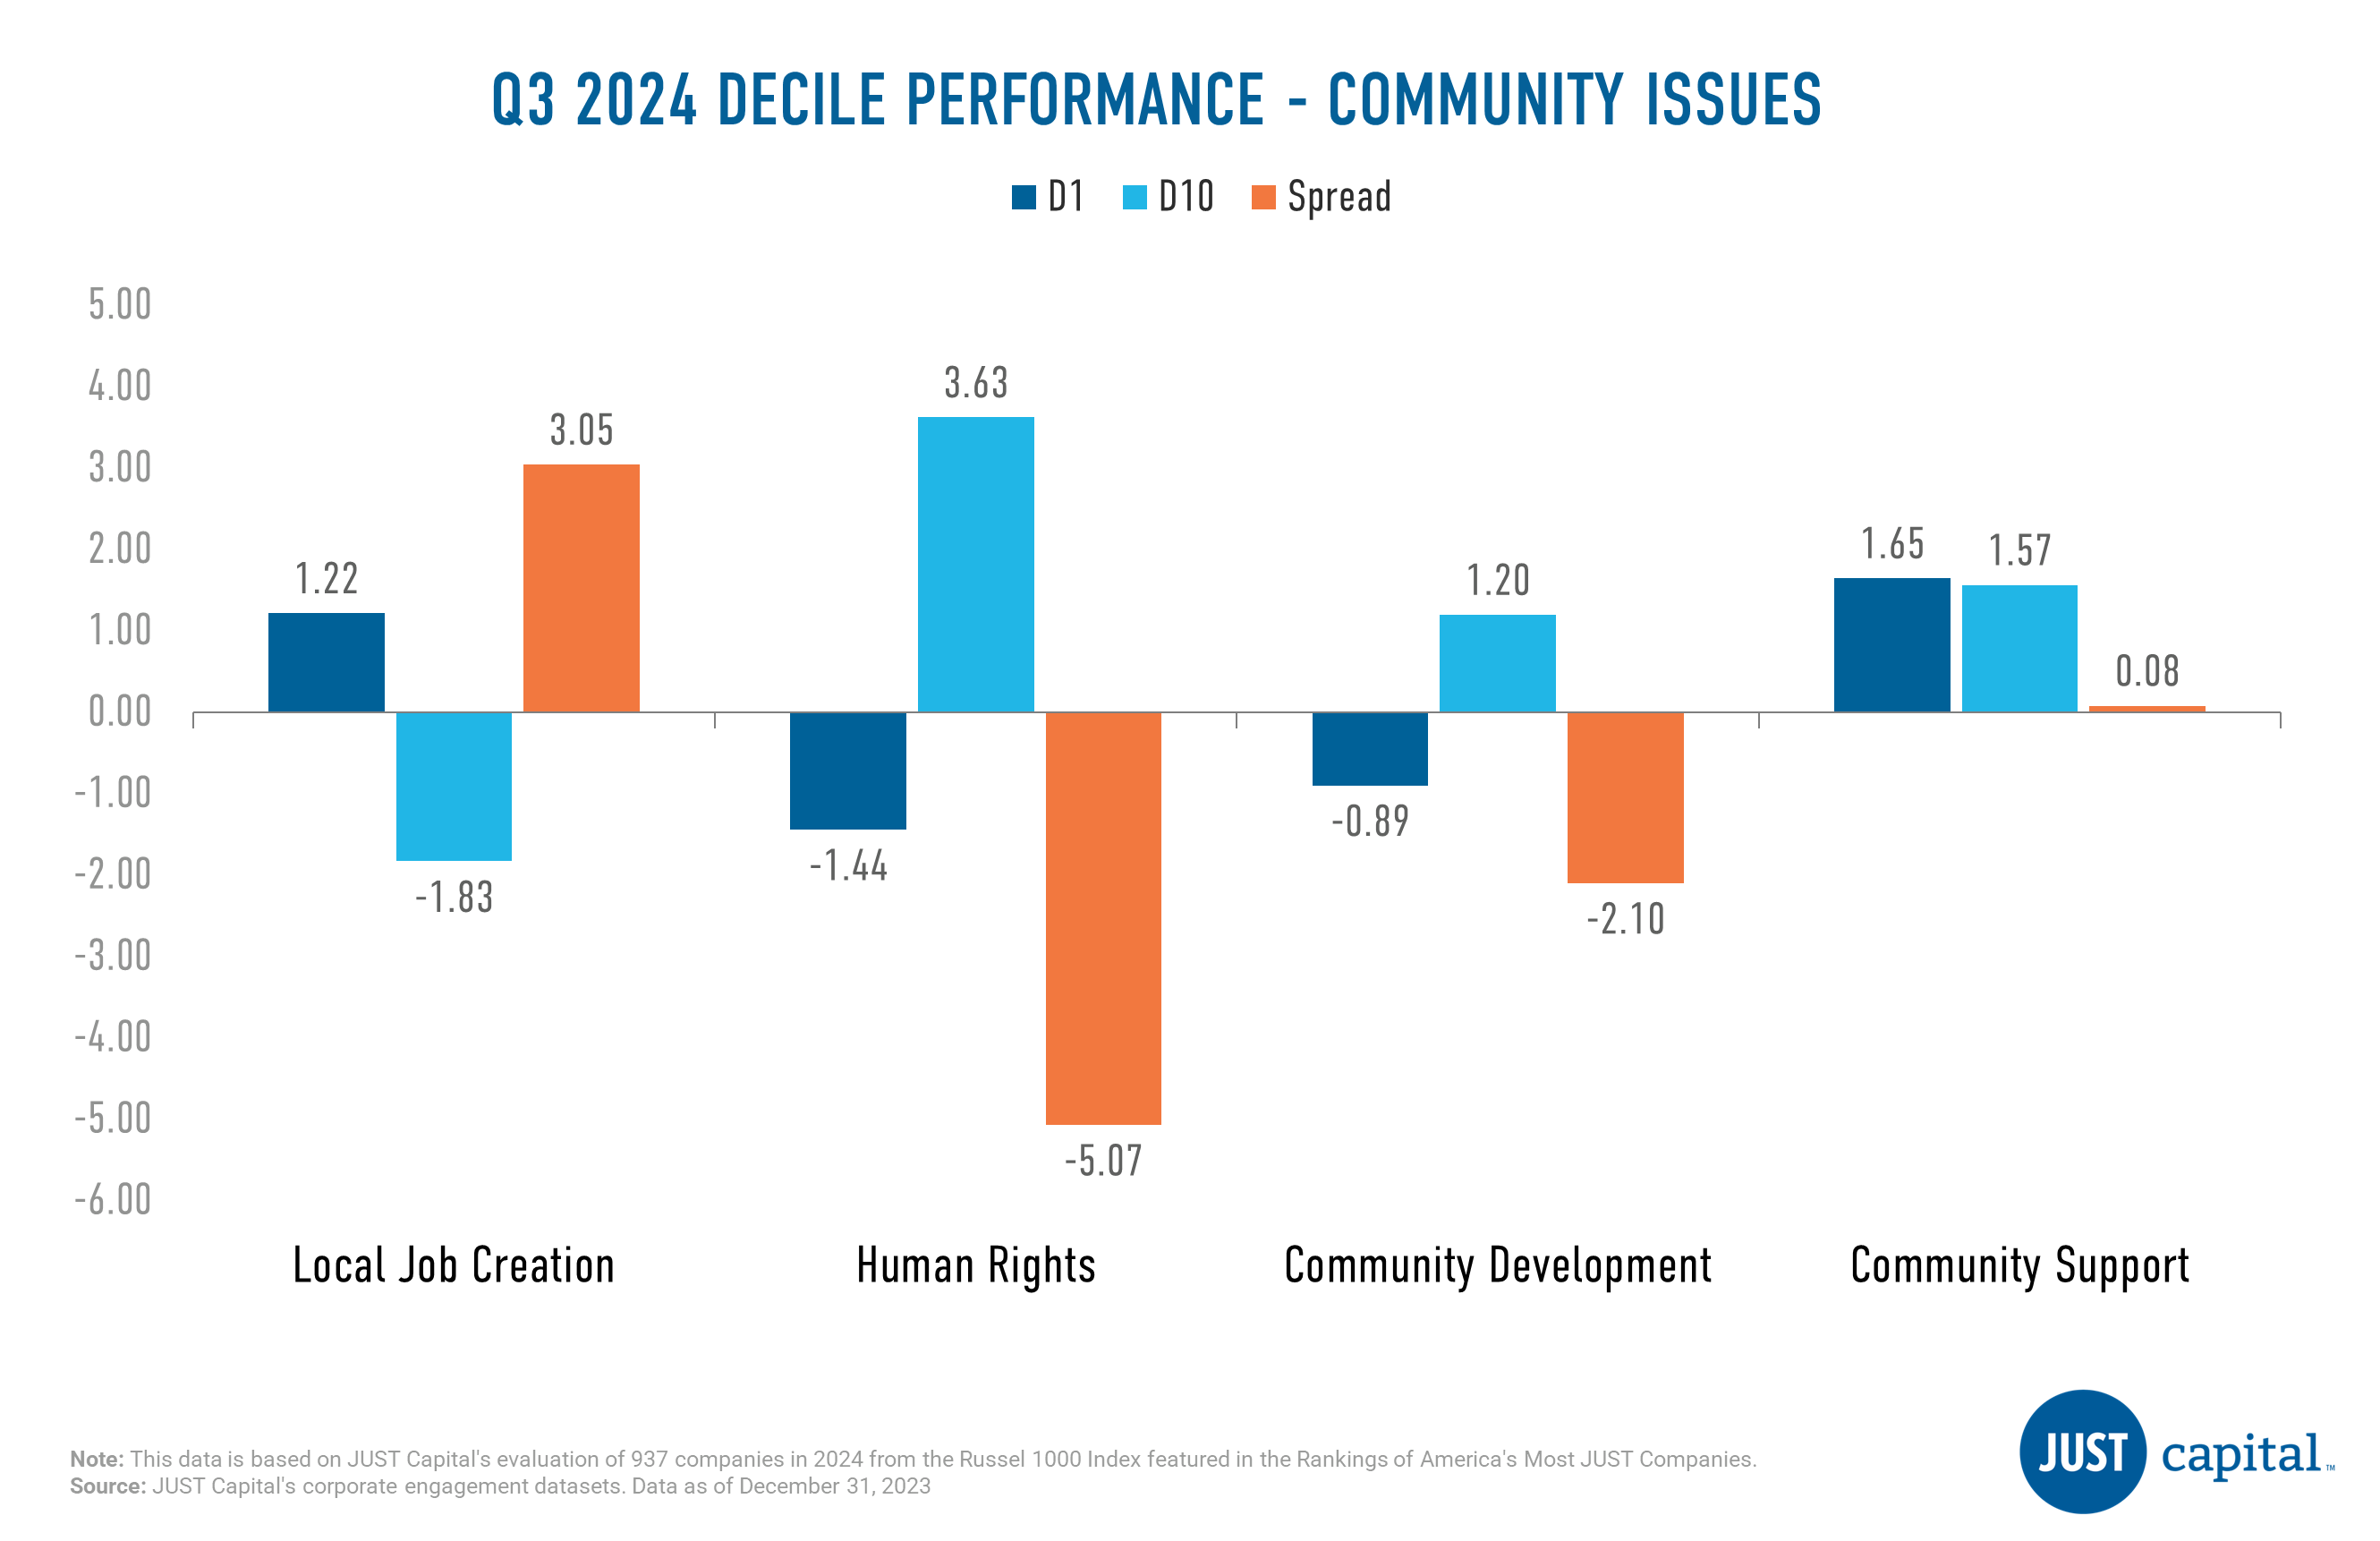
Local Job Creation was the strongest performer followed by Community Support. Human Rights and Community Development were negative contributors this quarter.
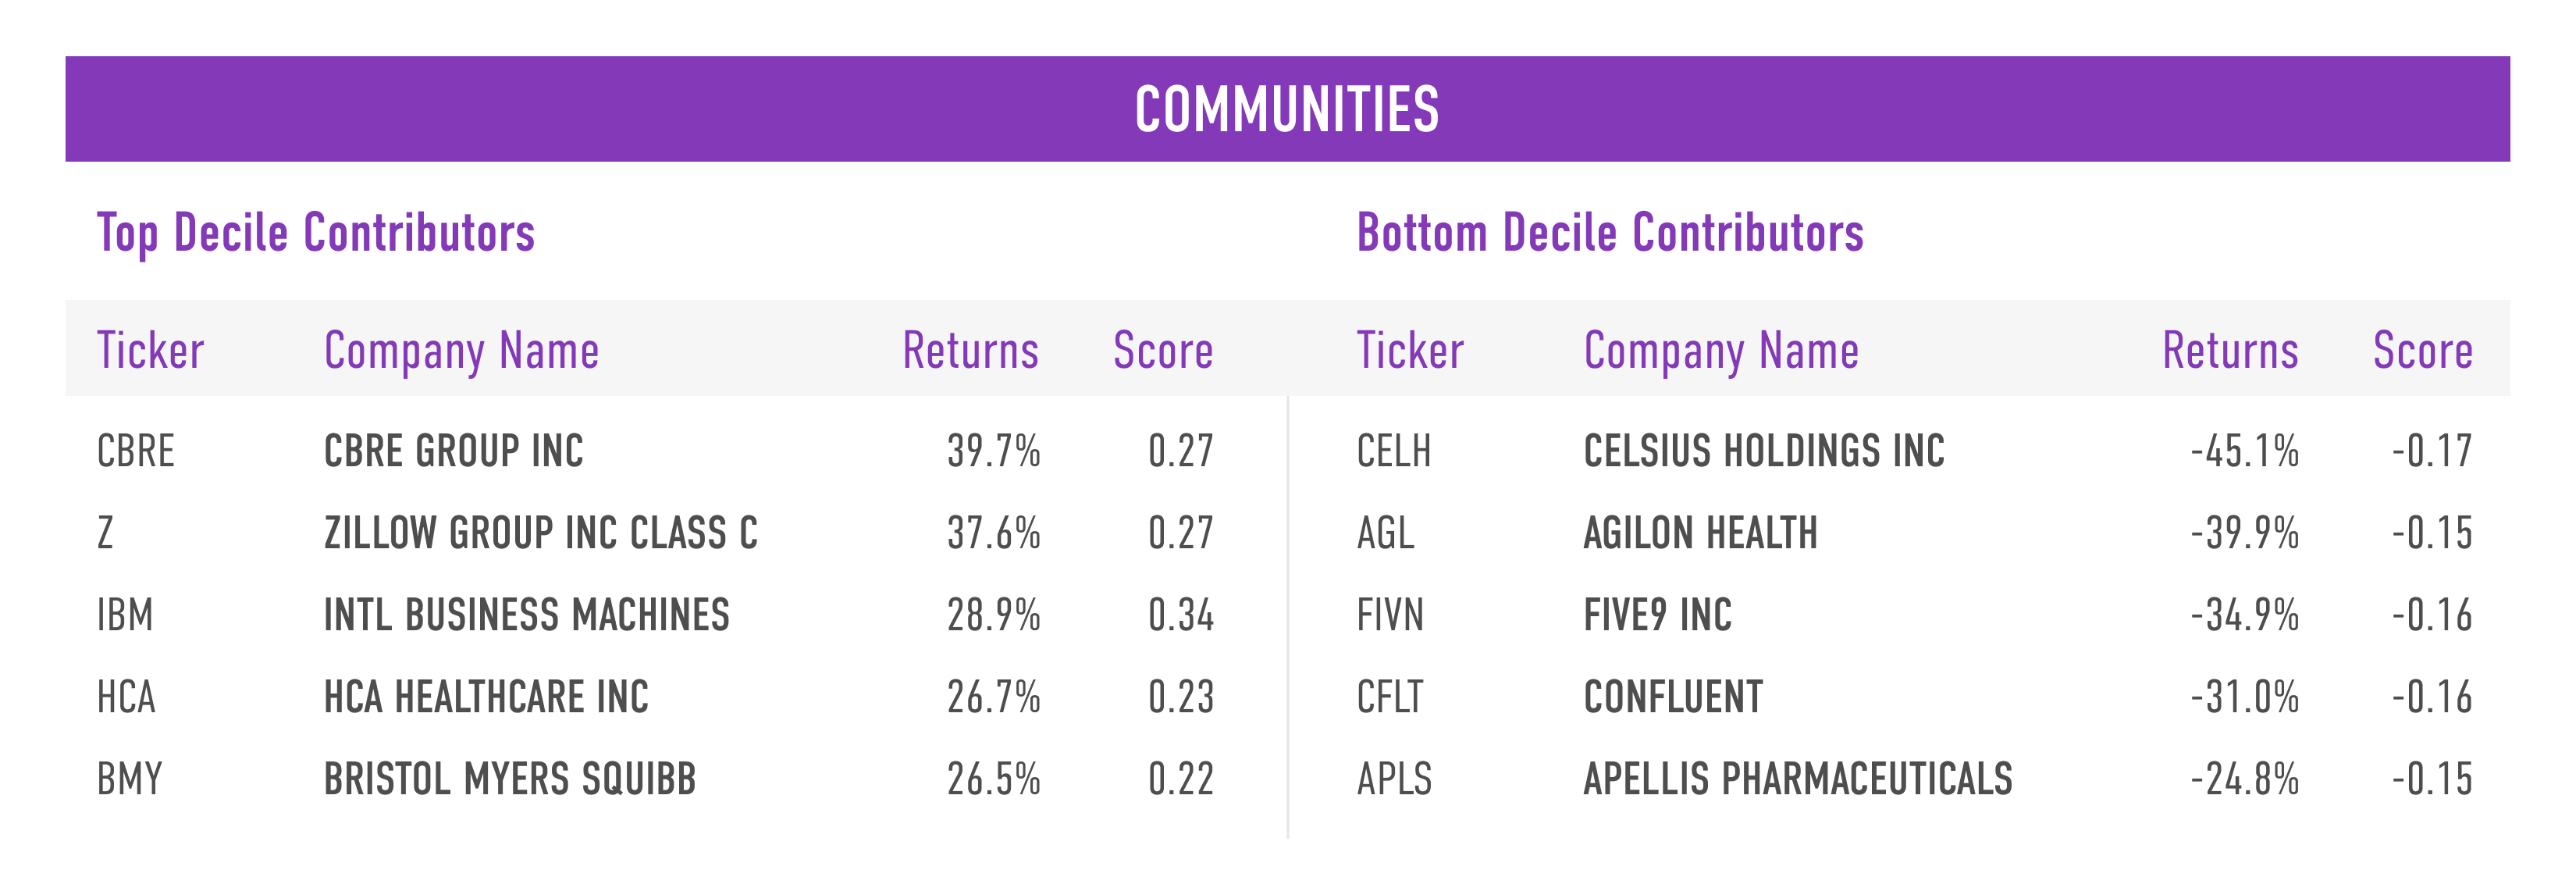
Shown below are the top and bottom five contributors to the top decile (D1), the best-ranked companies as measured by their Communities score, and the bottom decile (D10), the lowest-ranked companies as measured by their Communities score.
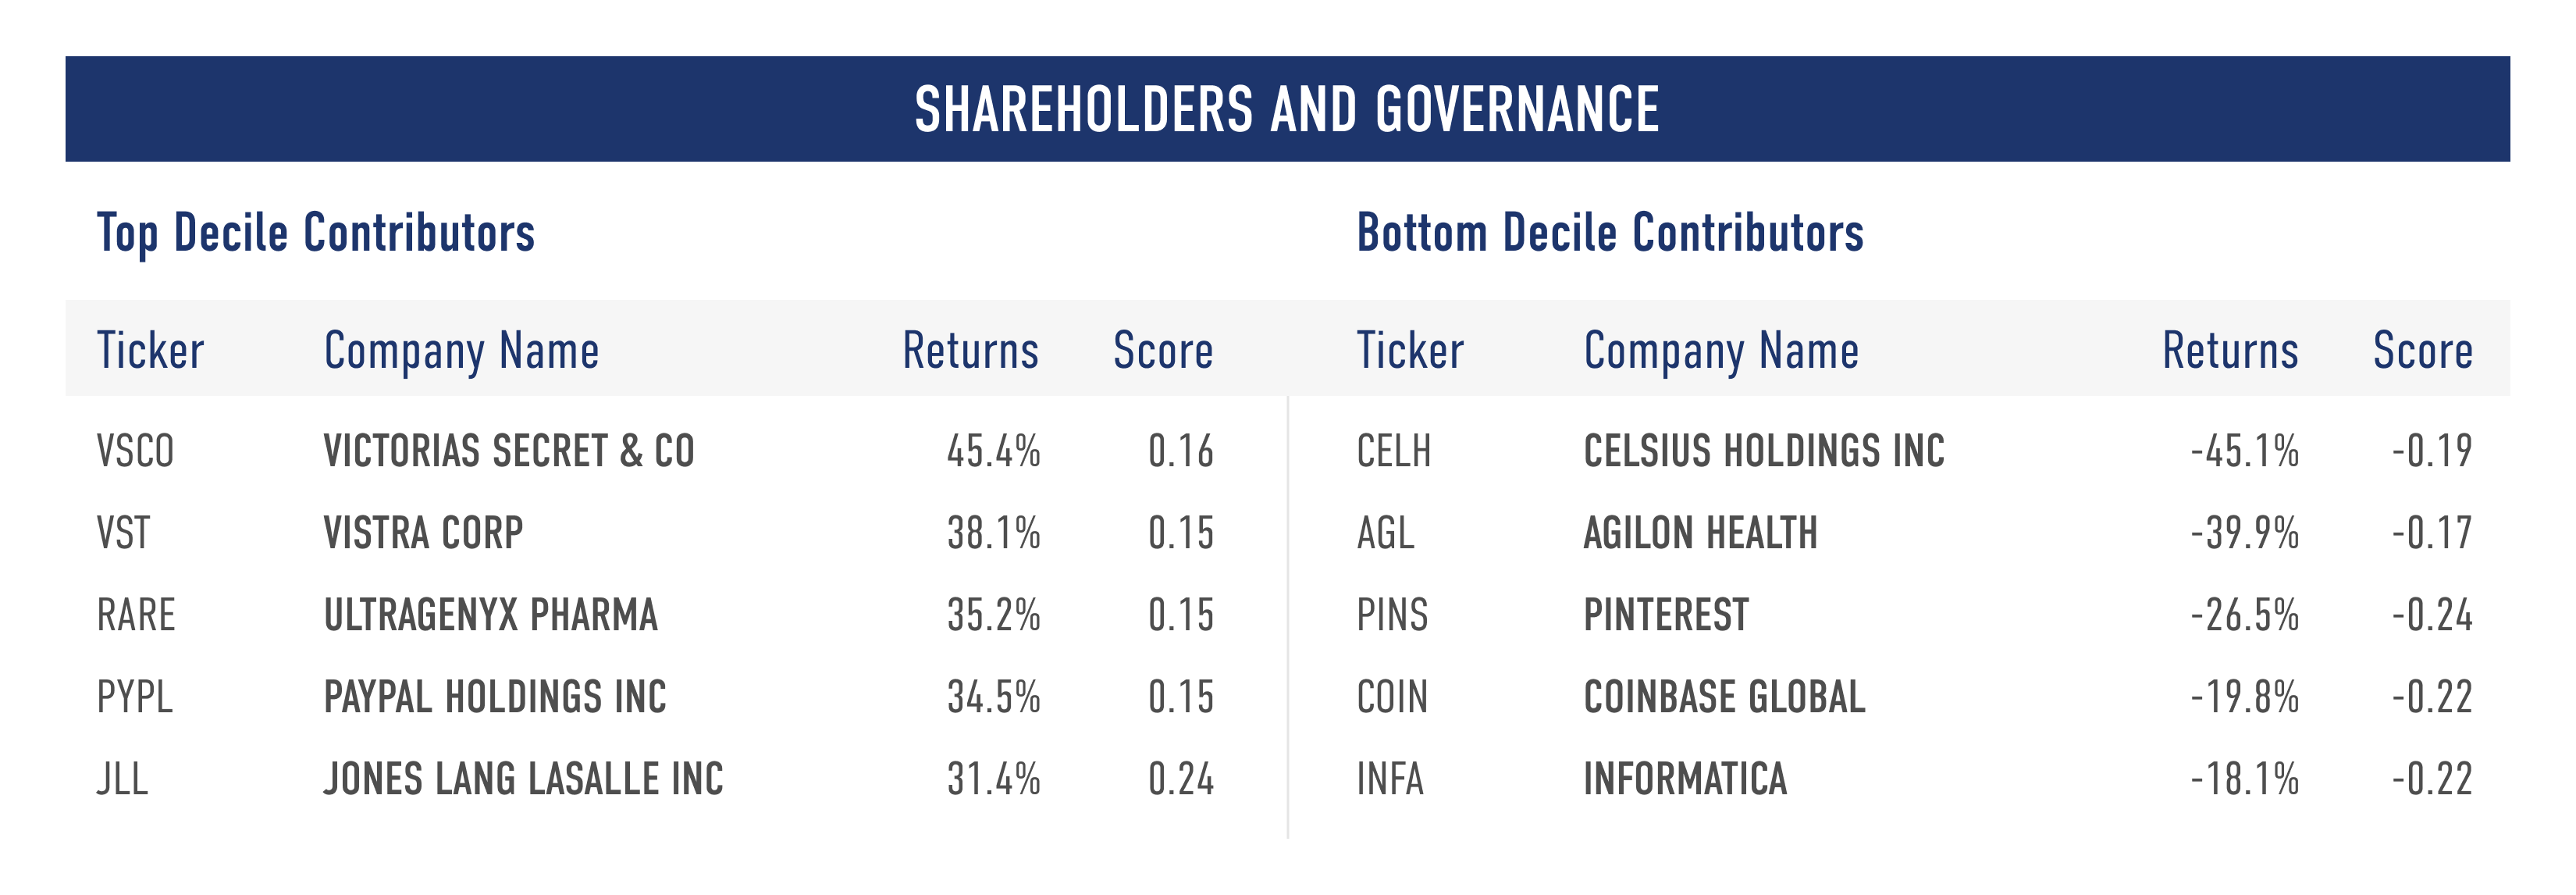
Shareholders and Governance
The Shareholders and Governance stakeholder measures a company across three Issues:
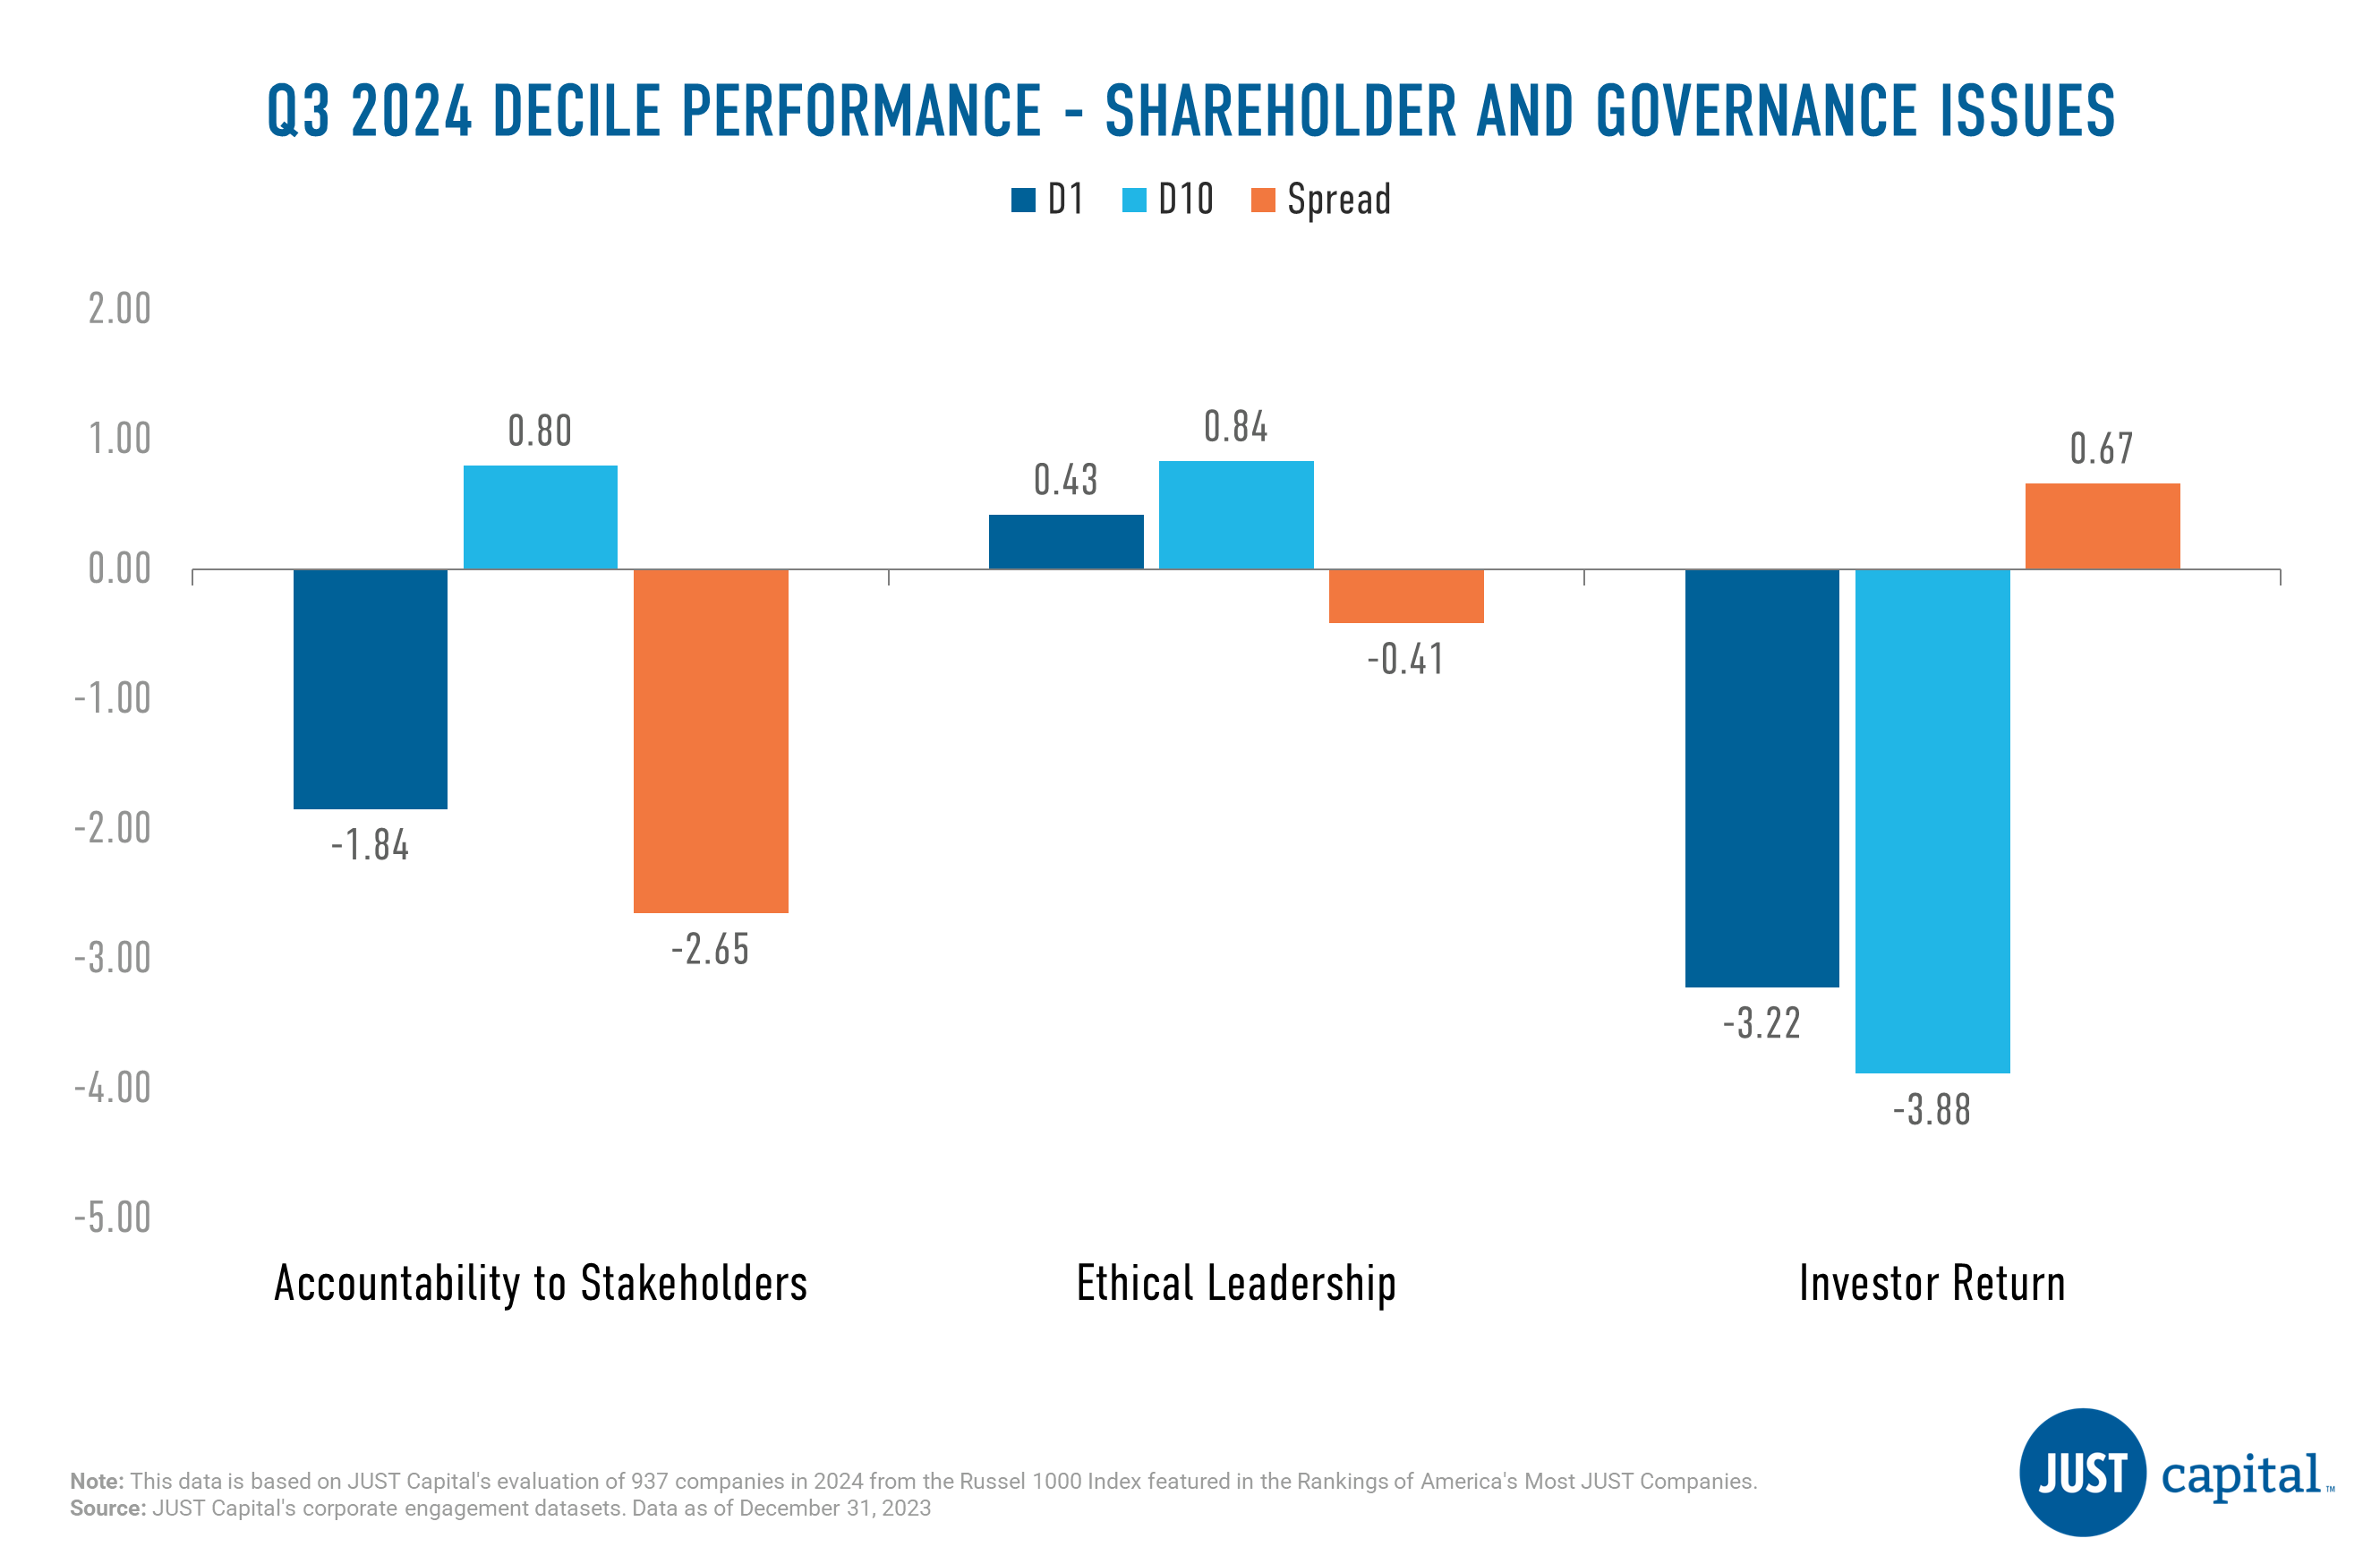
Investor Return Issue was the only positive performer in Q3 with a long-short spread of 0.67%. Remaining issues within the Shareholder stakeholder were negative this quarter.
Shown below are the top and bottom five contributors to the top decile (D1), the best-ranked companies as measured by their Shareholders and Governance score, and the bottom decile (D10), the lowest-ranked companies as measured by their Shareholders and Governance score.
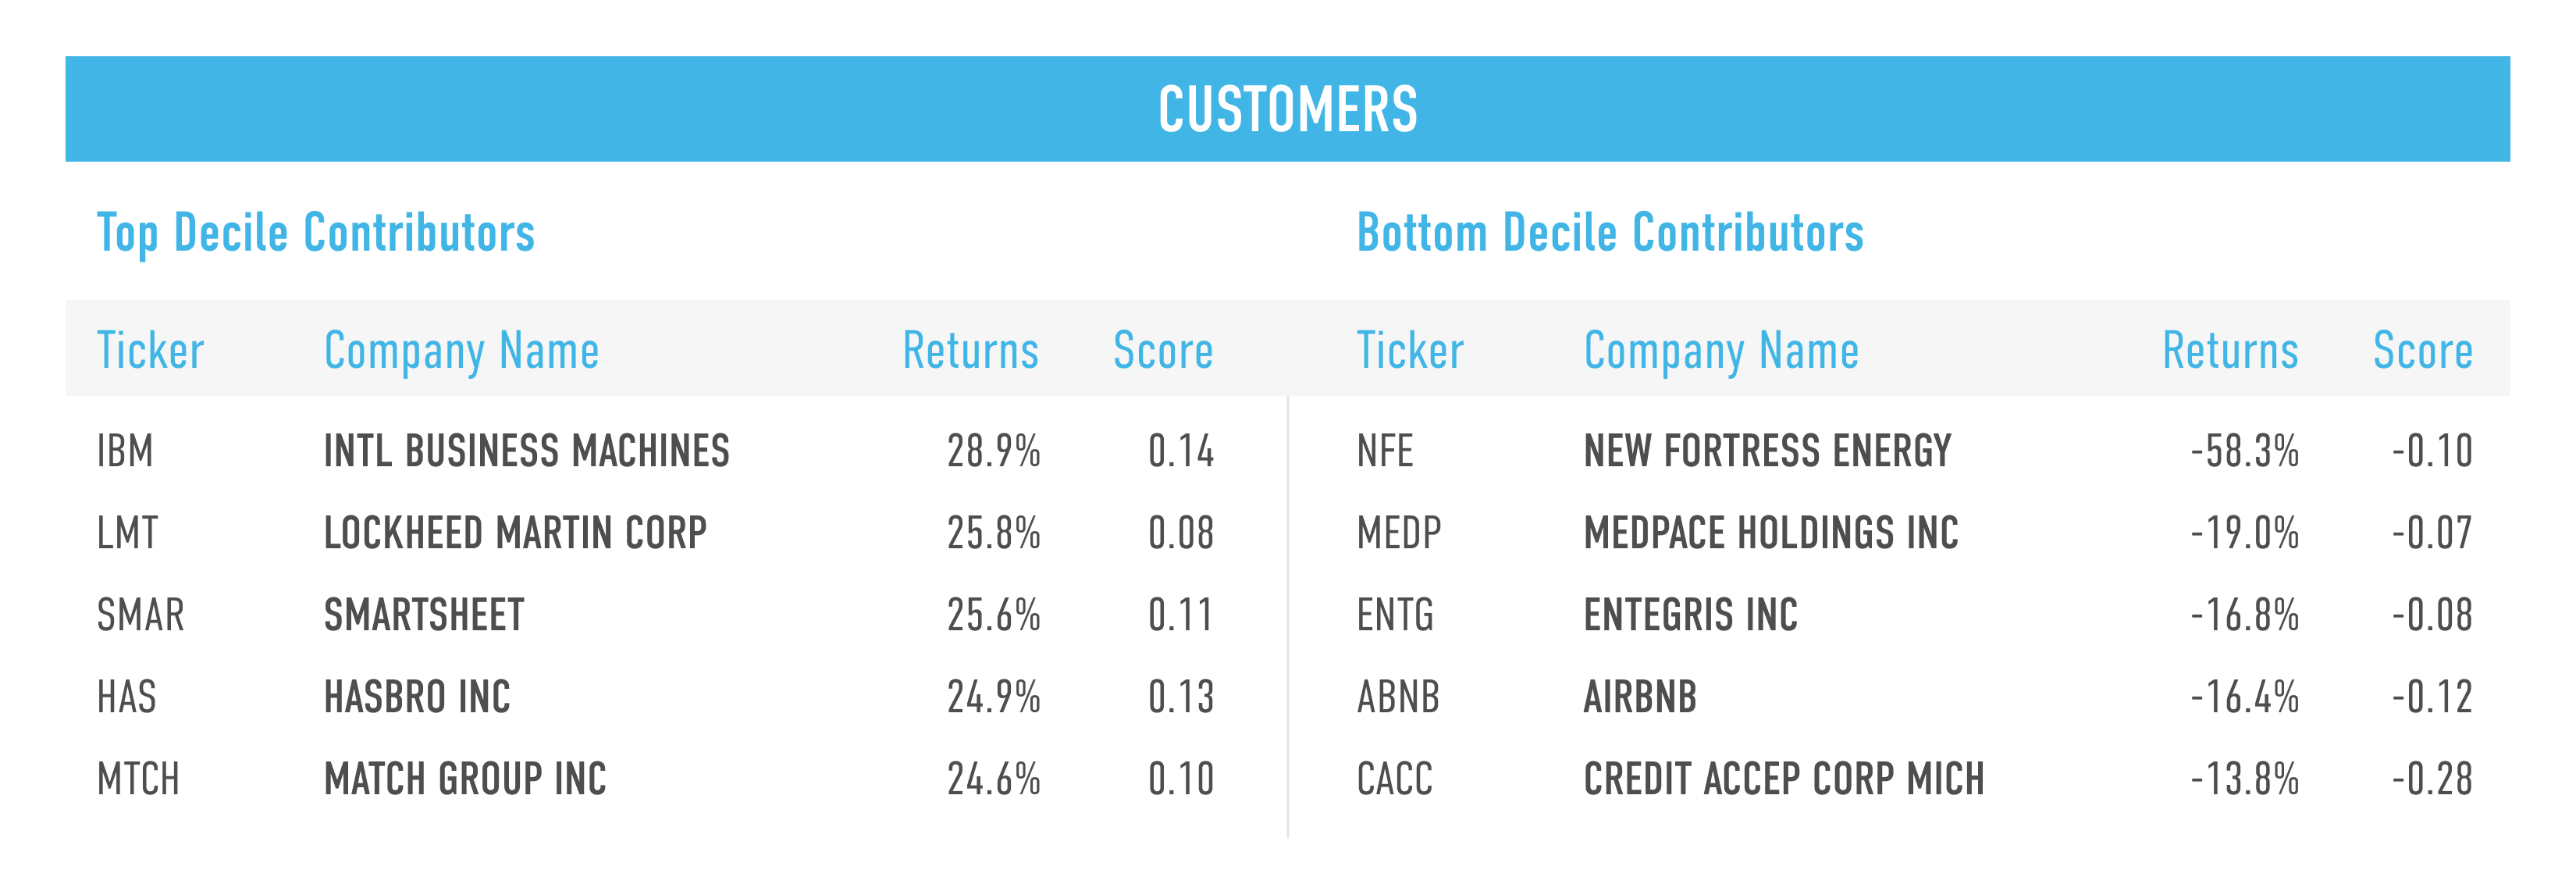
Customers
The Customers stakeholder measures a company across four Issues:

In Q3 2024, all four Customer Issues delivered negative performance. Customer Treatment was the weakest performer followed by Beneficial Products.
Shown below are the top and bottom five contributors to the top decile (D1), the best-ranked companies as measured by their Customers score, and the bottom decile (D10), the lowest-ranked names as measured by their Customers score.
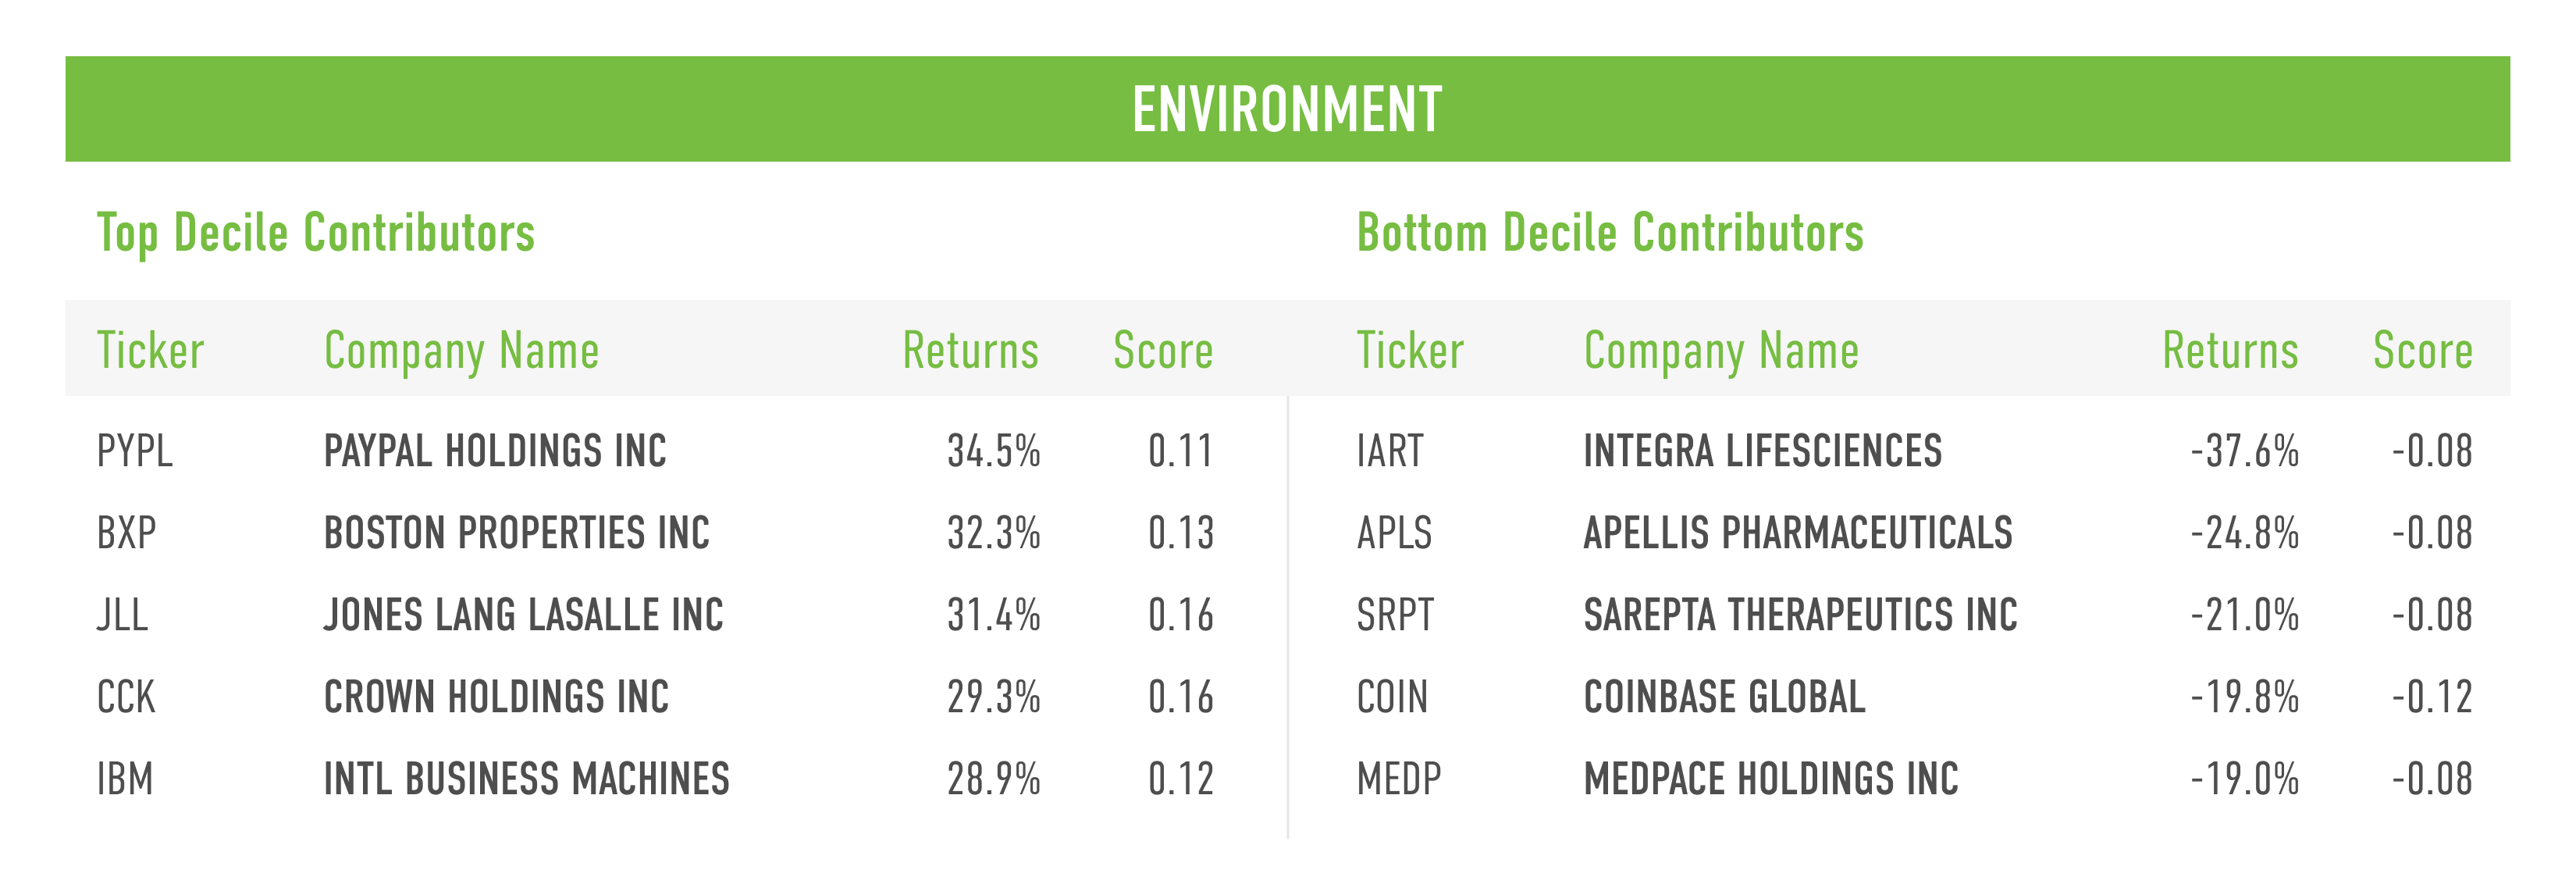
Environment
The Environment stakeholder measures a company across four Issues:
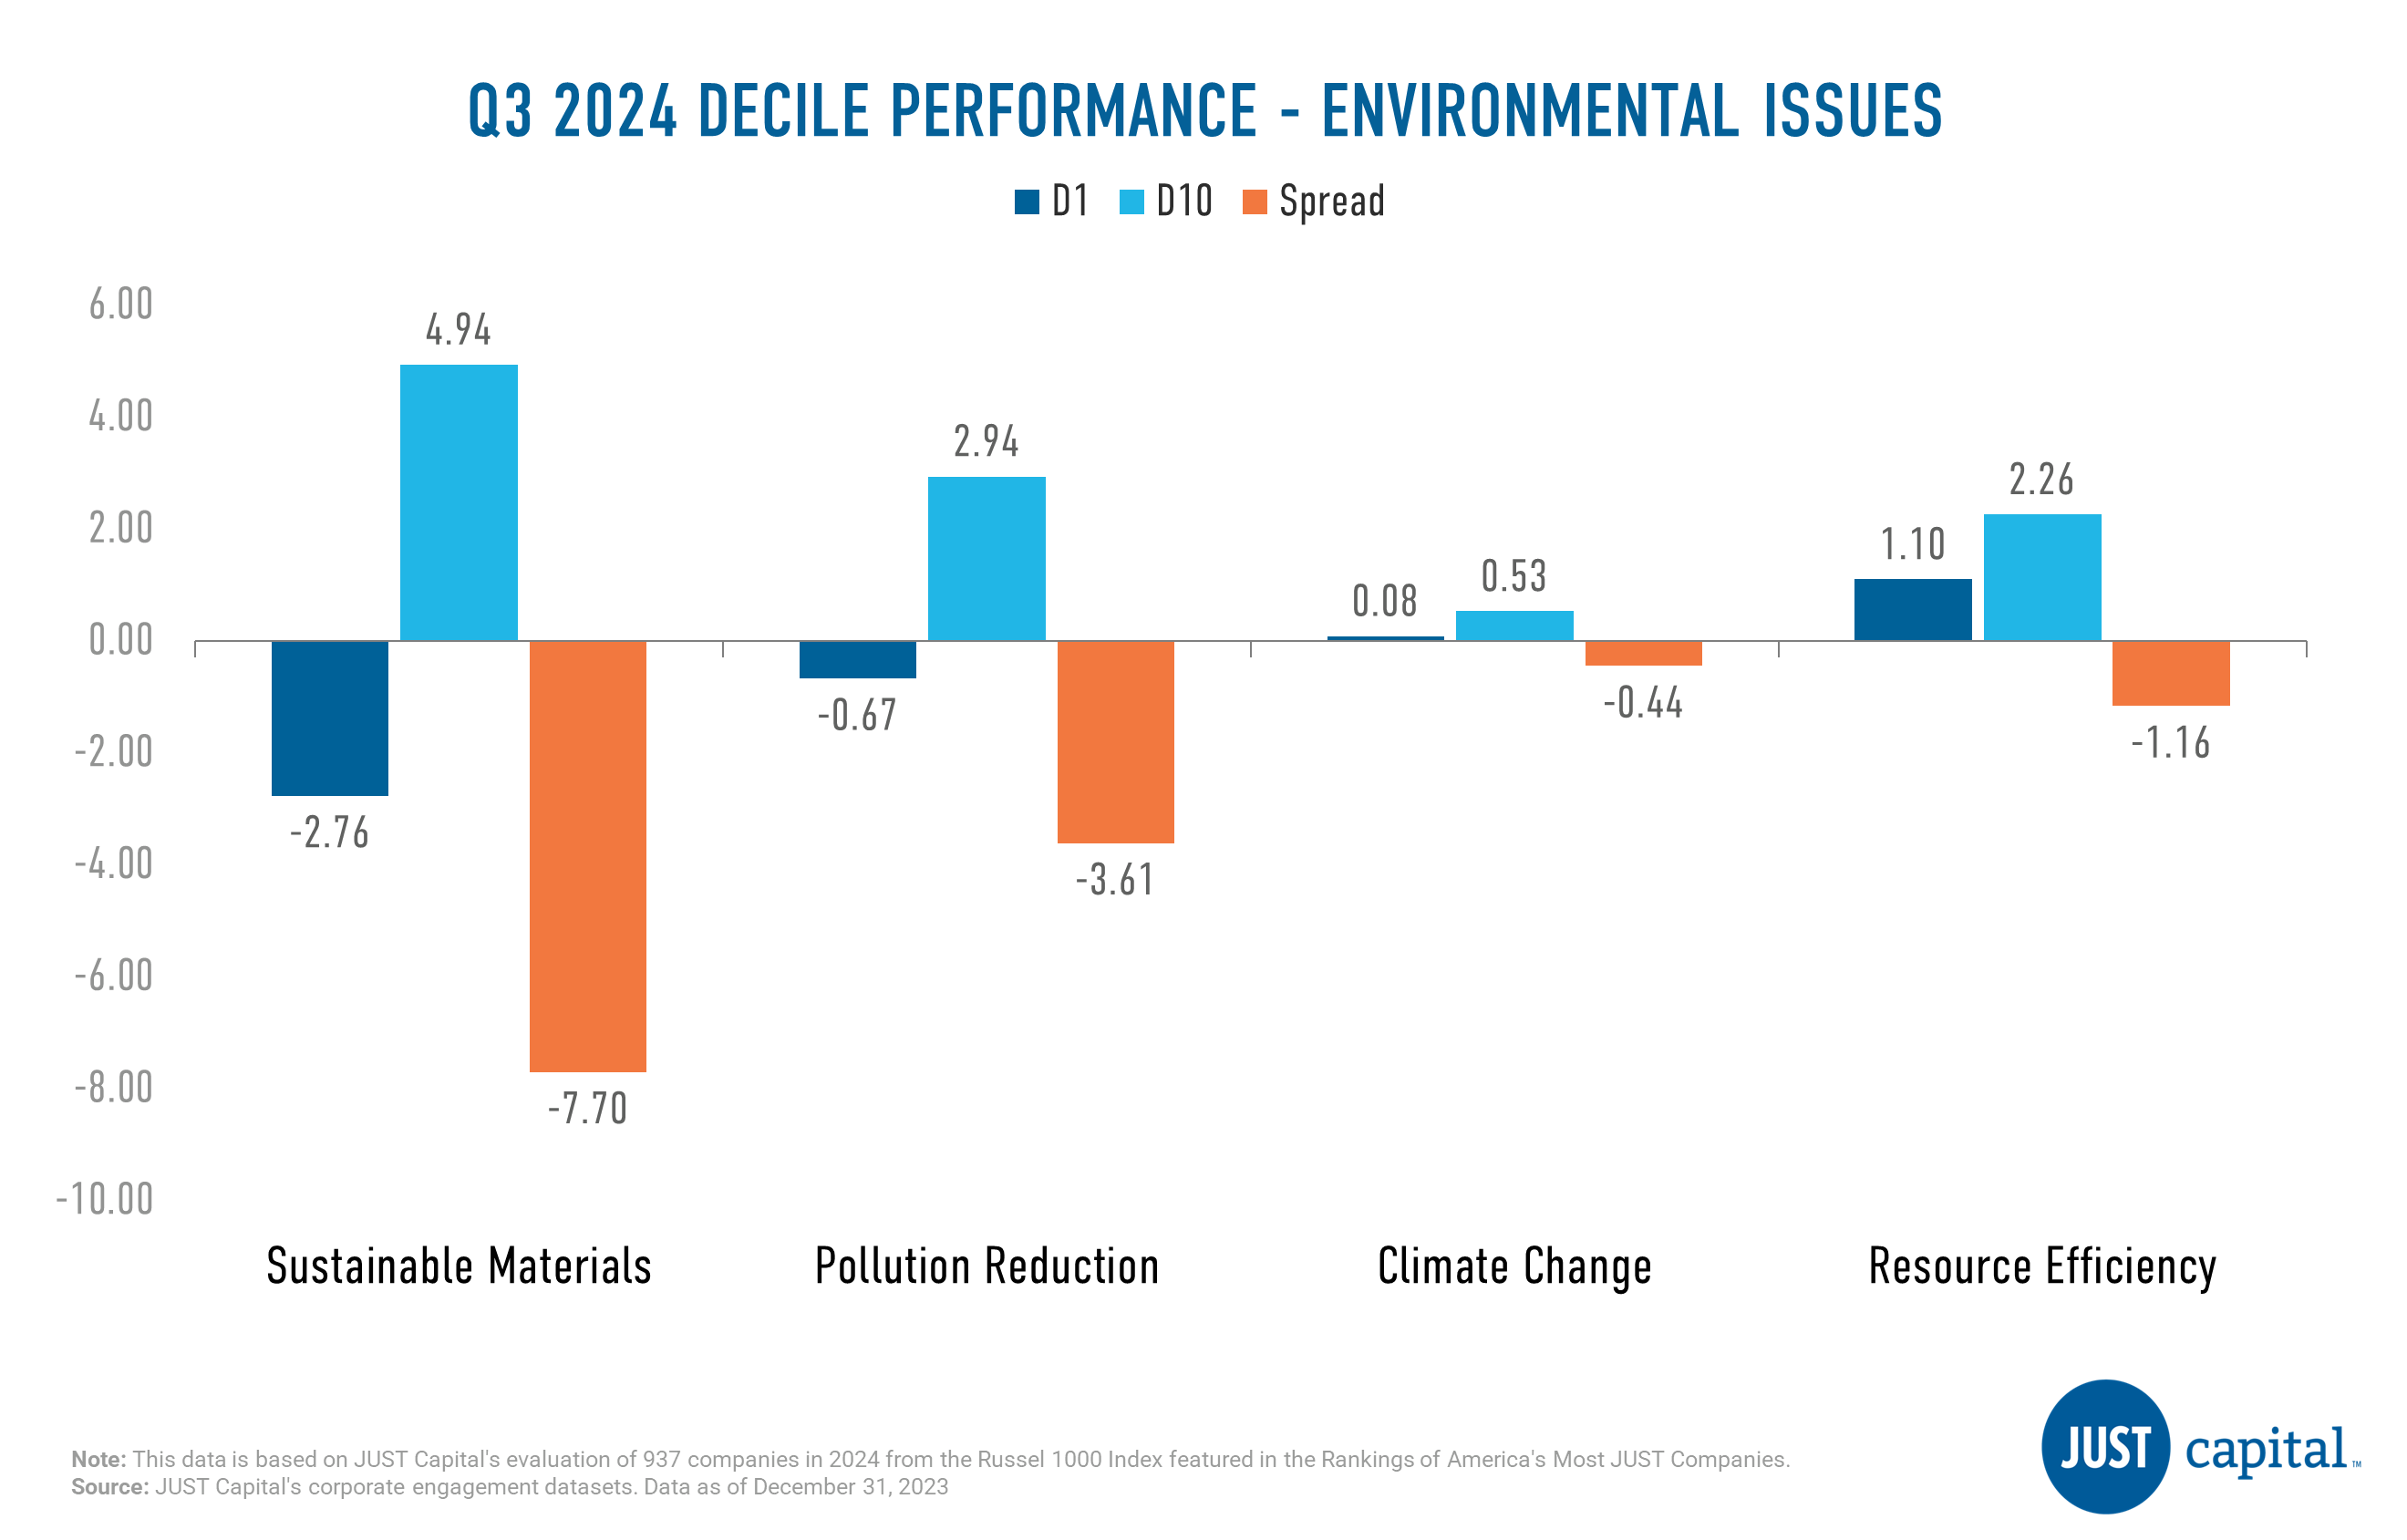
In Q3 2024, we saw all four Environmental issues deliver negative performance. Sustainable Materials was the worst performing issue within Environment stakeholder this quarter.
Shown below are the top and bottom five contributors to the top decile (D1), the best-ranked companies as measured by their Environment score, and the bottom decile (D10), the lowest-ranked companies as measured by their Environment score.
Computation Methodology
We monitor the performance of these stakeholders and Issues on a long-short basis. The long and short portfolios are selected based on the factor scores as the top and bottom deciles within the universe of companies we track in the Russell 1000. Top decile (D1) companies are those that rank highest based on the factor score, and bottom decile (D10) companies are those that rank lowest based on the factor score.
D1 Performance is computed as
(Equally weighted average of returns of stocks in D1 bucket) – (Equally weighted average of returns of all stocks within the Universe)
D10 Performance is computed as
(Equally weighted average of returns of stocks in D10 bucket) – (Equally weighted average of returns of all stocks within the Universe)
Spread is computed as
D1 Performance – D10 Performance

Warren Buffett’s public holdings are more likely to be outperformers on stakeholder value. So concludes an analysis released by Bain this week, which notes that his portfolio companies are predominantly in the top half of a global universe of 1,300 companies measured on employee, community and customer performance criteria, with one-third in the top quartile. It’s not quite clear precisely what the measurement criteria are, but the point remains: the world’s #1 investor, by coincidence or intent, has disproportionately allocated his capital to companies that align value creation for stakeholders with total return for shareholders.
A Forbes article published this week by JUST Board member and former Y&R CEO and Chairman Peter Georgescu delves deeper into the historical connections of corporate stakeholder performance, reminding us that, despite recent divisiveness and rollbacks, stakeholder capitalism is not a new idea. Indeed, its practice across decades of American business history has resulted in perhaps the greatest value creation success ever: the establishment of the American middle class.
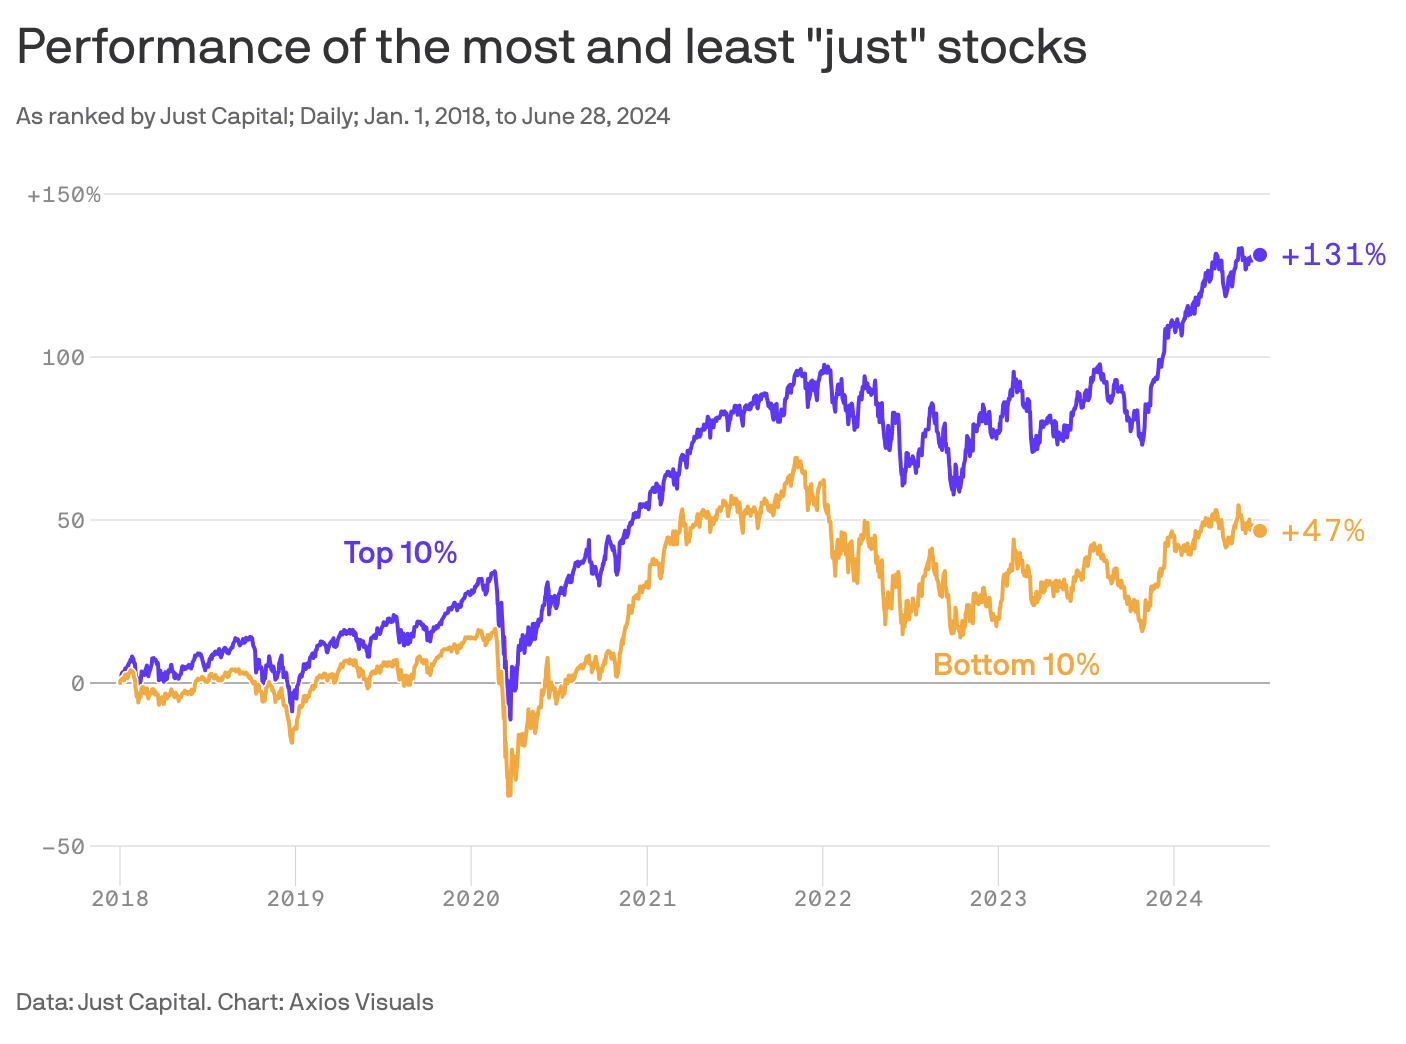
Per Axios reporting this week, the performance of the highest ranked companies in the JUST Annual Ranking compared to the lowest ranked companies brings this into sharp relief. Between January 2018 and August 30, 2024, the top 10% of companies in our rankings has beaten the bottom 10% by 92.85%. The performance of the JUST ETF tells a similar story. With a one-year return of 27.20%, the fund has surpassed not only the broader Russell 1000 index (by 0.62%) but also that of other U.S. large-cap ESG-focused ETFs. The JUST 100, which includes the top 100 companies from JUST Capital’s rankings, has outpaced its benchmark by 13.91% over the past year and an impressive 51.39% since its 2019 launch.
These are the kind of returns the Oracle of Omaha himself would be proud of.
Be well,
Martin

“How can Costco afford to pay so much more than other retailers, and provide its customers such low prices? Jim’s answer is always the same: paying your fellow workers well isn’t altruism, it’s good business. Costco’s employee turnover is a fraction of the rest of the retail industry – 8% compared to 60% – and its stock performance is so much higher.”
CNBC took a deep dive into some of the most interesting policies featured in our Top 10 Companies That Treat Employees Best list.
Axios spotlights JUST Capital data to make the case that ethical investing can produce financial returns.
JPMorgan Chase
JPMorgan Chase offers a minimum hourly wage of $20, which exceeds the Russell 1000 average and represents the third highest minimum wage among banks. The company also supports new parents with 16 weeks of paid parental leave for both primary and secondary caregivers and families with various caregiving services.
Cigna
Cigna prioritizes transparency by sharing highly detailed workforce demographic data by gender, race/ethnicity, and job category, reinforcing its focus on fostering an inclusive environment. Additionally, Cigna supports its employees’ work-life balance with key benefits including 18 days of paid time off and seven days of paid sick leave annually, paid parental leave, flexible scheduling opportunities, and emergency backup dependent care support.
Dayforce
Dayforce sets a high standard in the Software industry with its generous and inclusive parental leave policy, offering 17 weeks of paid leave to all caregivers. This is the highest offering at parity among the Top 10 companies and far surpasses the Russell 1000 average of 11 and 8 weeks of paid parental leave for primary and secondary caregivers, respectively.
Read about more leading policies here.
NPR reports that California is angling to be the first state to require safety standards for powerful AI models, particularly around testing for safety around a program’s ability to hurt our cyber infrastructure or shut down critical systems.
Axios reports on the slow trickle of companies dropping DEI from their companies, with Ford being the latest after external pushback. Meanwhile, Intelligencer looks at whether the attacks on corporate DEI programs are just encouraging companies to “hide” what they’re doing, and Forbes argues that dropping DEI programs is a short-sighted business strategy.
For Labor Day, The Washington Post looked at the swaths of disabled employees who make less than federal minimum wage due to an obscure law.
News Nation reveals that with the job market cooling, companies are offering lower salaries for new positions than they did in 2023.
Yahoo Finance reports that nearly 10,000 employees from Hilton, Marriott, and Hyatt went on strike this week for better pay and conditions.
This chart comes from a report of JUST Capital data by Felix Salmon at Axios, and shows that if you had invested in the top 100 companies in the JUST Ranking over the last few years, you would be outperforming the S&P 500, particularly if you shorted the worst. Dig into his research here, and explore some of our own index concepts here.