In the third quarter of 2024, the S&P 500 posted a gain of 5.9%, reflecting the resilience of equity markets as they overcame initial volatility, including a sharp 12% correction in the technology sector. This recovery was driven by a significant shift in Federal Reserve policy, with the Fed implementing a 0.50% rate cut in September, the first such reduction since March 2020.
Sector performance underscored a rotation from growth-oriented areas of the market to more stable, income-generating value sectors. Value stocks out-performed growth stocks, with value sectors like utilities, financials, and consumer staples gaining traction amid market uncertainty. Value stocks returned a robust 9% for the quarter, significantly outperforming growth stocks, which posted a more modest 3.6% gain. Utilities led the way with an impressive 19.4% return, followed by real estate investment trusts (REITs), which gained 17.2%, and financials, which rose 10.7%. These sectors benefited from their defensive characteristics and income-generating potential, which became more attractive as interest rate expectations shifted. Energy, however, was the sole sector in negative territory due to weaker demand and lower oil prices, although it remains up 8.4% year-to-date.
The Federal Reserve’s rate cut also supported a notable rally in small-cap stocks, which outperformed their large-cap counterparts. The Russell 2000 small-cap index gained 9.3% during the quarter, benefitting from the Fed’s dovish stance, as lower rates tend to favor smaller companies that are more sensitive to borrowing costs. This marked a reversal from earlier in the year, when large-cap growth stocks dominated due to their perceived stability in a volatile economic environment.
As of September 30, 2024, our flagship index – the Just U.S. Large Cap Diversified Index (JULCD) has out-performed the Russell 1000 (Cap-Weighted) benchmark by 0.46% year-to-date and by 11.97% since its inception. Additionally, the Just 100 (equally weighted index) has outperformed the Russell 1000 (Equally-Weighted) index by 7.38% year-to-date and by 51.1% since its inception.
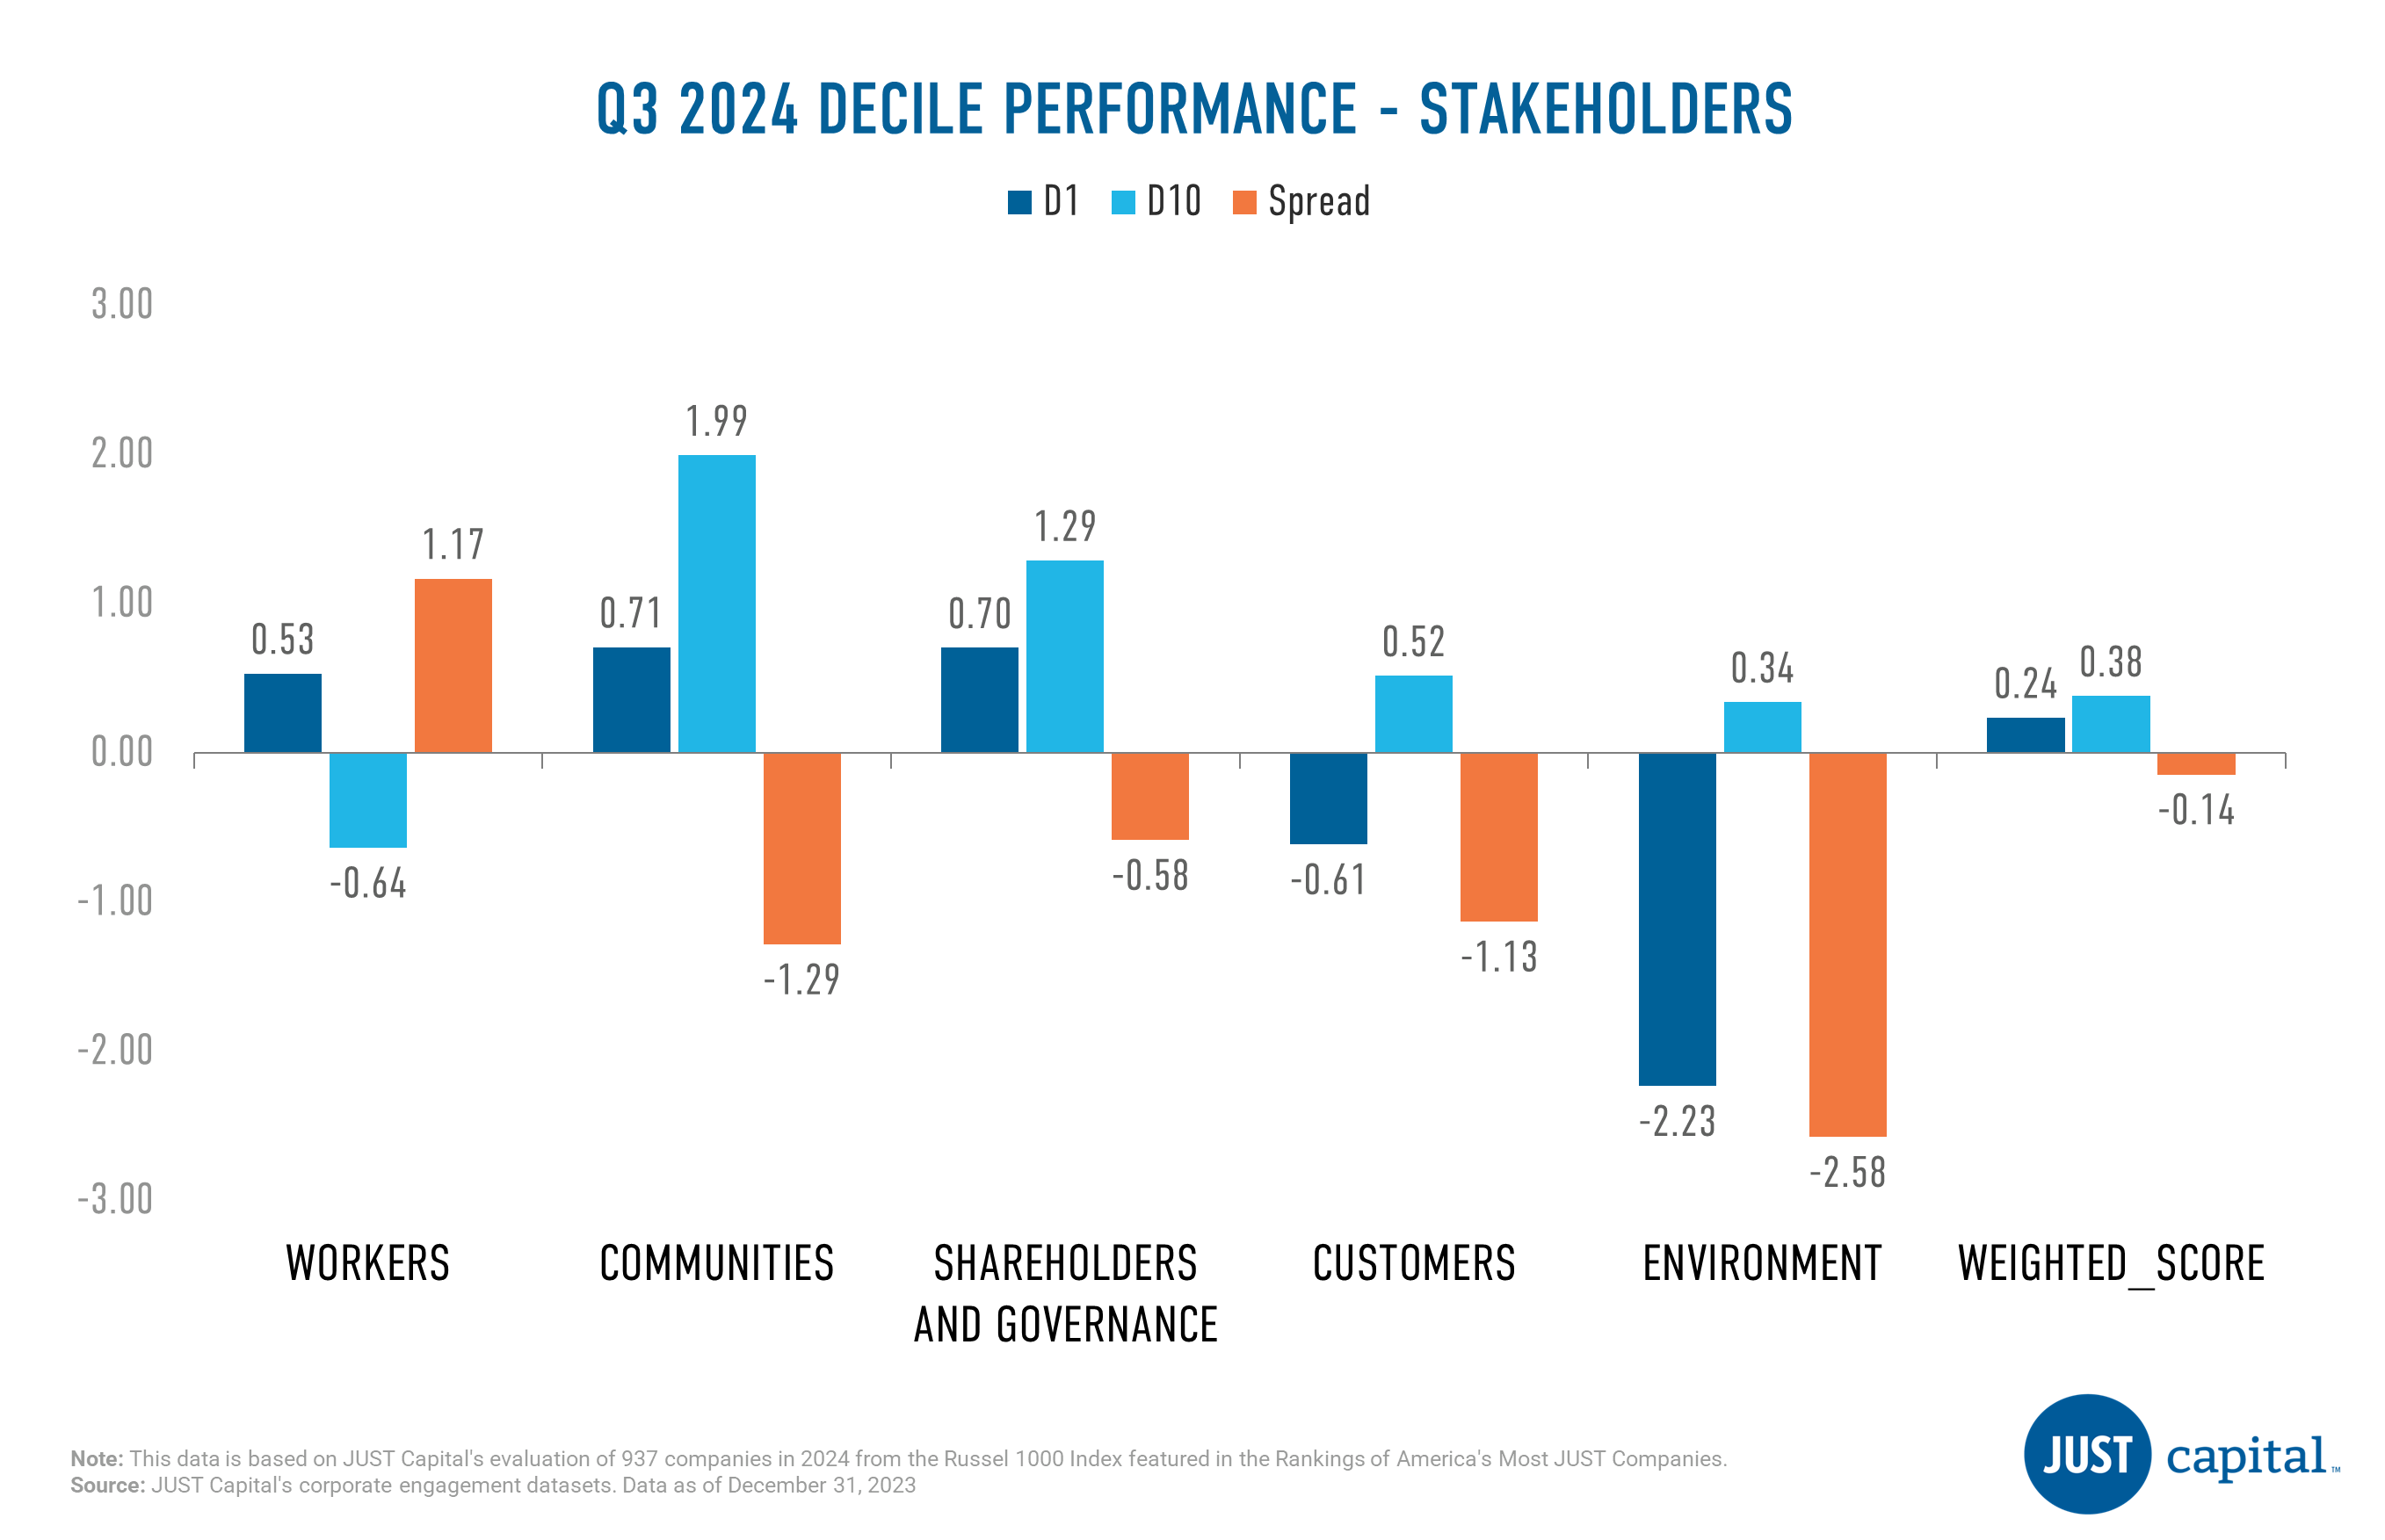
Just Capital found that four out of the five stakeholder categories it tracks delivered negative performance in Q3 2024, with the “Workers” stakeholder being the sole positive performer. The Workers stakeholder delivered the strongest performance over this period with a long-short spread of 1.17%. Notably, within the Workers stakeholder, outperformance was driven by both the top and bottom deciles.
Just Capital’s Overall Weighted Score takes into account the 20 core Issues determined through our annual survey research – including paying a living wage, creating a diverse, inclusive workplace, and helping combat climate change – across key business stakeholders: Workers, Communities, Shareholders & Governance, Customers, and Environment. The Overall Weighted Score delivered an almost neutral long-short spread of -0.14%, with the bottom decile serving as the primary negative contributor for the period ending September 30, 2024. Year-to-date the performance spread between top and bottom decile for Overall Score is at 9.11%
Workers
The Workers stakeholder measures a company across five Issues:
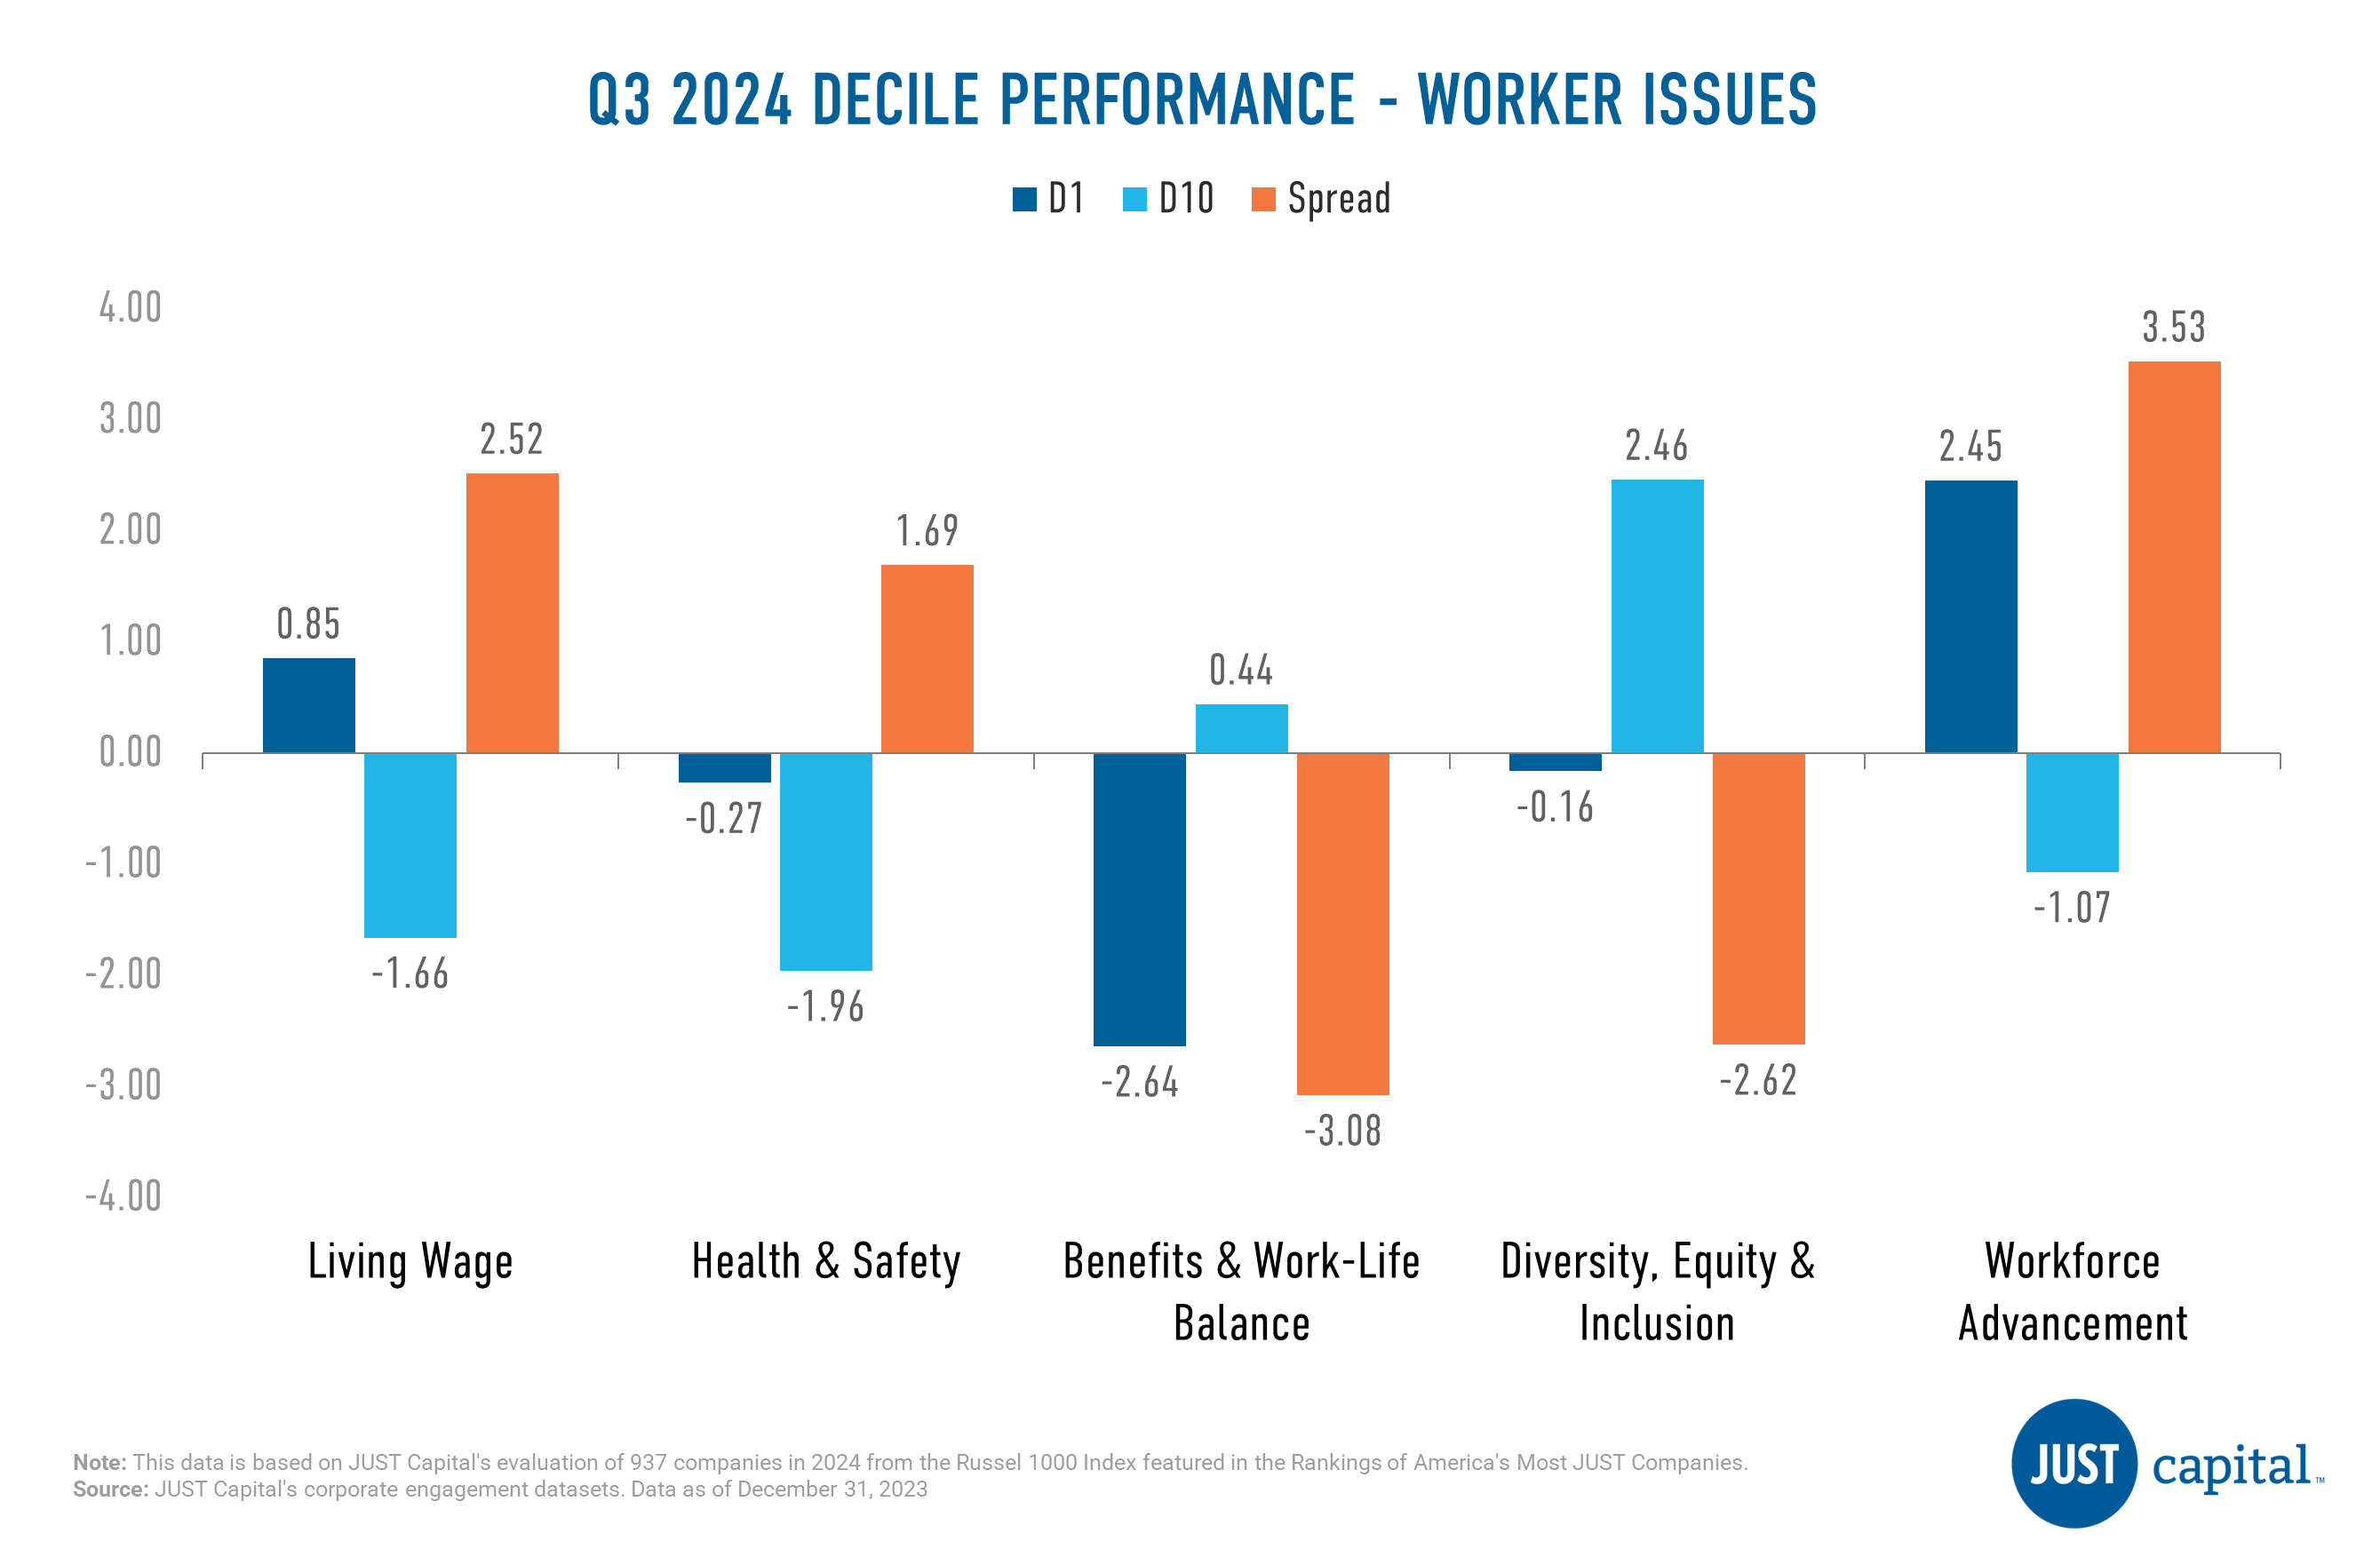
In Q3 2024, we saw three out of five issues deliver positive performance, with the Workforce Advancement Issue faring the best. Benefits & Work-Life Balance was the weakest performer amongst the Worker issues.
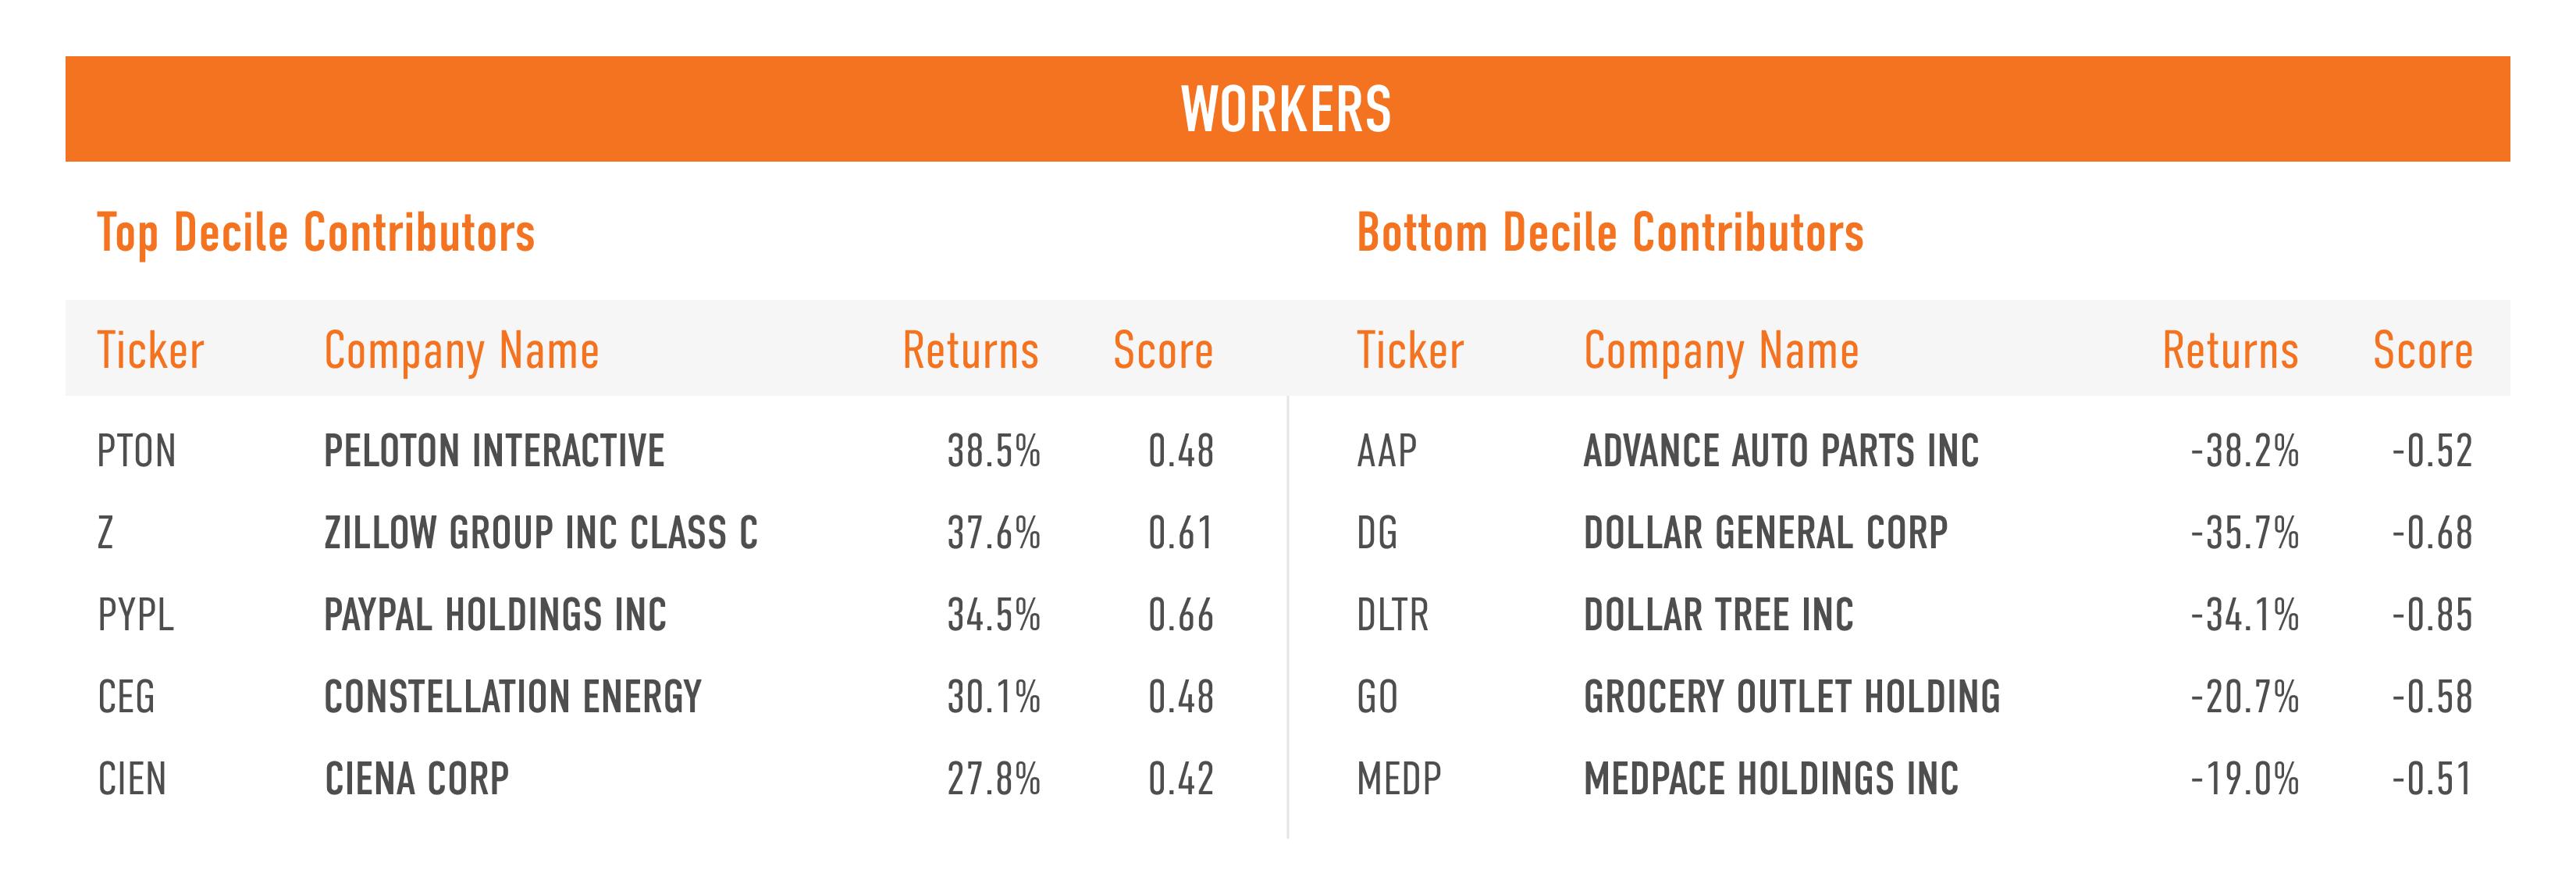
Shown below are the top and bottom five contributors to the top decile (D1), the top-ranked companies as measured by their Workers score, and the bottom decile (D10), the lowest-ranked companies as measured by their Workers score.
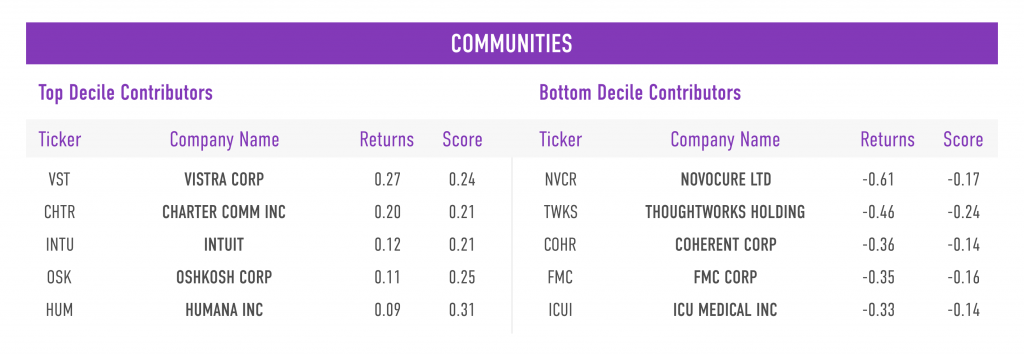
The Communities stakeholder measures a company across four Issues:
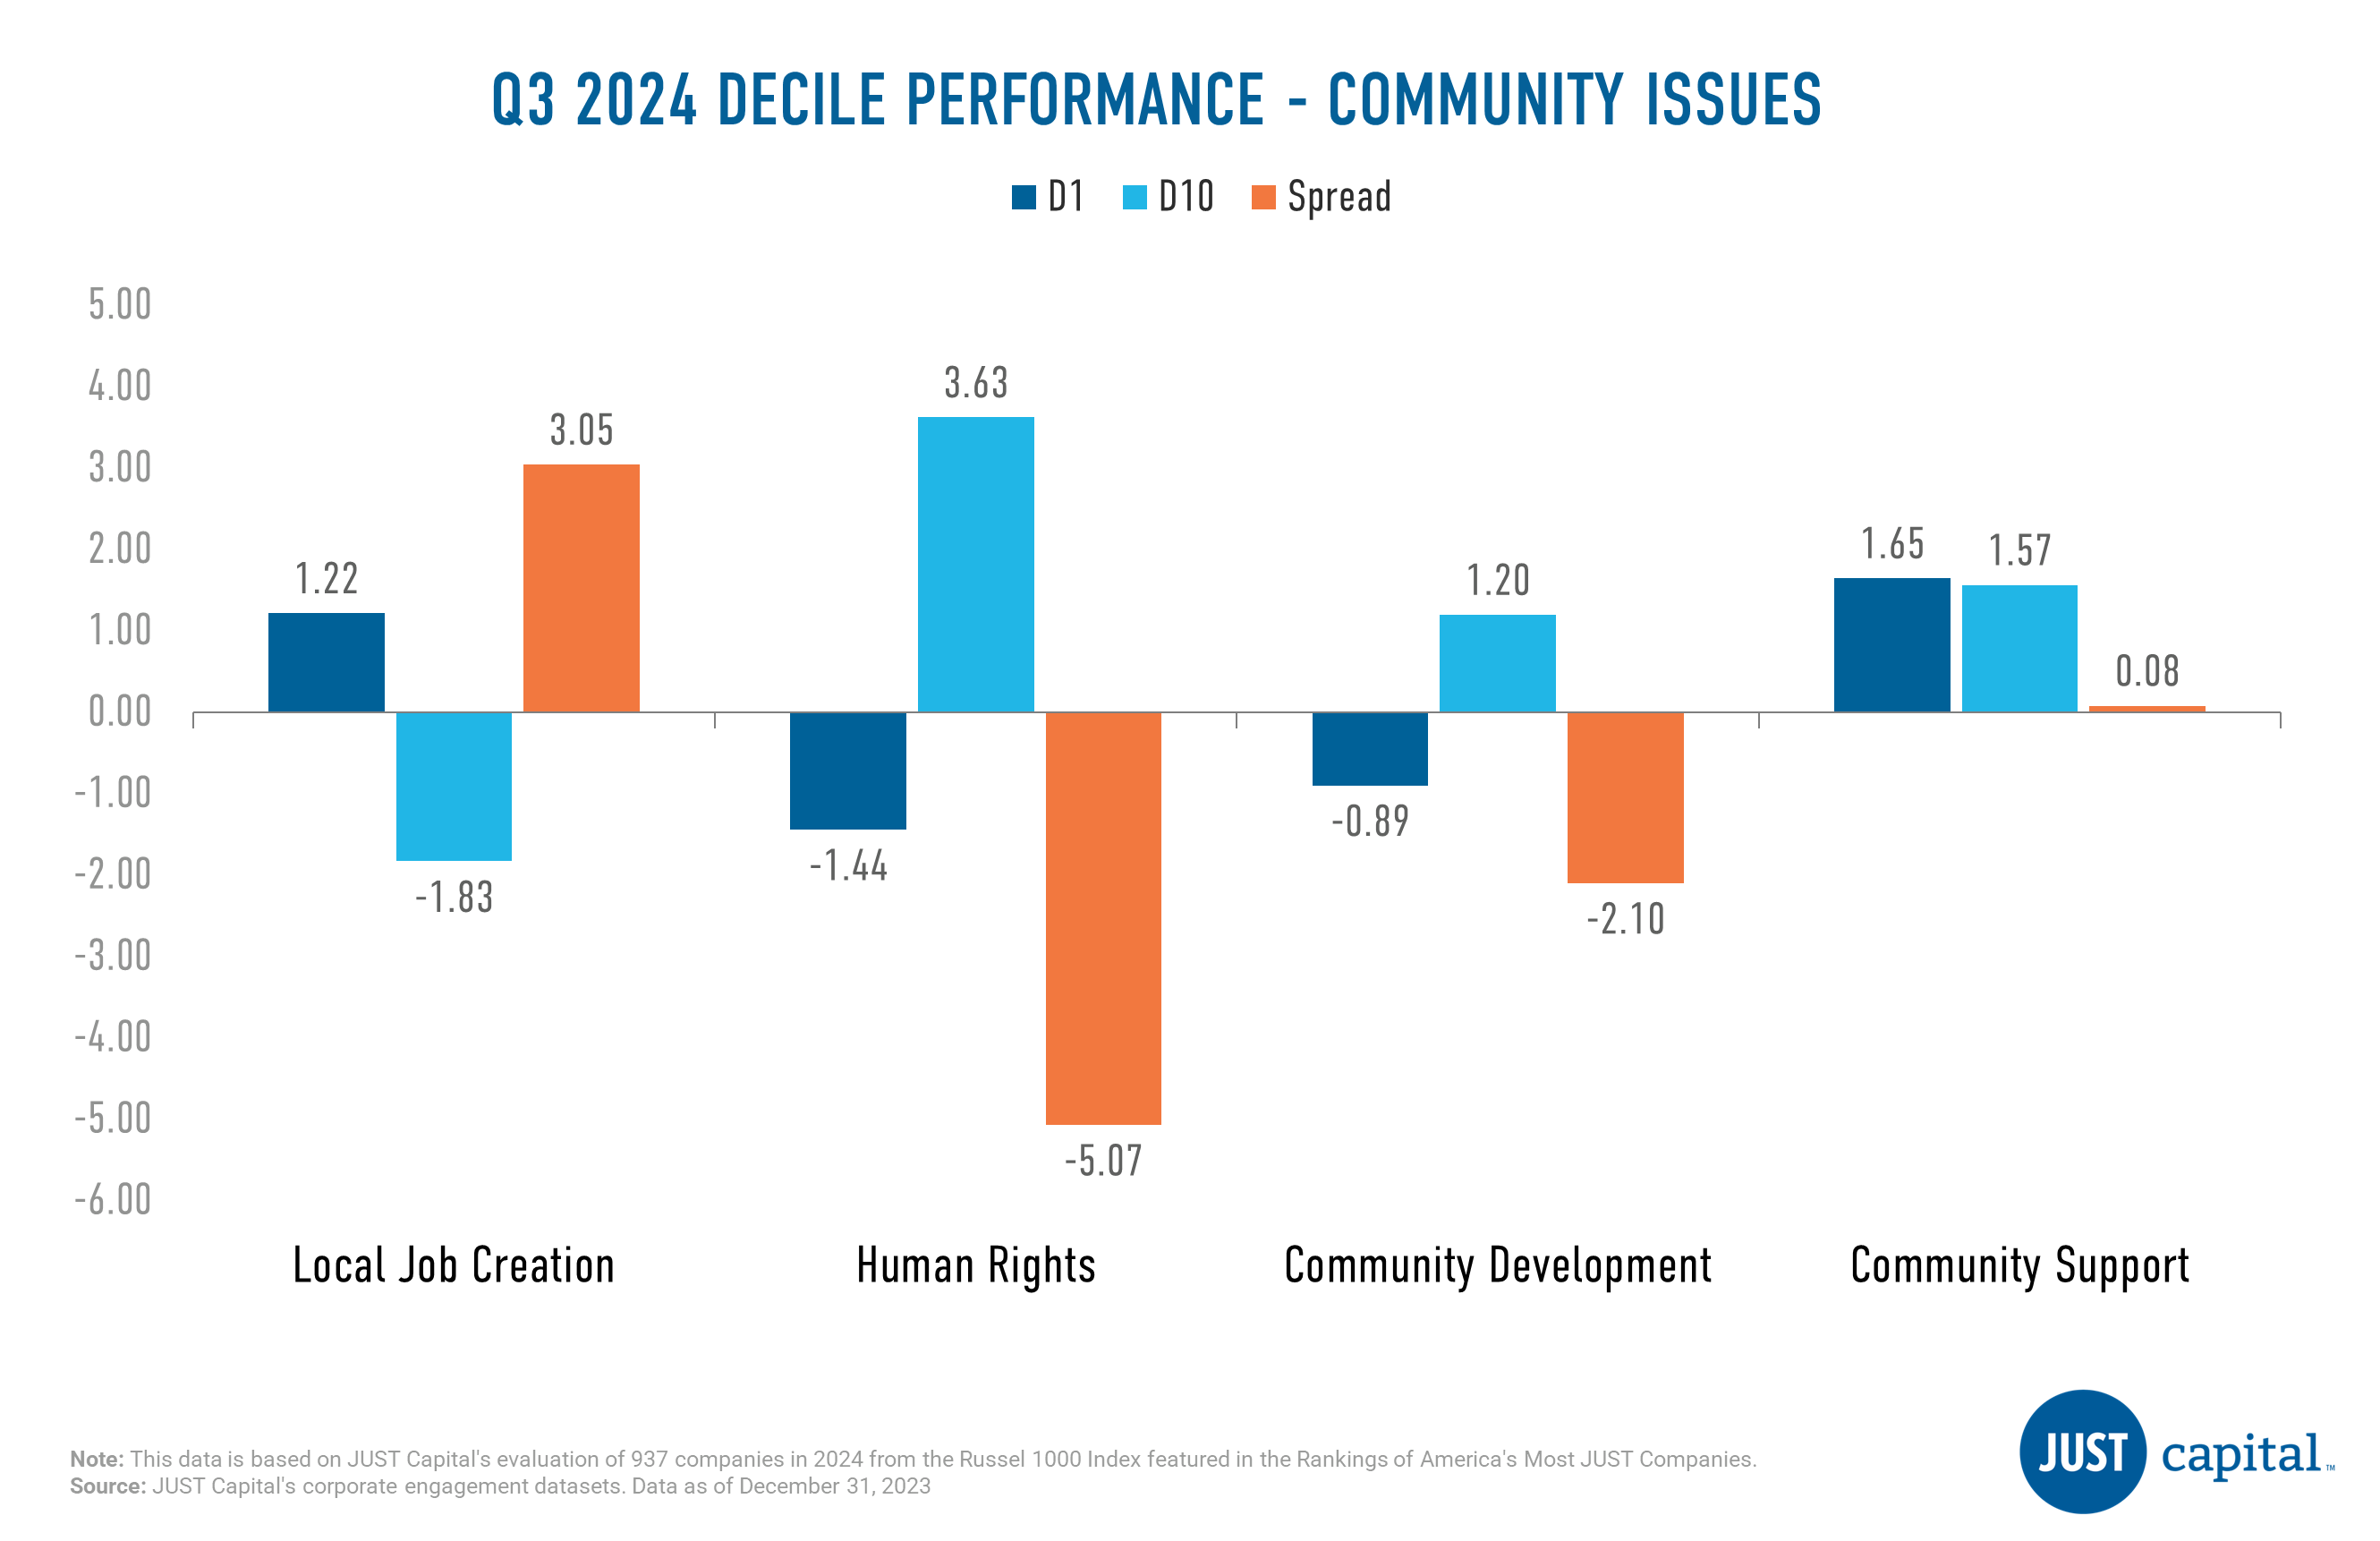
Local Job Creation was the strongest performer followed by Community Support. Human Rights and Community Development were negative contributors this quarter.
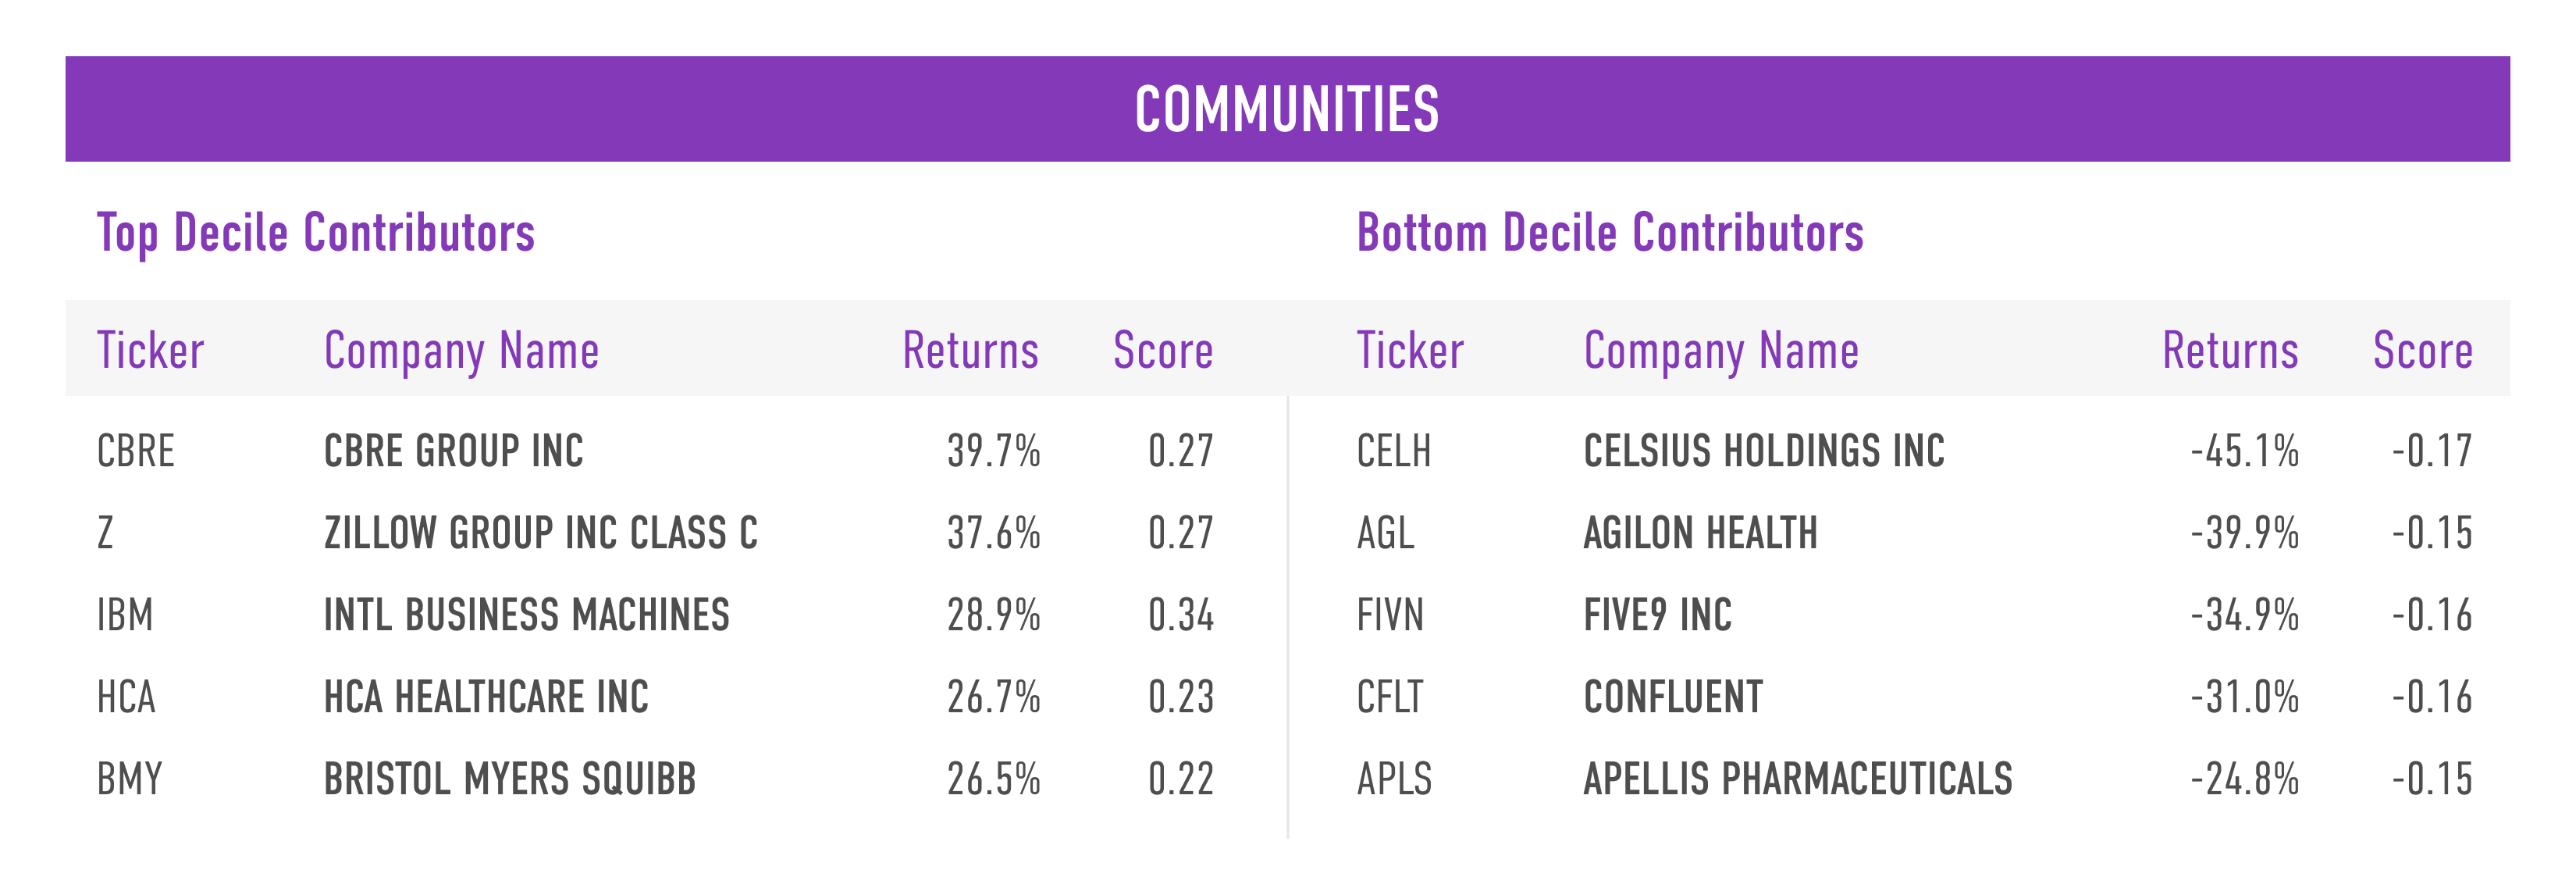
Shown below are the top and bottom five contributors to the top decile (D1), the best-ranked companies as measured by their Communities score, and the bottom decile (D10), the lowest-ranked companies as measured by their Communities score.
Shareholders and Governance
The Shareholders and Governance stakeholder measures a company across three Issues:
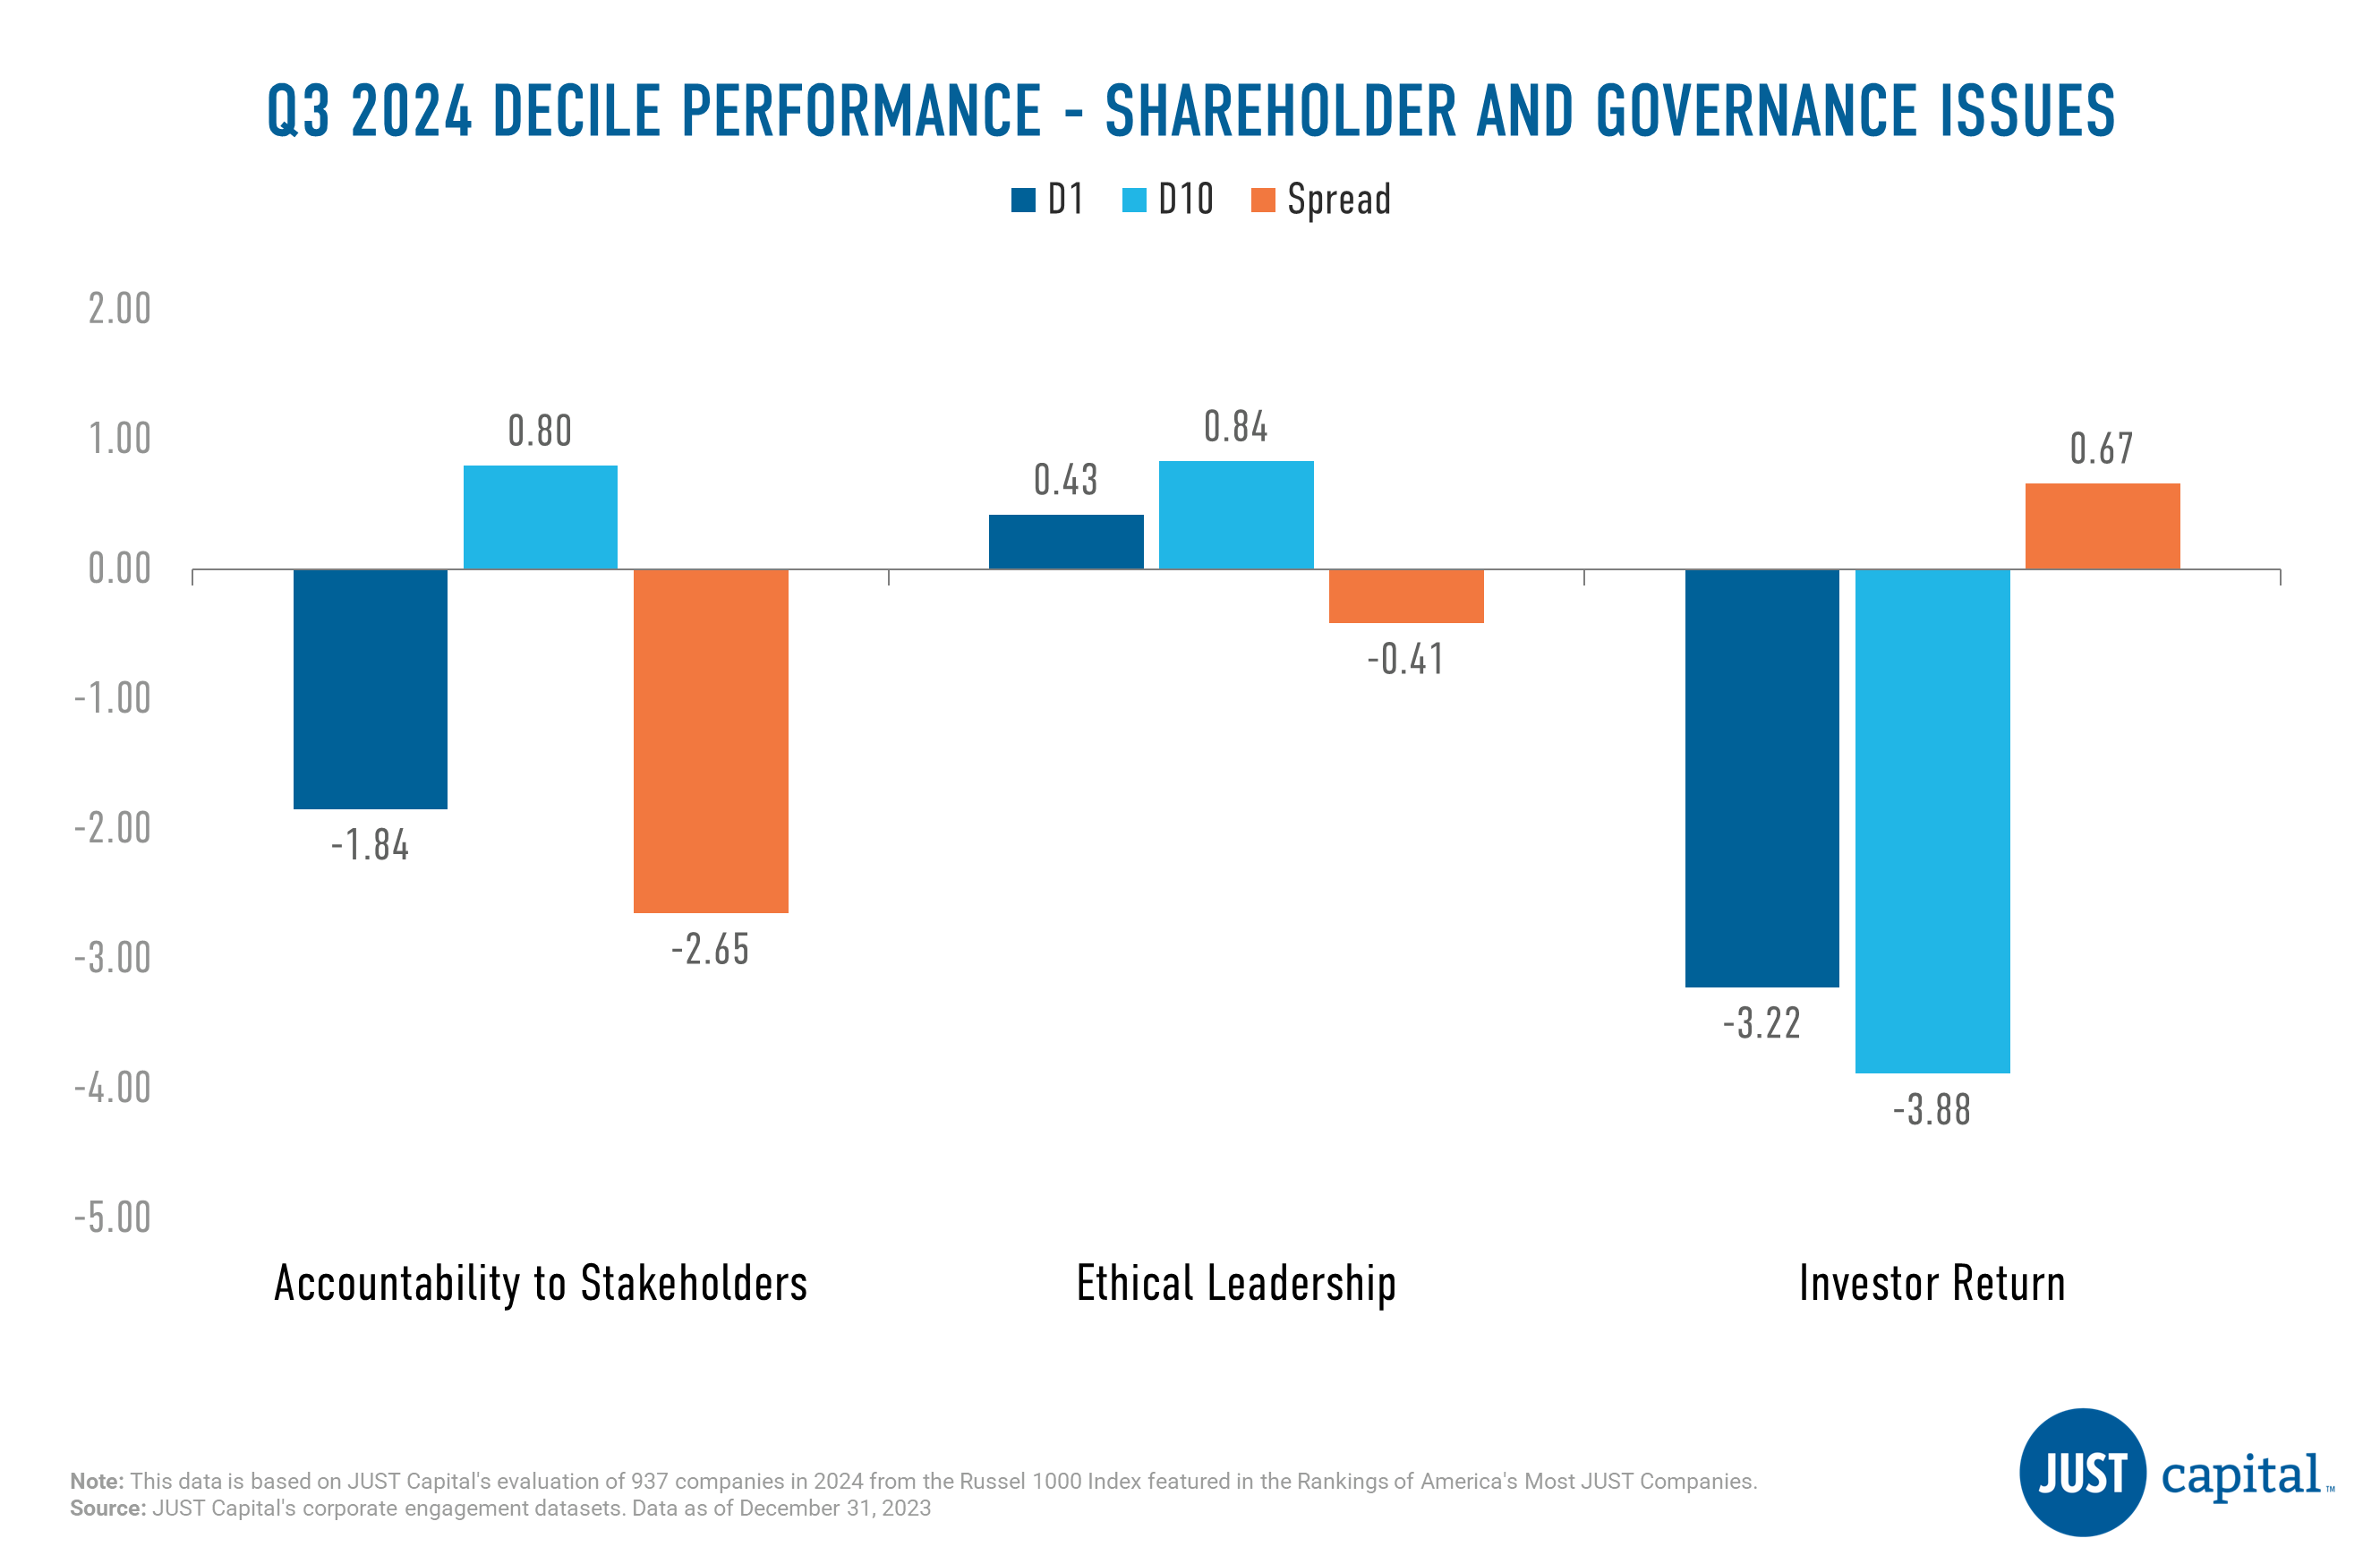
Investor Return Issue was the only positive performer in Q3 with a long-short spread of 0.67%. Remaining issues within the Shareholder stakeholder were negative this quarter.
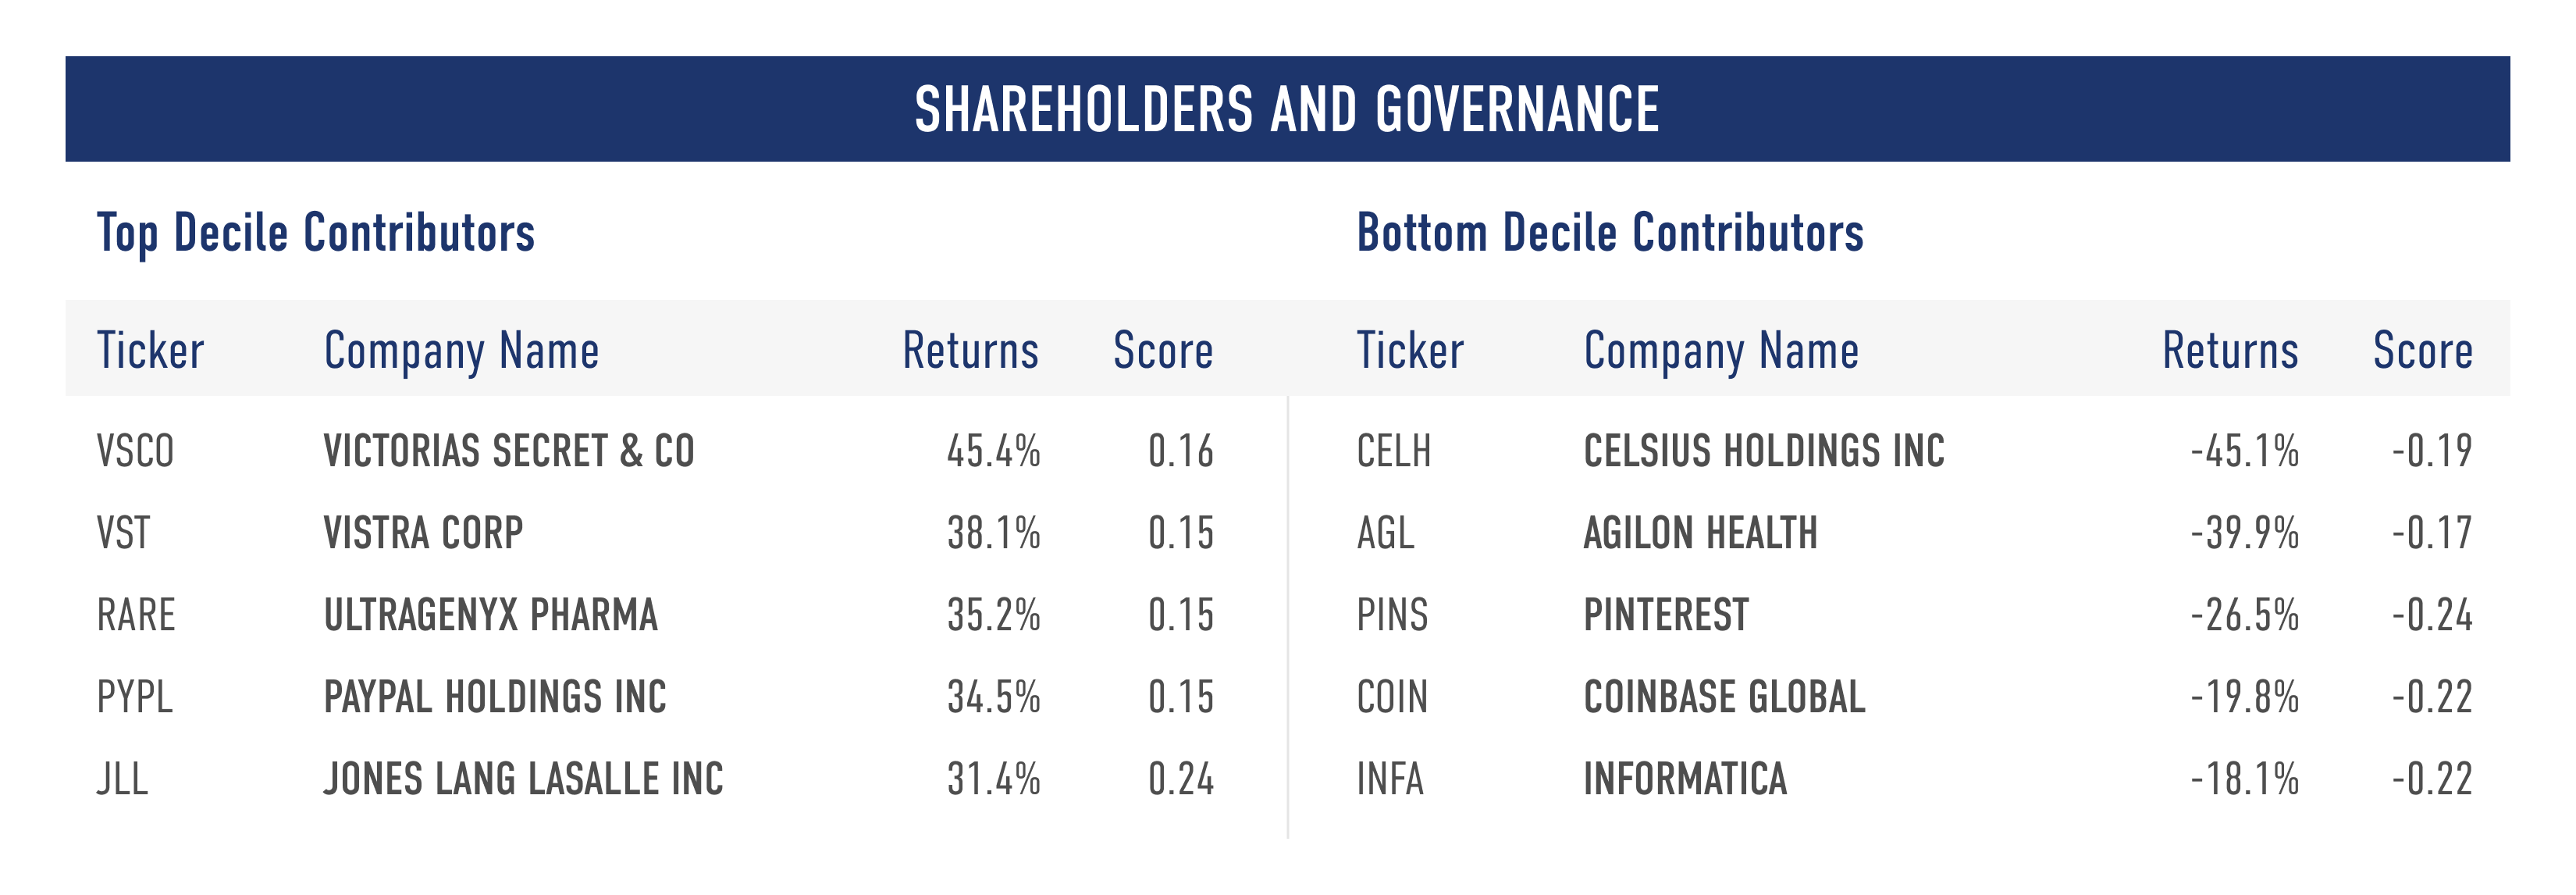
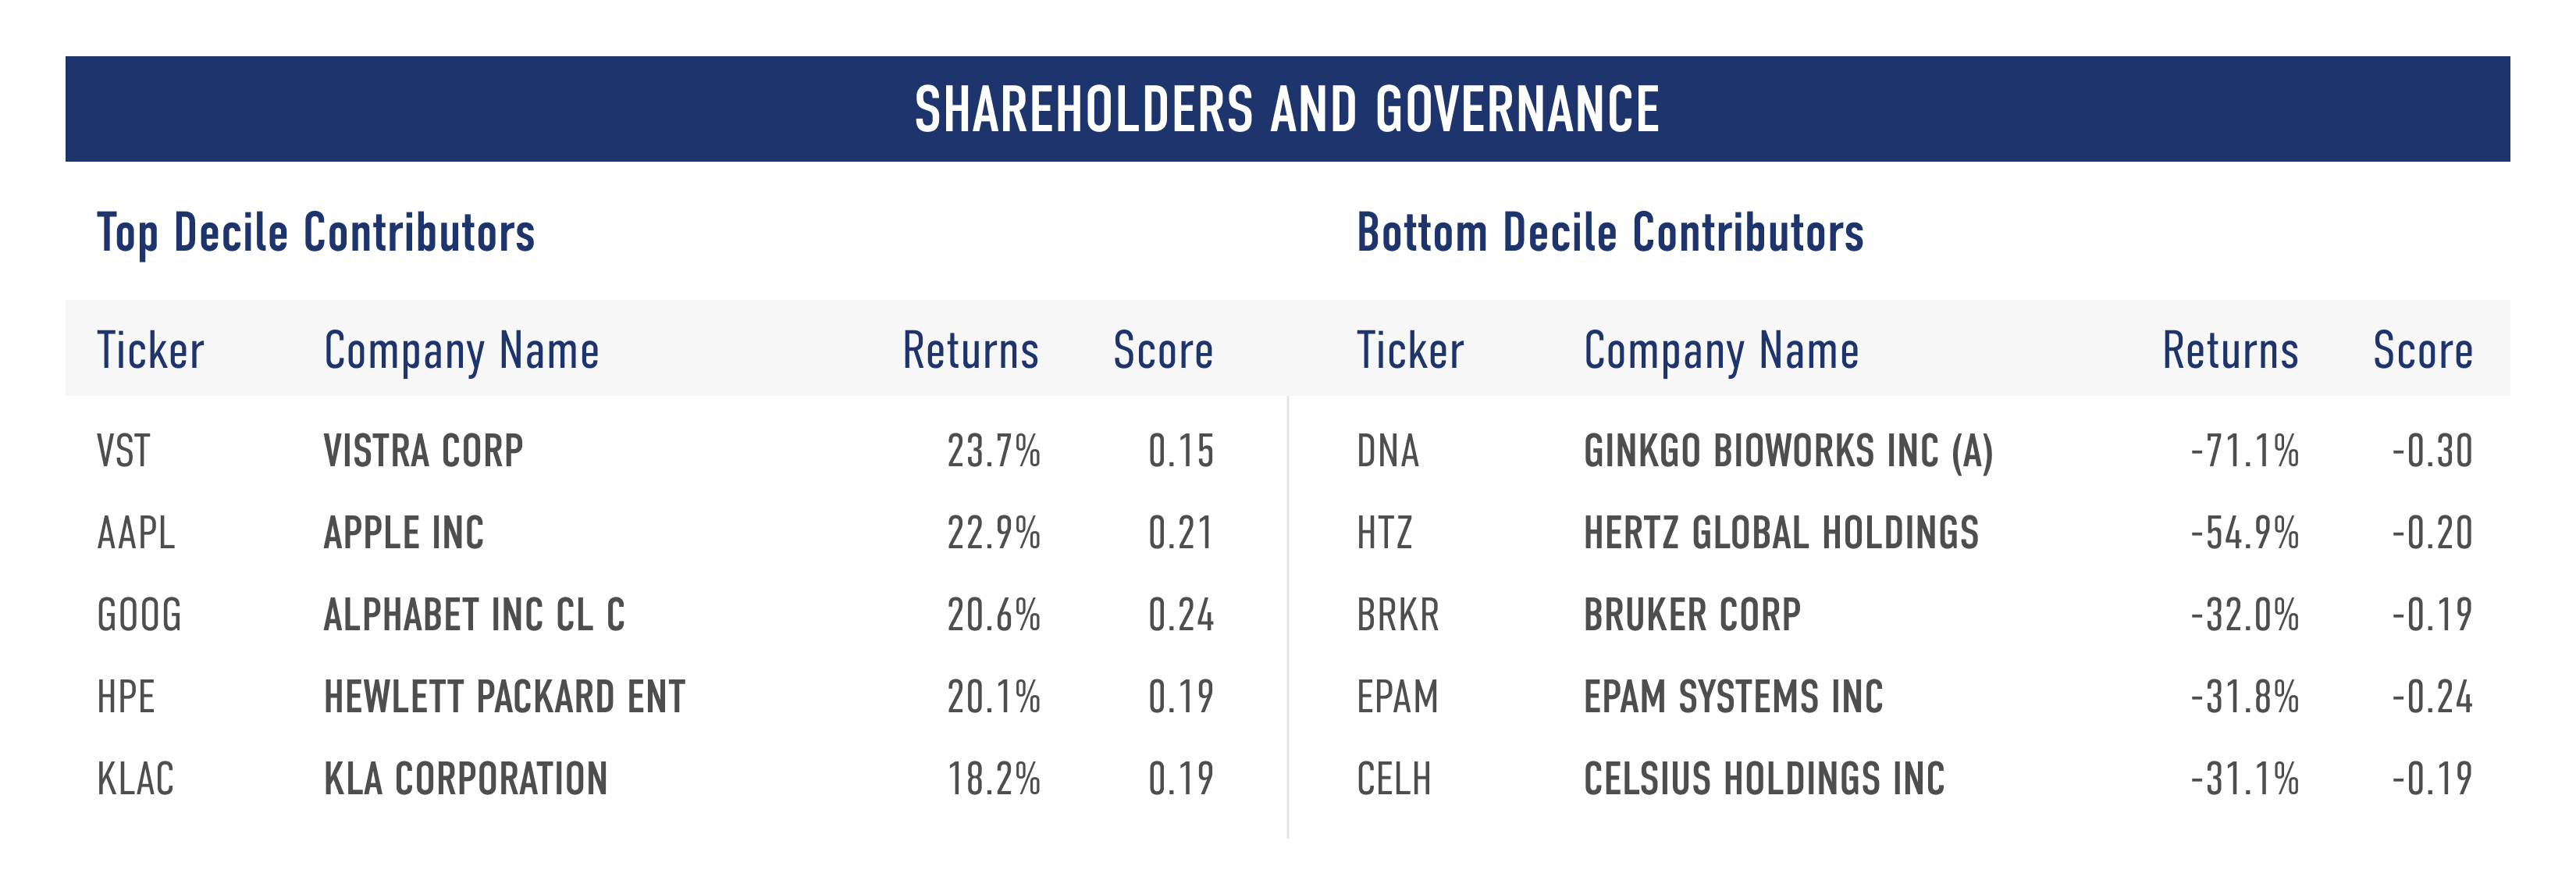
Shown below are the top and bottom five contributors to the top decile (D1), the best-ranked companies as measured by their Shareholders and Governance score, and the bottom decile (D10), the lowest-ranked companies as measured by their Shareholders and Governance score.
Customers
The Customers stakeholder measures a company across four Issues:

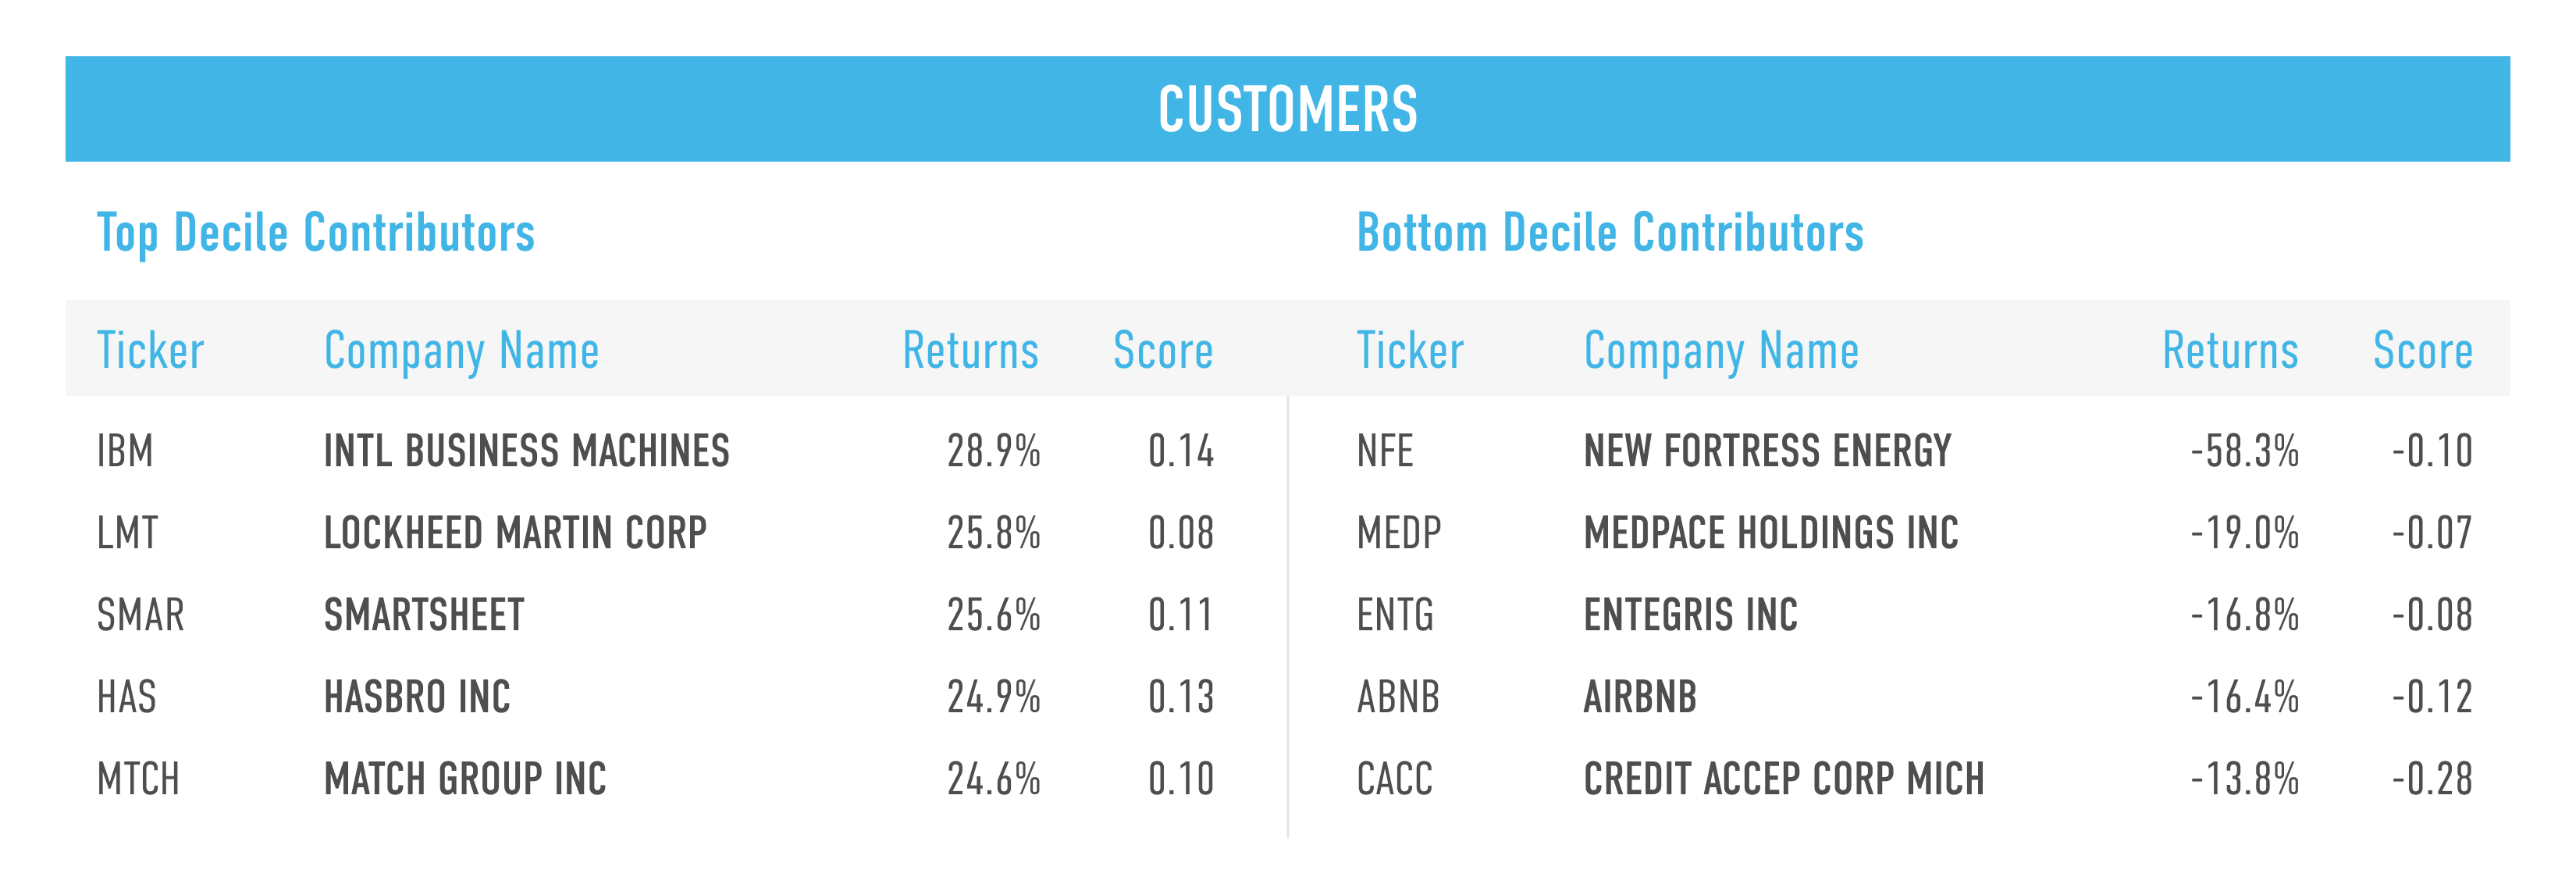
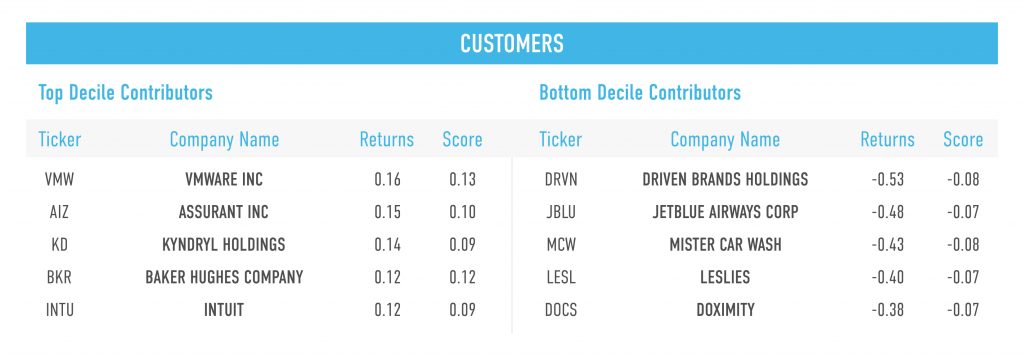
In Q3 2024, all four Customer Issues delivered negative performance. Customer Treatment was the weakest performer followed by Beneficial Products.
Shown below are the top and bottom five contributors to the top decile (D1), the best-ranked companies as measured by their Customers score, and the bottom decile (D10), the lowest-ranked names as measured by their Customers score.
Environment
The Environment stakeholder measures a company across four Issues:
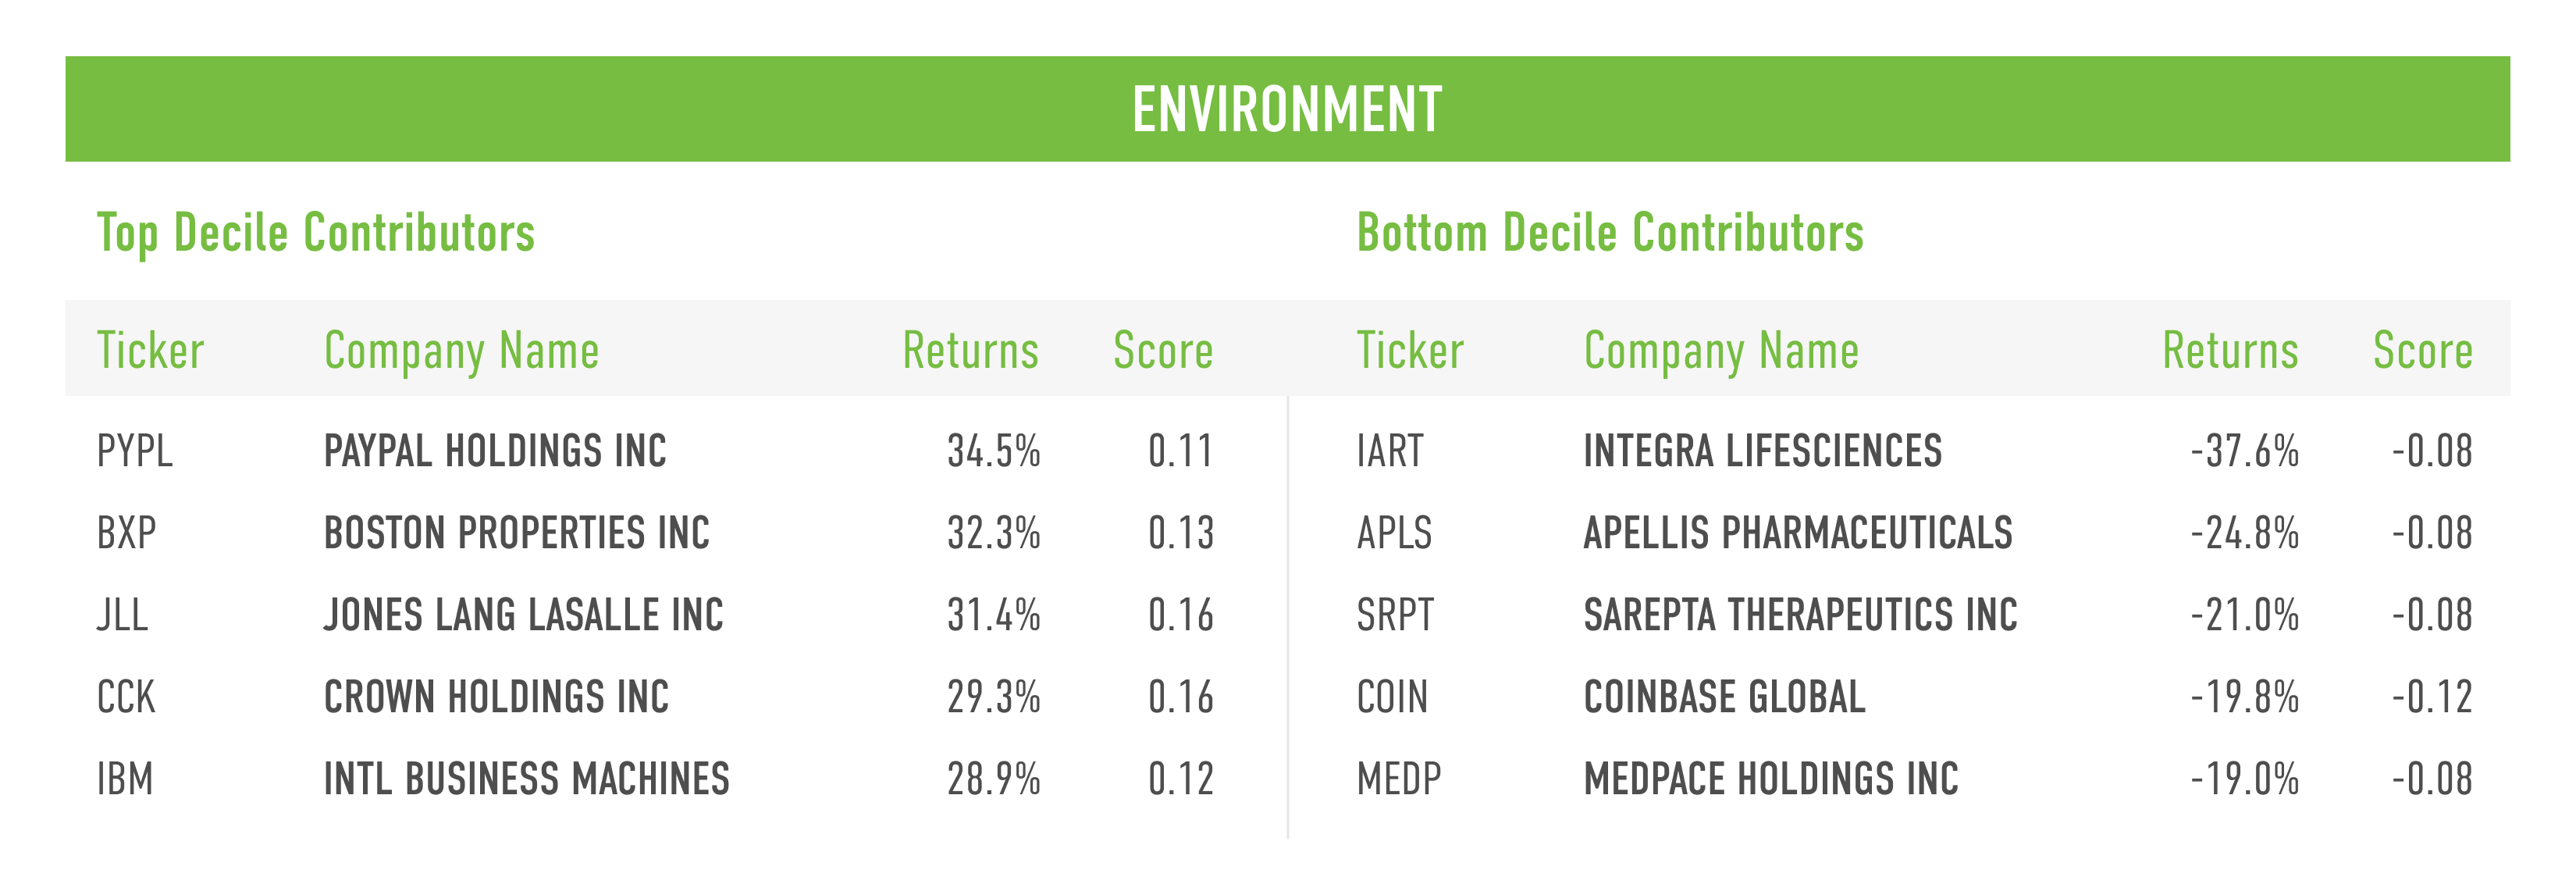
In Q3 2024, we saw all four Environmental issues deliver negative performance. Sustainable Materials was the worst performing issue within Environment stakeholder this quarter.
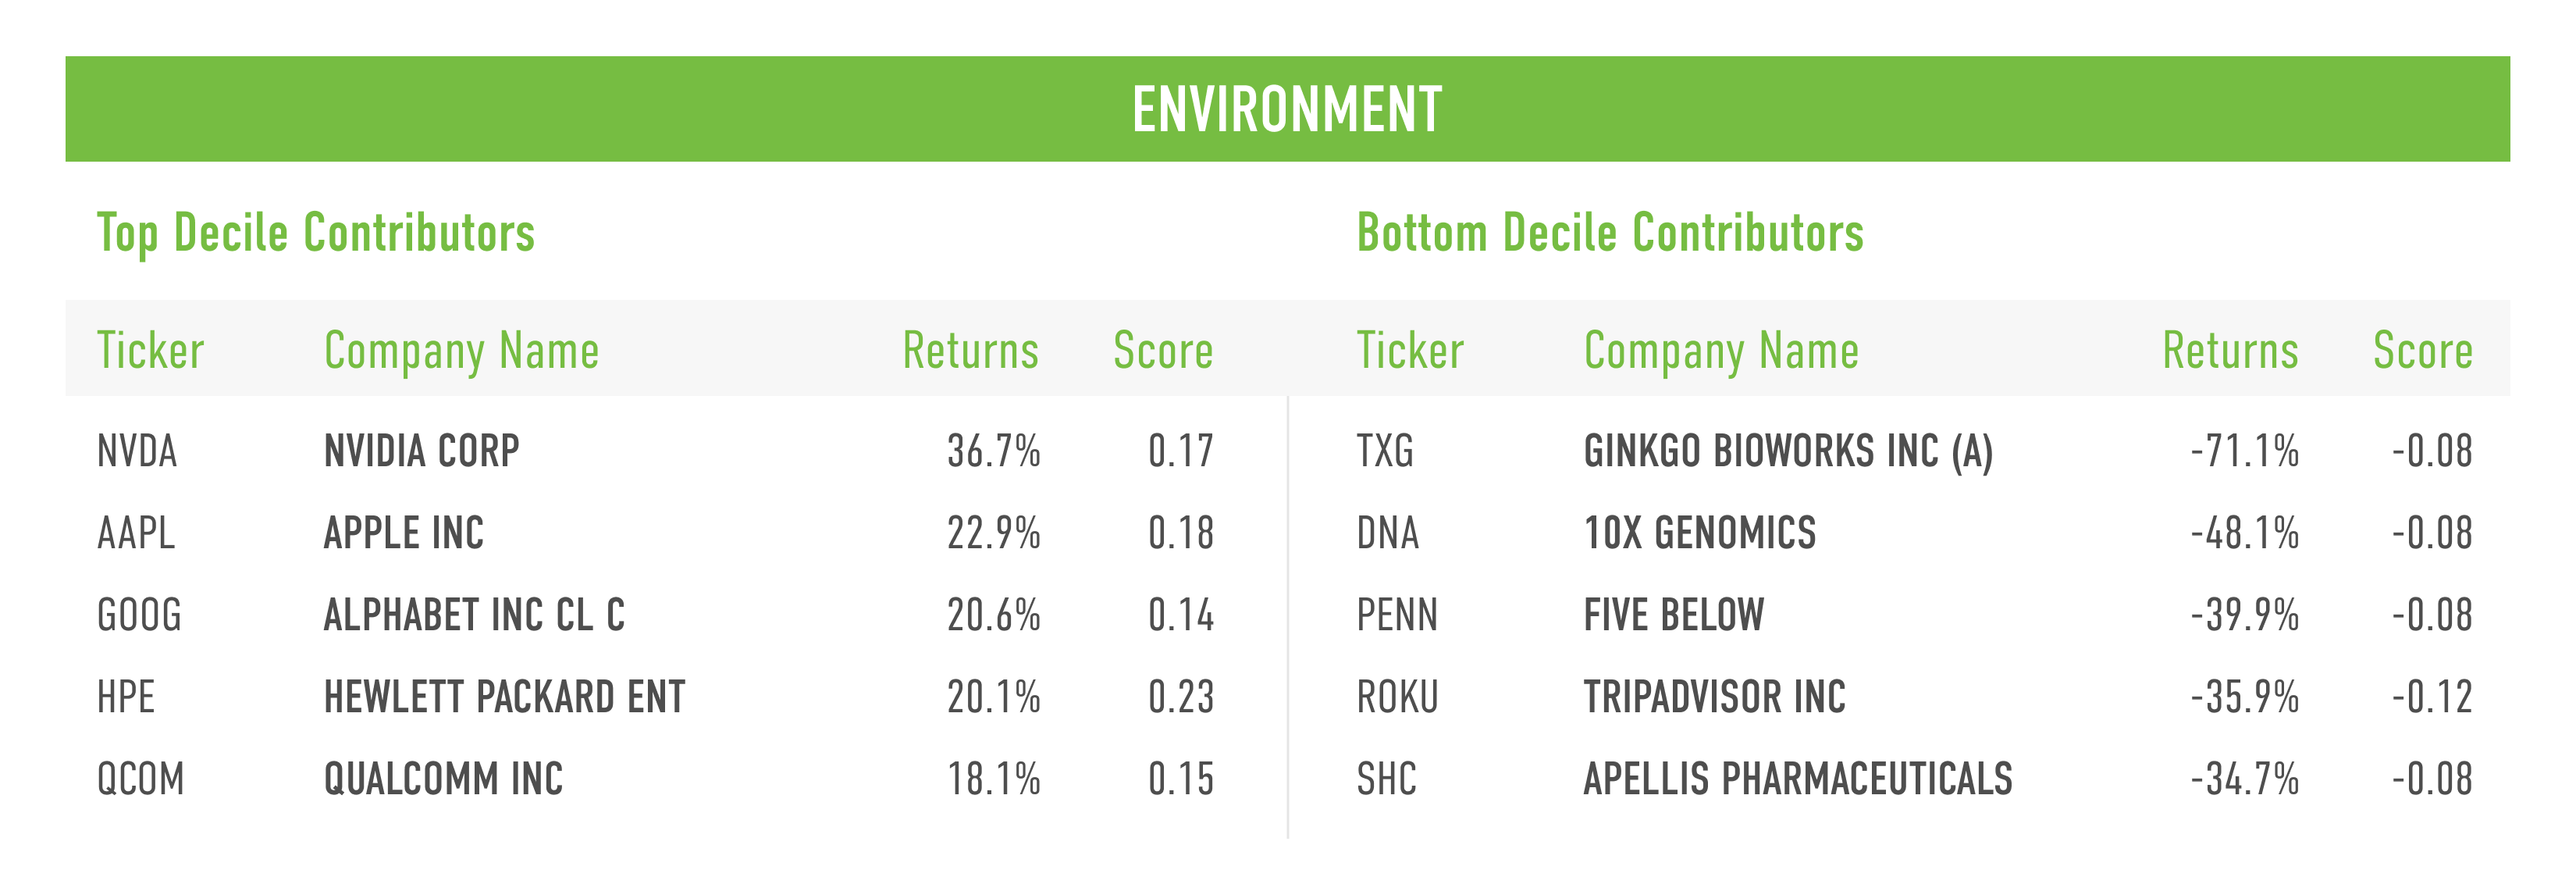
Shown below are the top and bottom five contributors to the top decile (D1), the best-ranked companies as measured by their Environment score, and the bottom decile (D10), the lowest-ranked companies as measured by their Environment score.
Computation Methodology
We monitor the performance of these stakeholders and Issues on a long-short basis. The long and short portfolios are selected based on the factor scores as the top and bottom deciles within the universe of companies we track in the Russell 1000. Top decile (D1) companies are those that rank highest based on the factor score, and bottom decile (D10) companies are those that rank lowest based on the factor score.
D1 Performance is computed as
(Equally weighted average of returns of stocks in D1 bucket) – (Equally weighted average of returns of all stocks within the Universe)
D10 Performance is computed as
(Equally weighted average of returns of stocks in D10 bucket) – (Equally weighted average of returns of all stocks within the Universe)
Spread is computed as
D1 Performance – D10 Performance
In the second quarter of 2024, global equity prices continued their robust performance, contributing to an impressive one-year rebound. The S&P 500 Index rose by 4.3% during this period, though many segments of the domestic stock market, including mid and small-cap indices, lagged behind and declined. Among large-cap stocks, the average stock fell by 2.6%, as indicated by the equal-weighted version of the S&P 500. The quarter experienced fluctuations, with April seeing a downturn that reversed some Q1 gains, but a rebound in May led the S&P 500 to set multiple new all-time highs. The quarter concluded with strong stock market gains, fueled by robust company earnings and easing inflation, elevating the S&P 500’s year-to-date performance to 15.3%.
The strong performance of the S&P 500 was primarily driven by the Information Technology and Communication Services sectors, with ongoing enthusiasm around AI boosting related companies amid strong earnings and optimistic outlook statements. The Information Technology sector alone accounted for 95% of the Index’s gain, with NVIDIA leading the charge and contributing nearly half of the S&P 500’s return. Conversely, cyclical sectors such as Financials, Industrials, Health Care, and Materials were the biggest underperformers.
As of June 30, 2024, our flagship index – the JUST U.S. Large Cap Diversified Index (JULCD) has out-performed the Russell 1000 (Cap-Weighted) benchmark by 1.51% year-to-date and by 13.78% since its inception. Additionally, the JUST 100 (equally weighted index) has outperformed the Russell 1000 (Equally-Weighted) index by 6.65% year-to-date and by 44.77% since its inception.
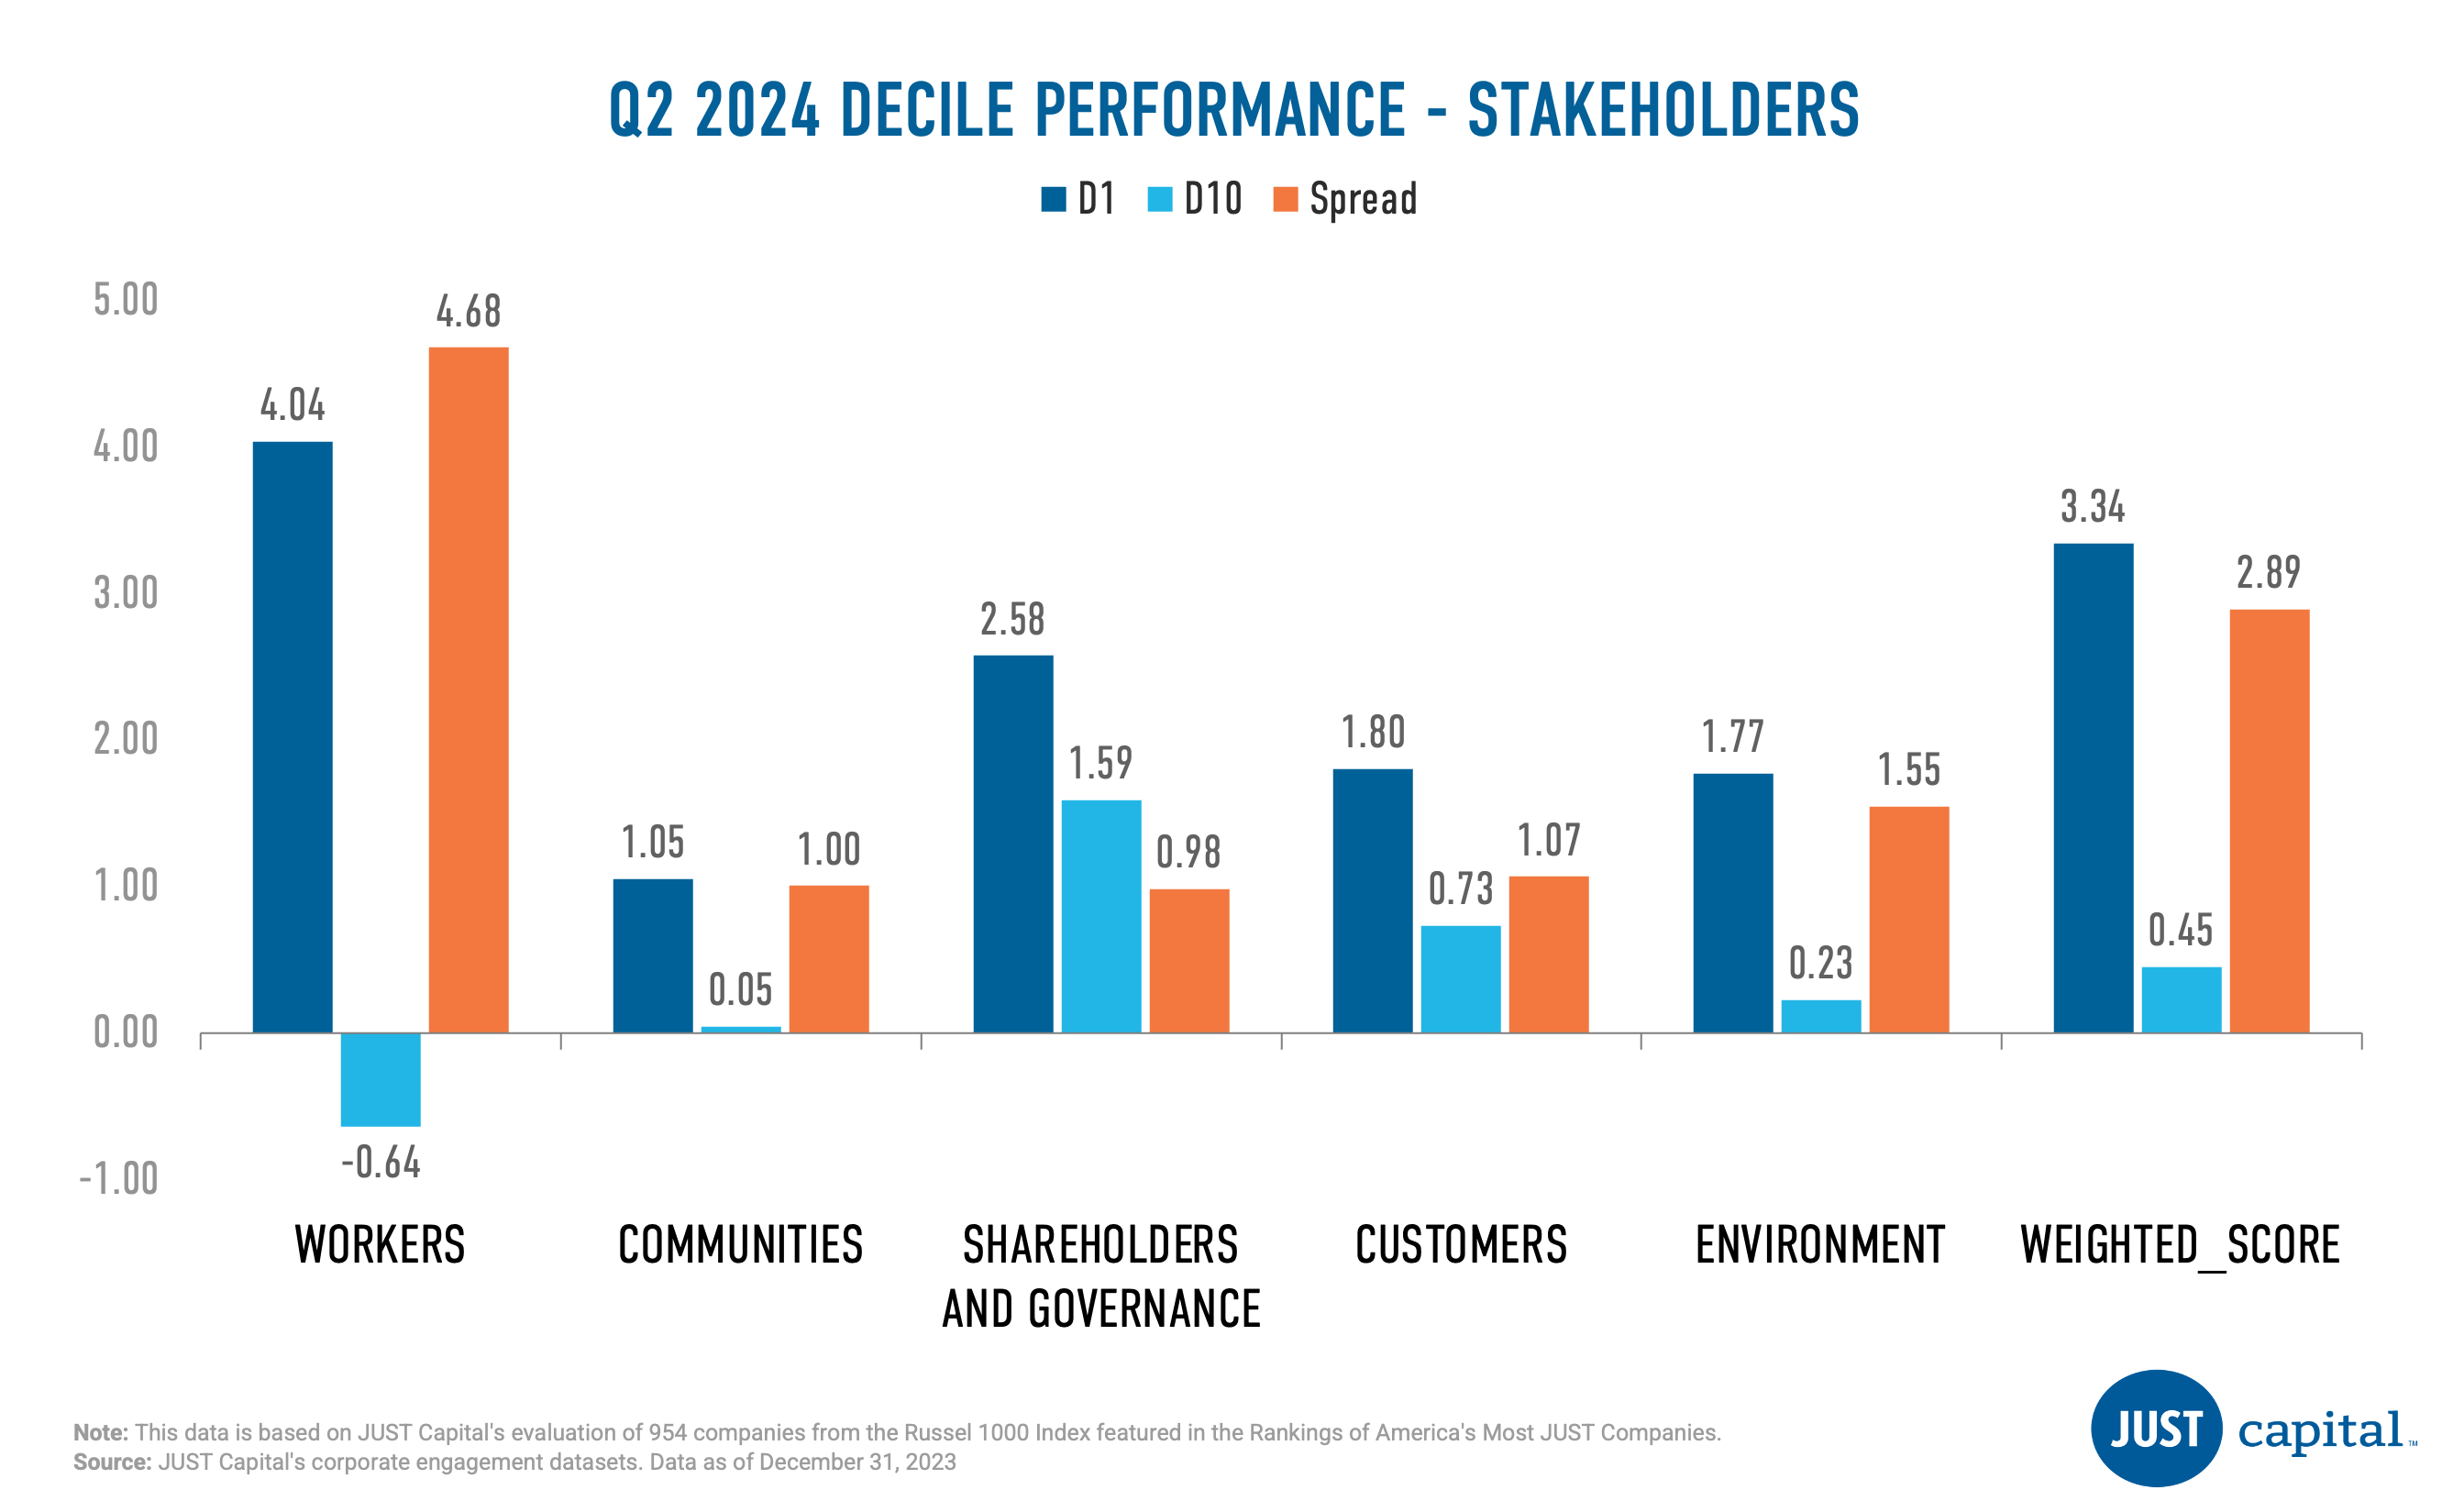
JUST Capital found that all of the five stakeholders we track delivered positive performance in Q2 2024. The Workers stakeholder delivered the strongest performance over this period with a long-short spread of 4.68%. Within the Workers stakeholder, outperformance was driven by both the top and bottom deciles whereas for remaining stakeholders outperformance was driven by top decile.
JUST Capital’s Overall Weighted Score takes into account the 20 core Issues determined through our annual survey research – including paying a living wage, creating a diverse, inclusive workplace, and helping combat climate change – across key business stakeholders: Workers, Communities, Shareholders & Governance, Customers, and Environment. This Overall Weighted Score had a positive long-short spread of 2.89% over the period ending June 28,2024.
The Workers stakeholder measures a company across five Issues:
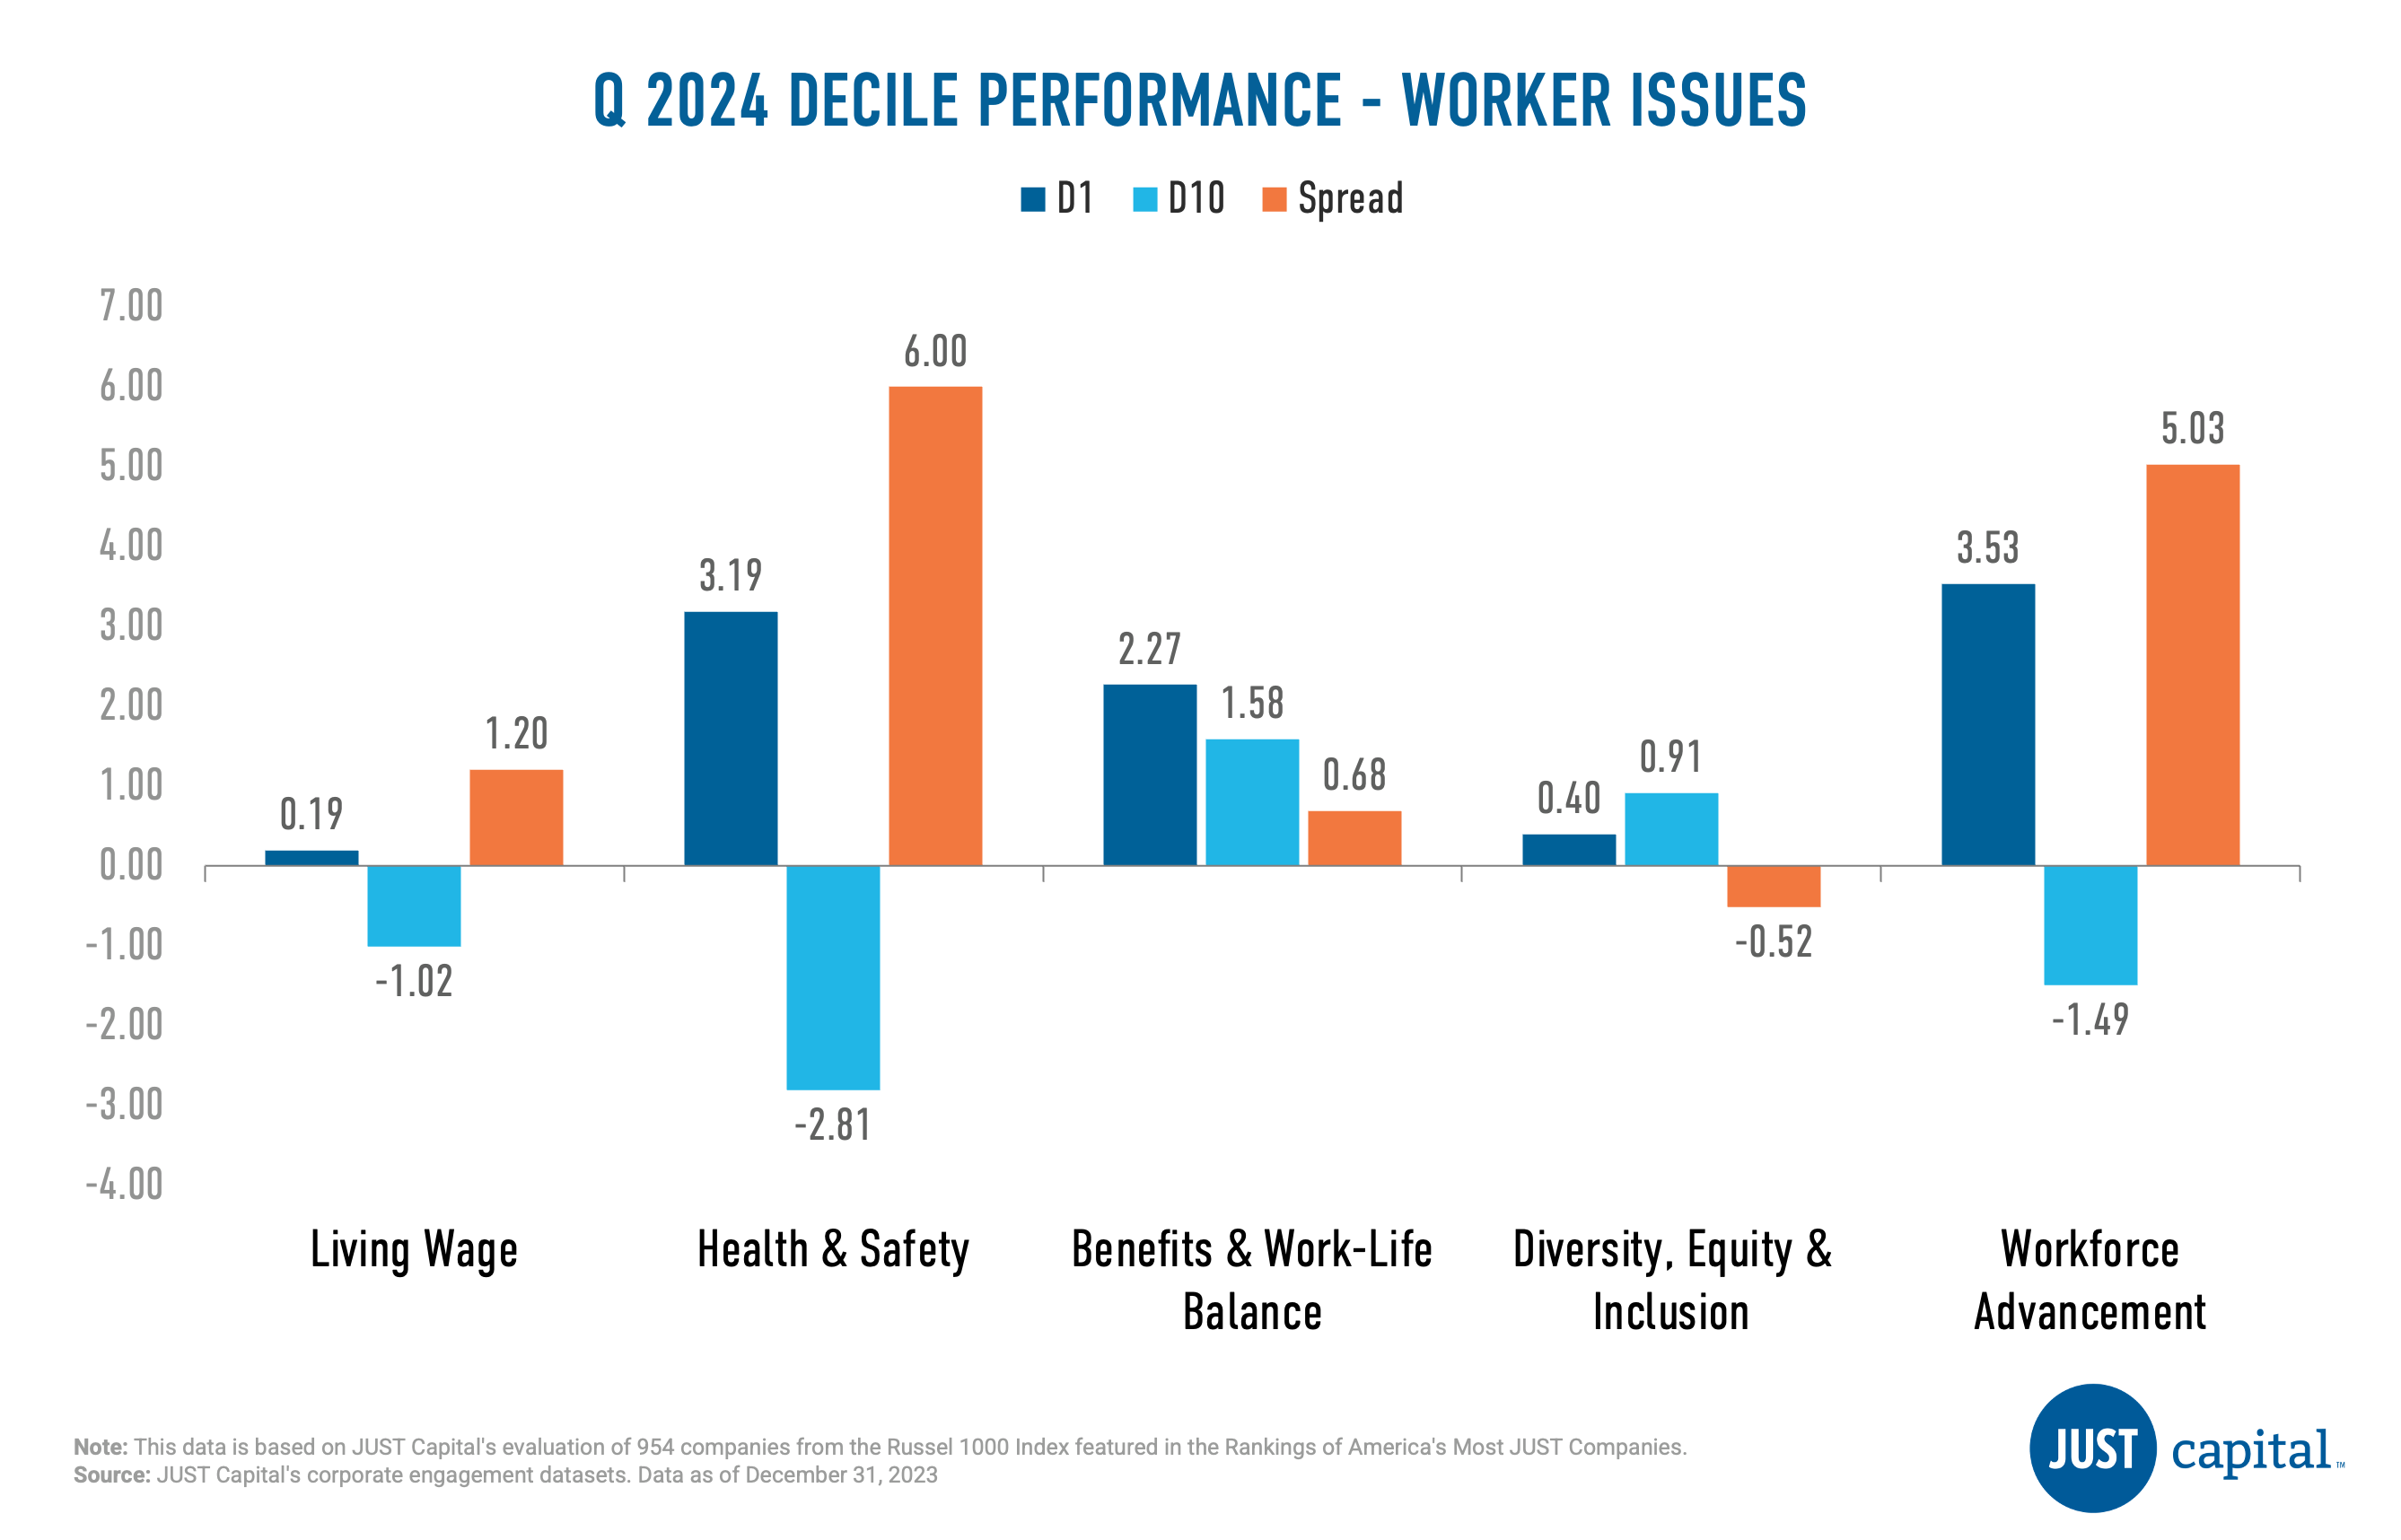
In Q2 2024, we saw four out of five issues deliver positive performance, with the Health & Safety Issue faring the best. Diversity Equity & Inclusion was the weakest performer amongst the Worker issues.
Shown below are the top and bottom five contributors to the top decile (D1), the top-ranked companies as measured by their Workers score, and the bottom decile (D10), the lowest-ranked companies as measured by their Workers score.

The Communities stakeholder measures a company across four Issues:
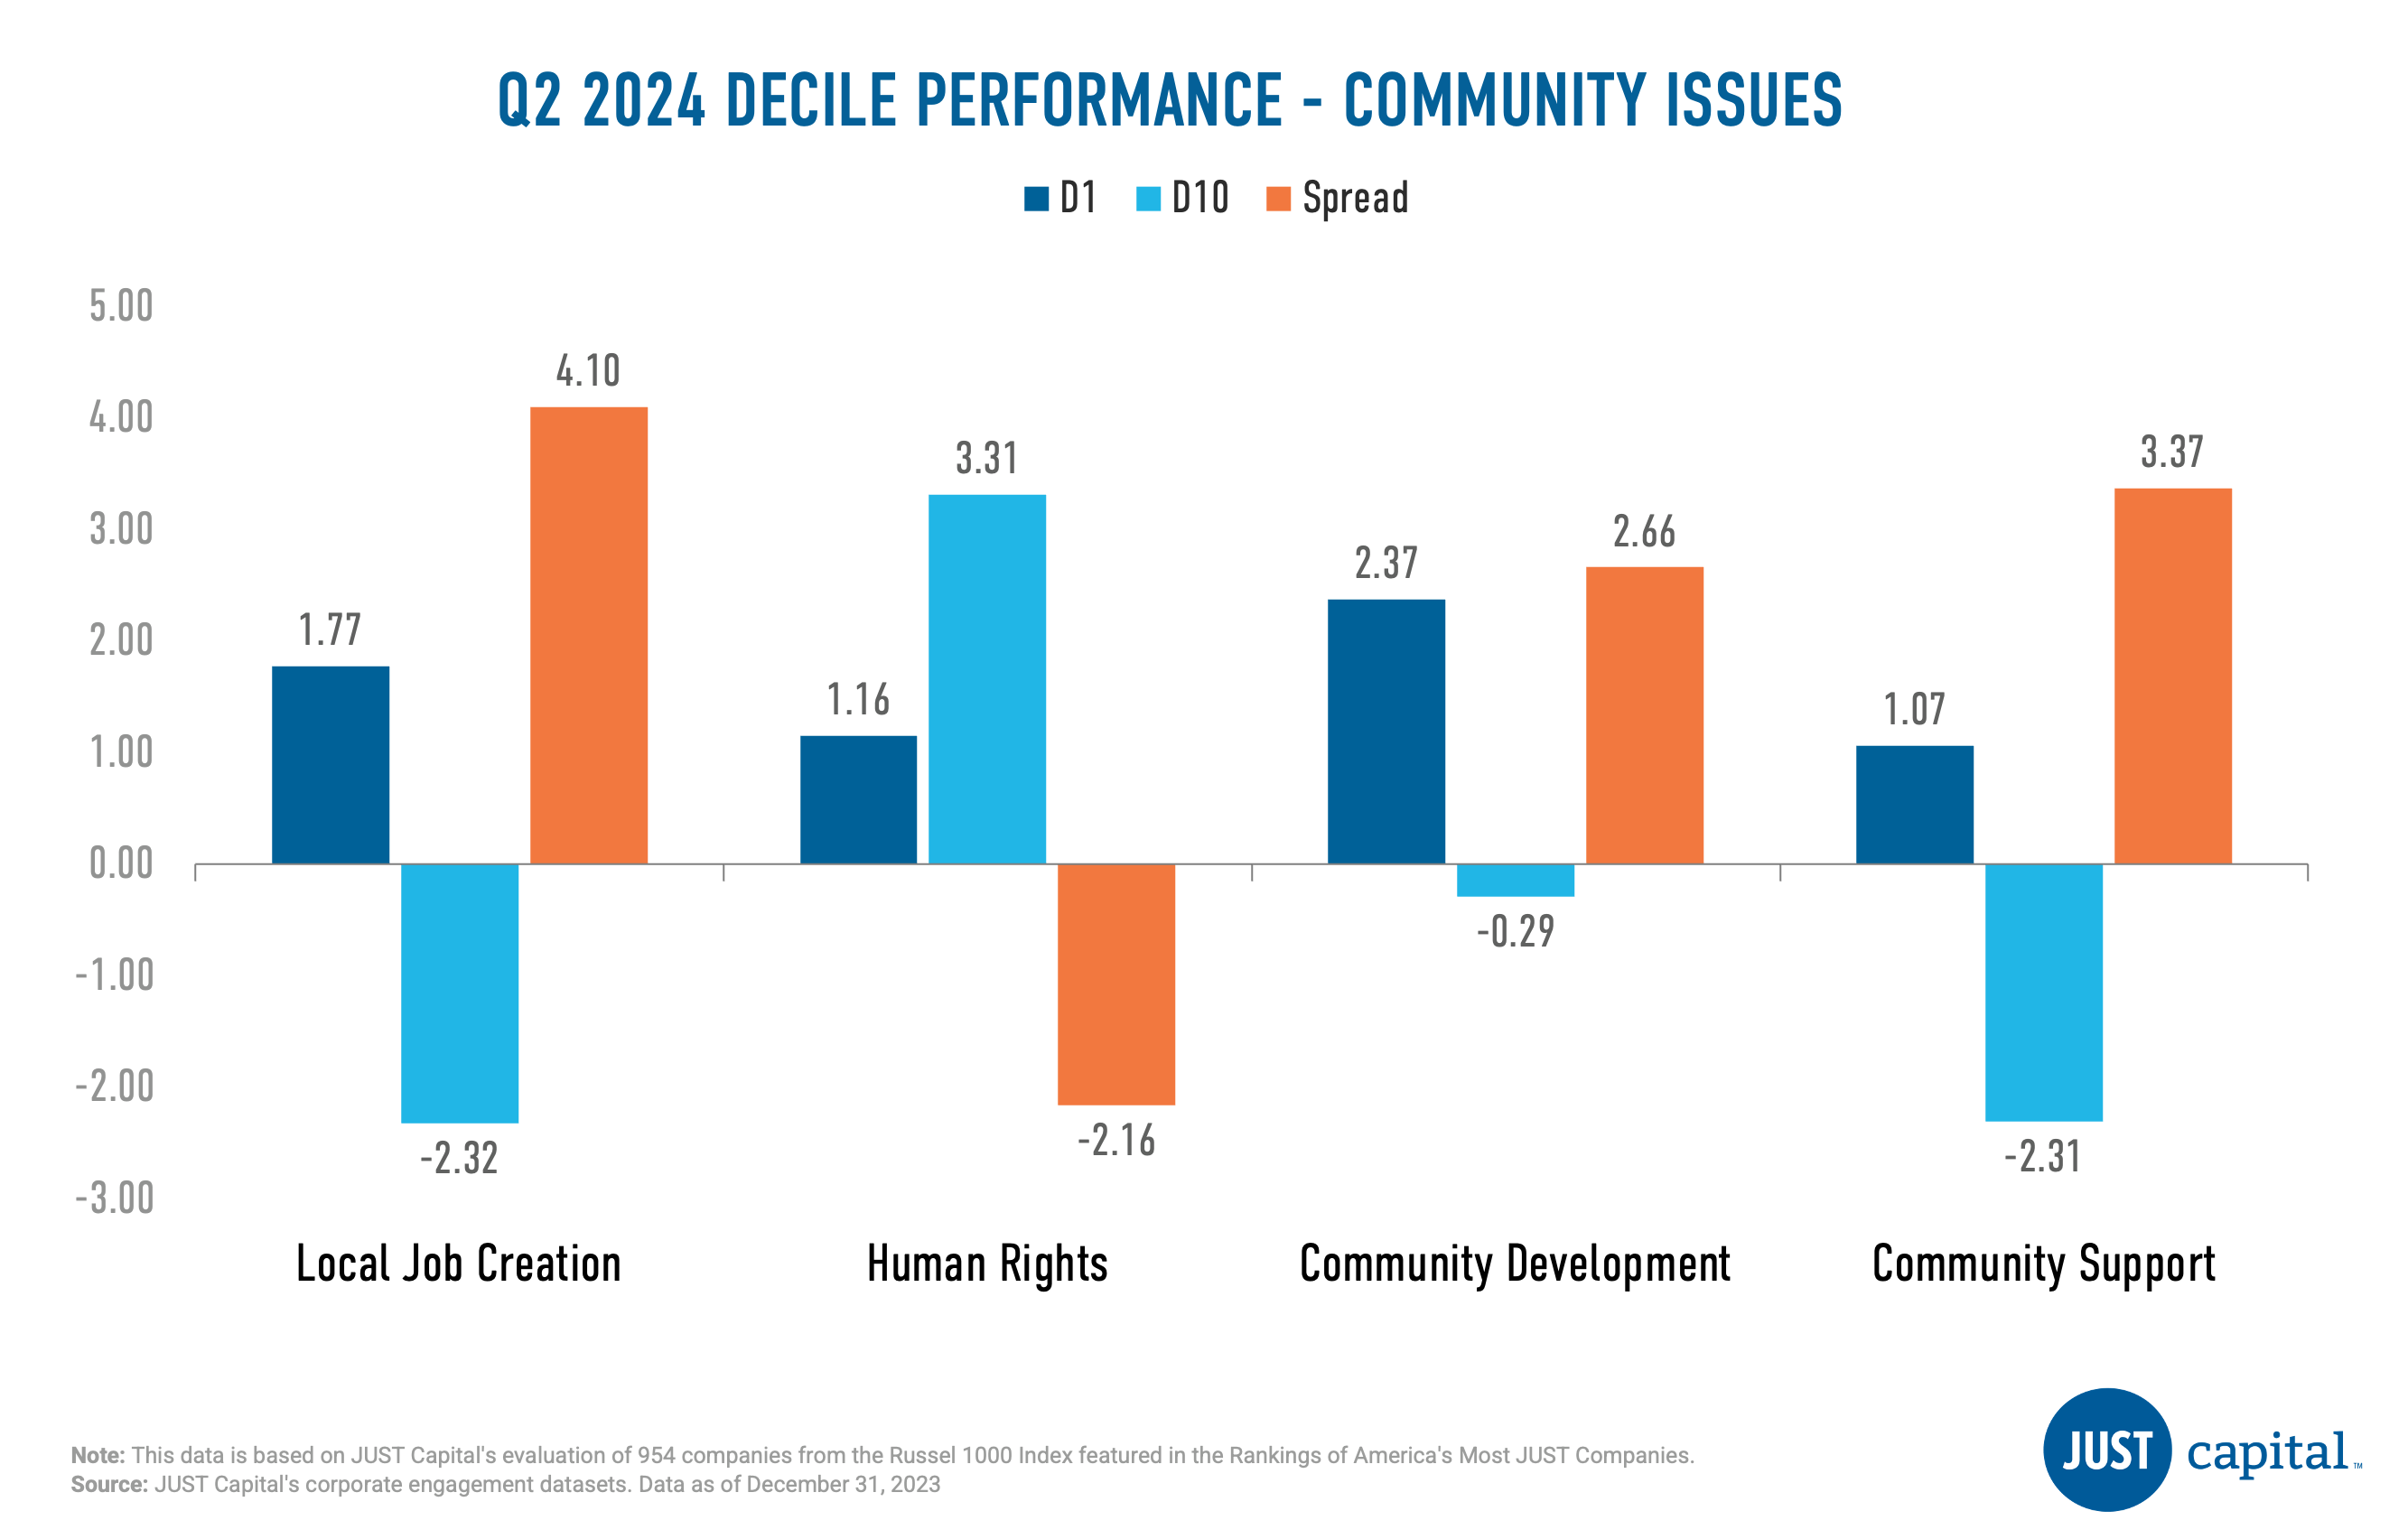
Local Job Creation was the strongest performer followed by Community Support. Human Rights was a negative contributor this quarter.
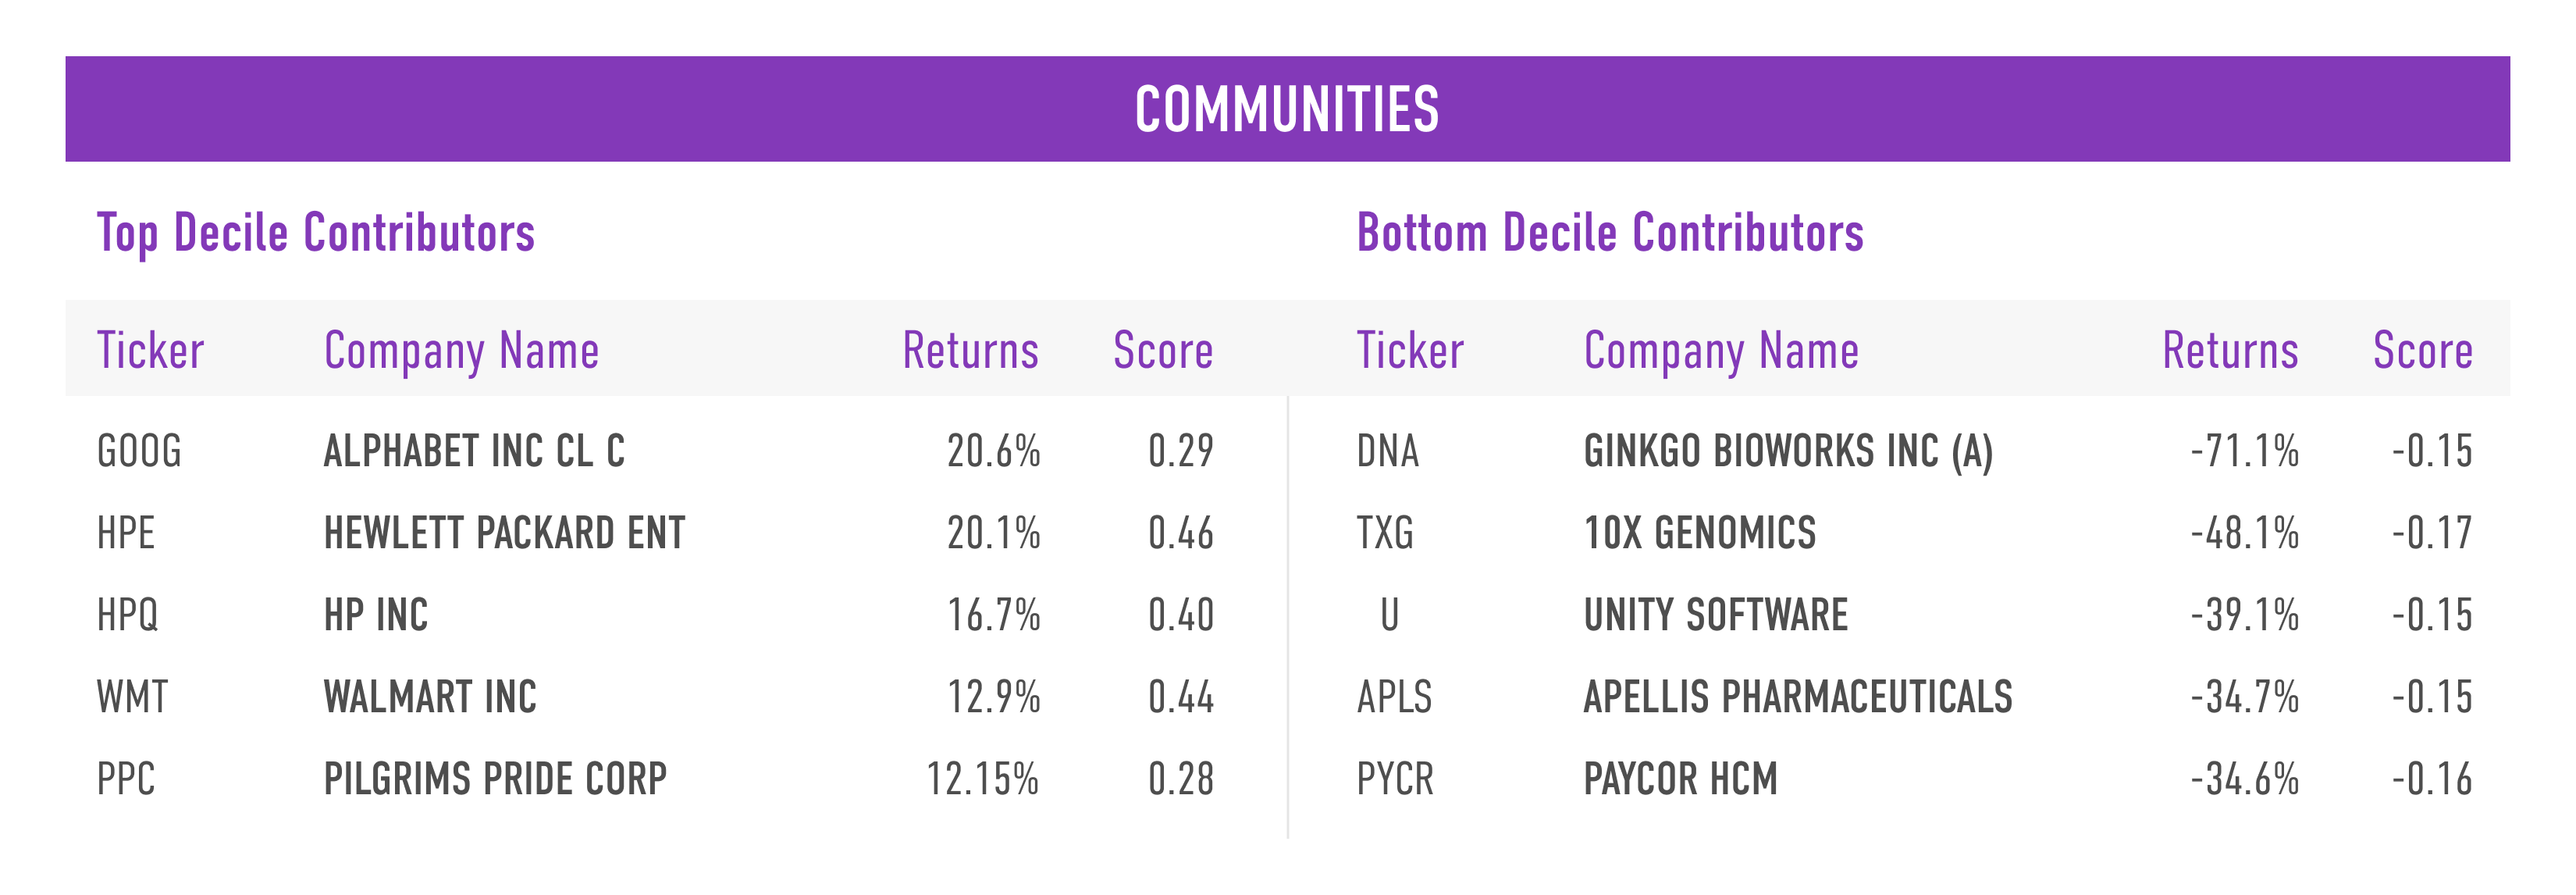
Shown below are the top and bottom five contributors to the top decile (D1), the best-ranked companies as measured by their Communities score, and the bottom decile (D10), the lowest-ranked companies as measured by their Communities score.
The Shareholders and Governance stakeholder measures a company across three Issues:
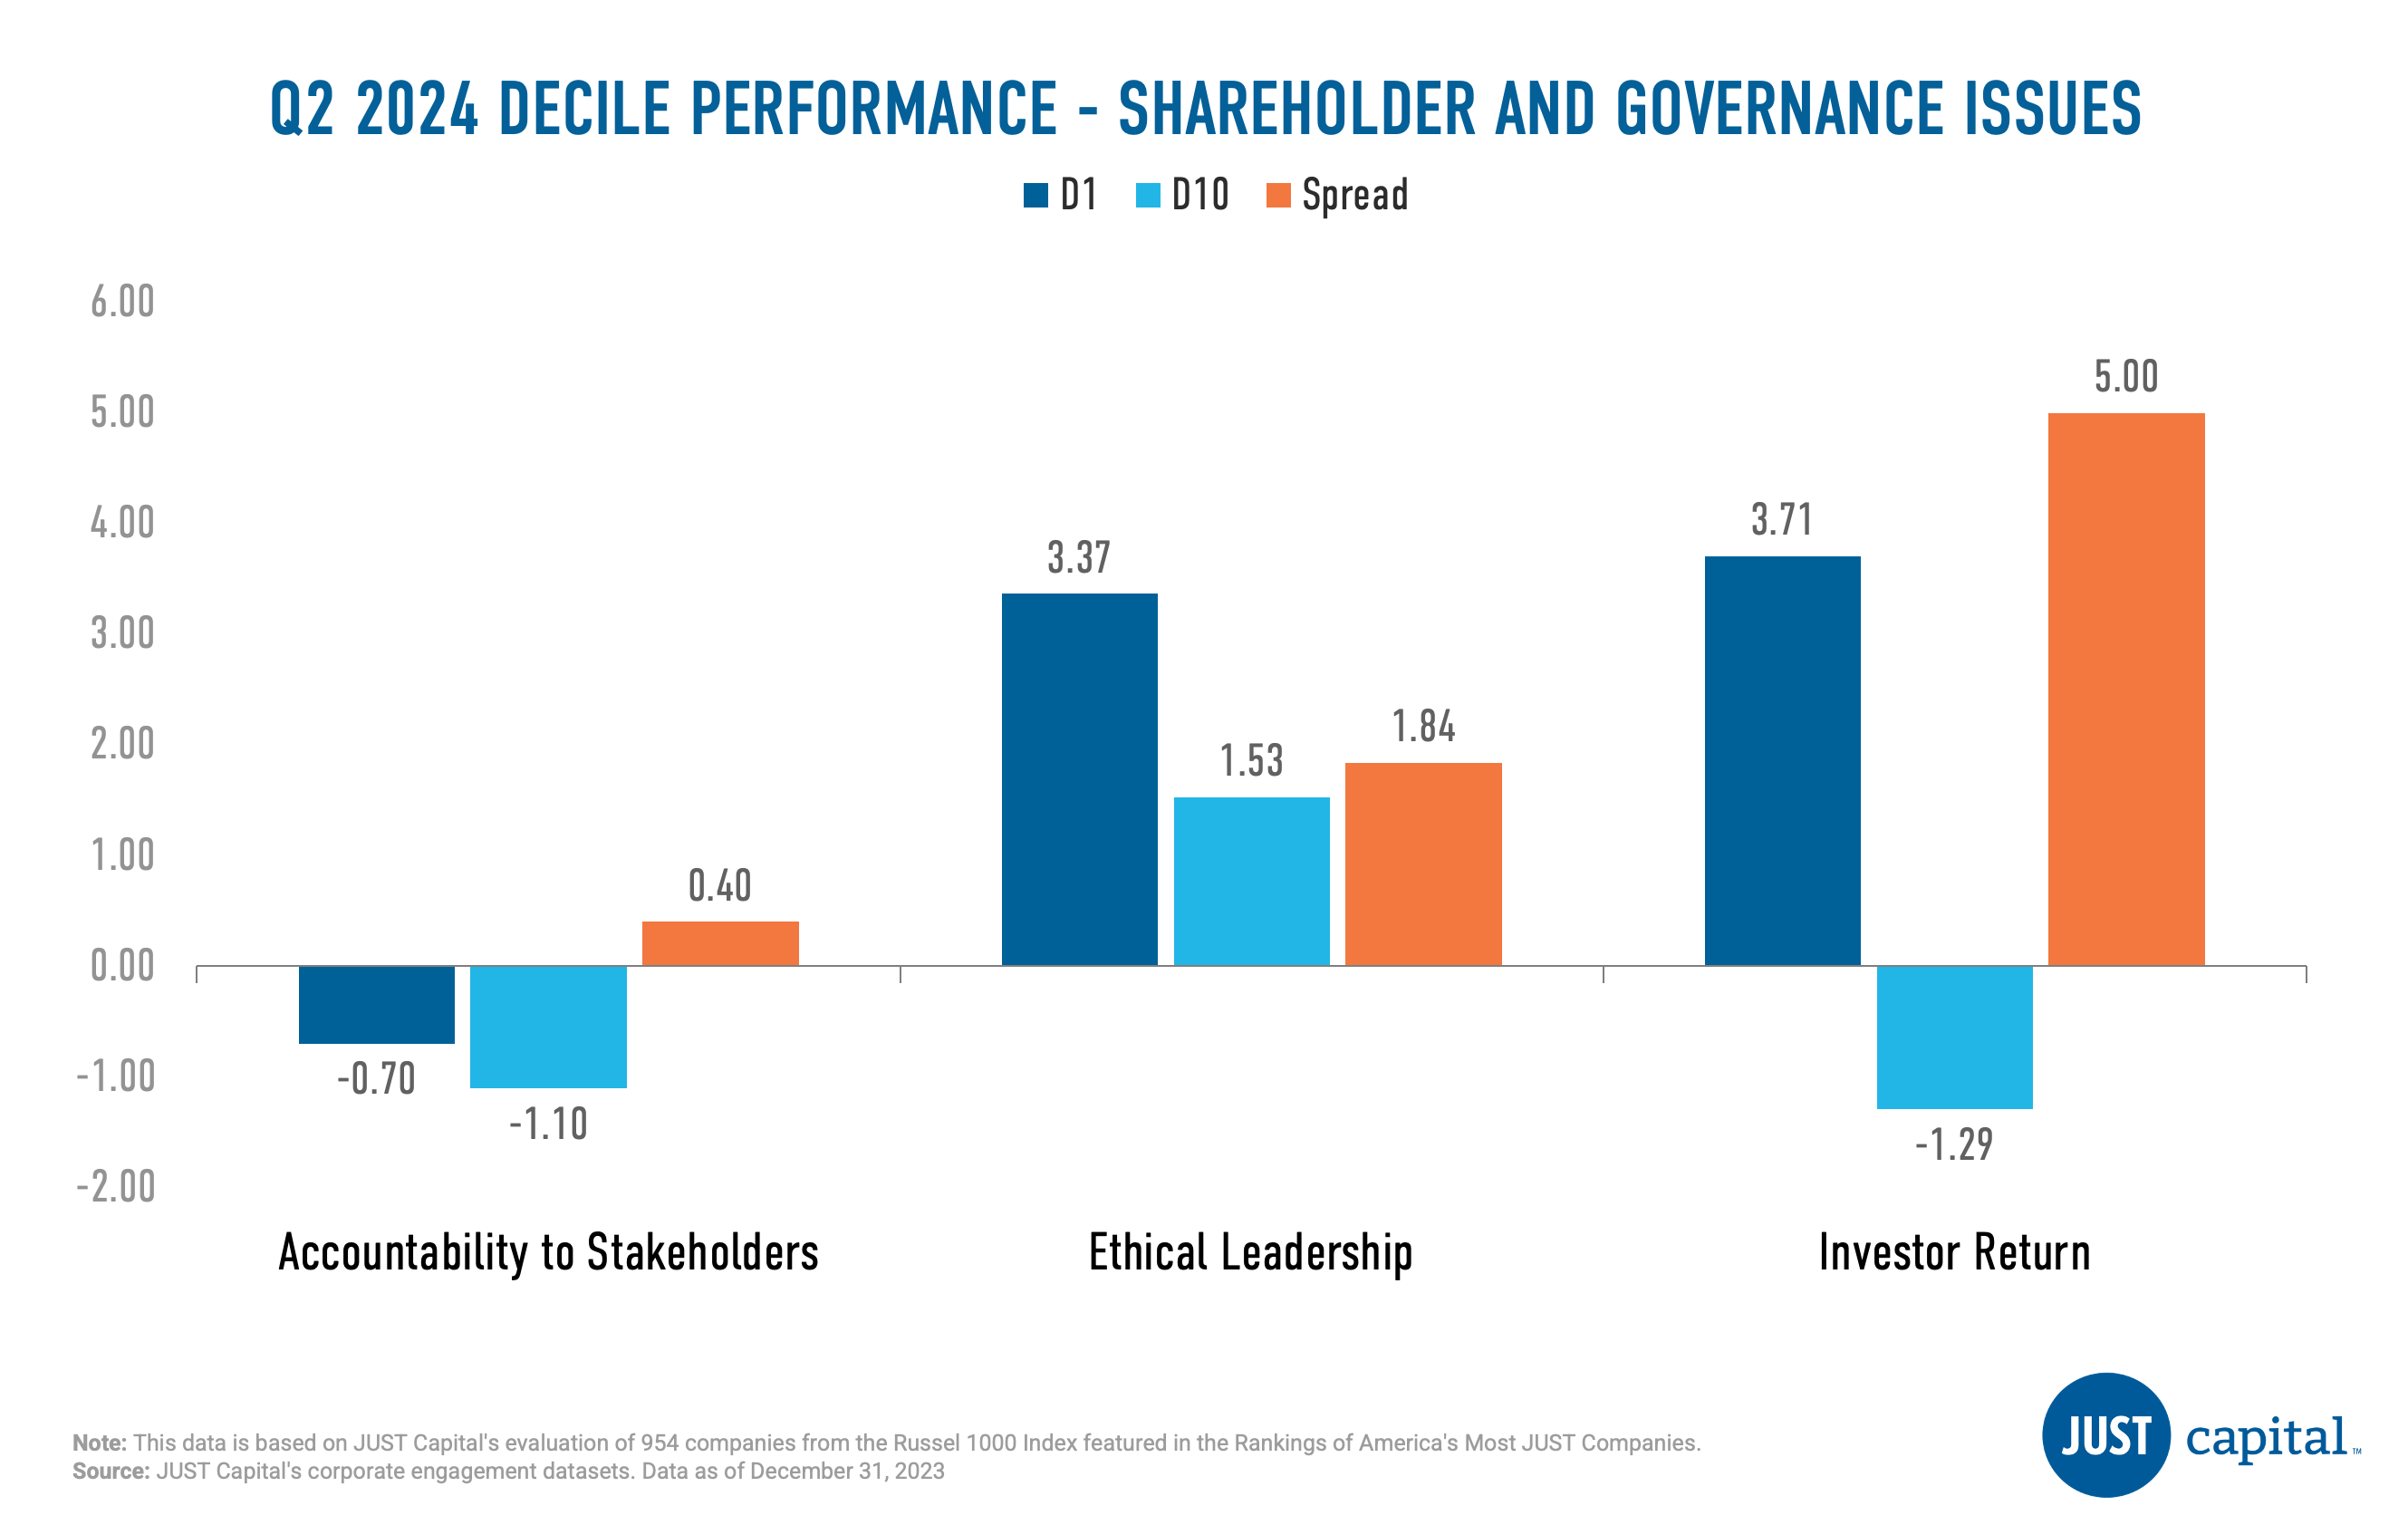
Investor Return Issue was the strongest performer in Q2 with a long-short spread of 5% followed by Ethical Leadership. All issues delivered positive performance in Q2 2024.
Shown below are the top and bottom five contributors to the top decile (D1), the best-ranked companies as measured by their Shareholders and Governance score, and the bottom decile (D10), the lowest-ranked companies as measured by their Shareholders and Governance score.
The Customers stakeholder measures a company across four Issues:
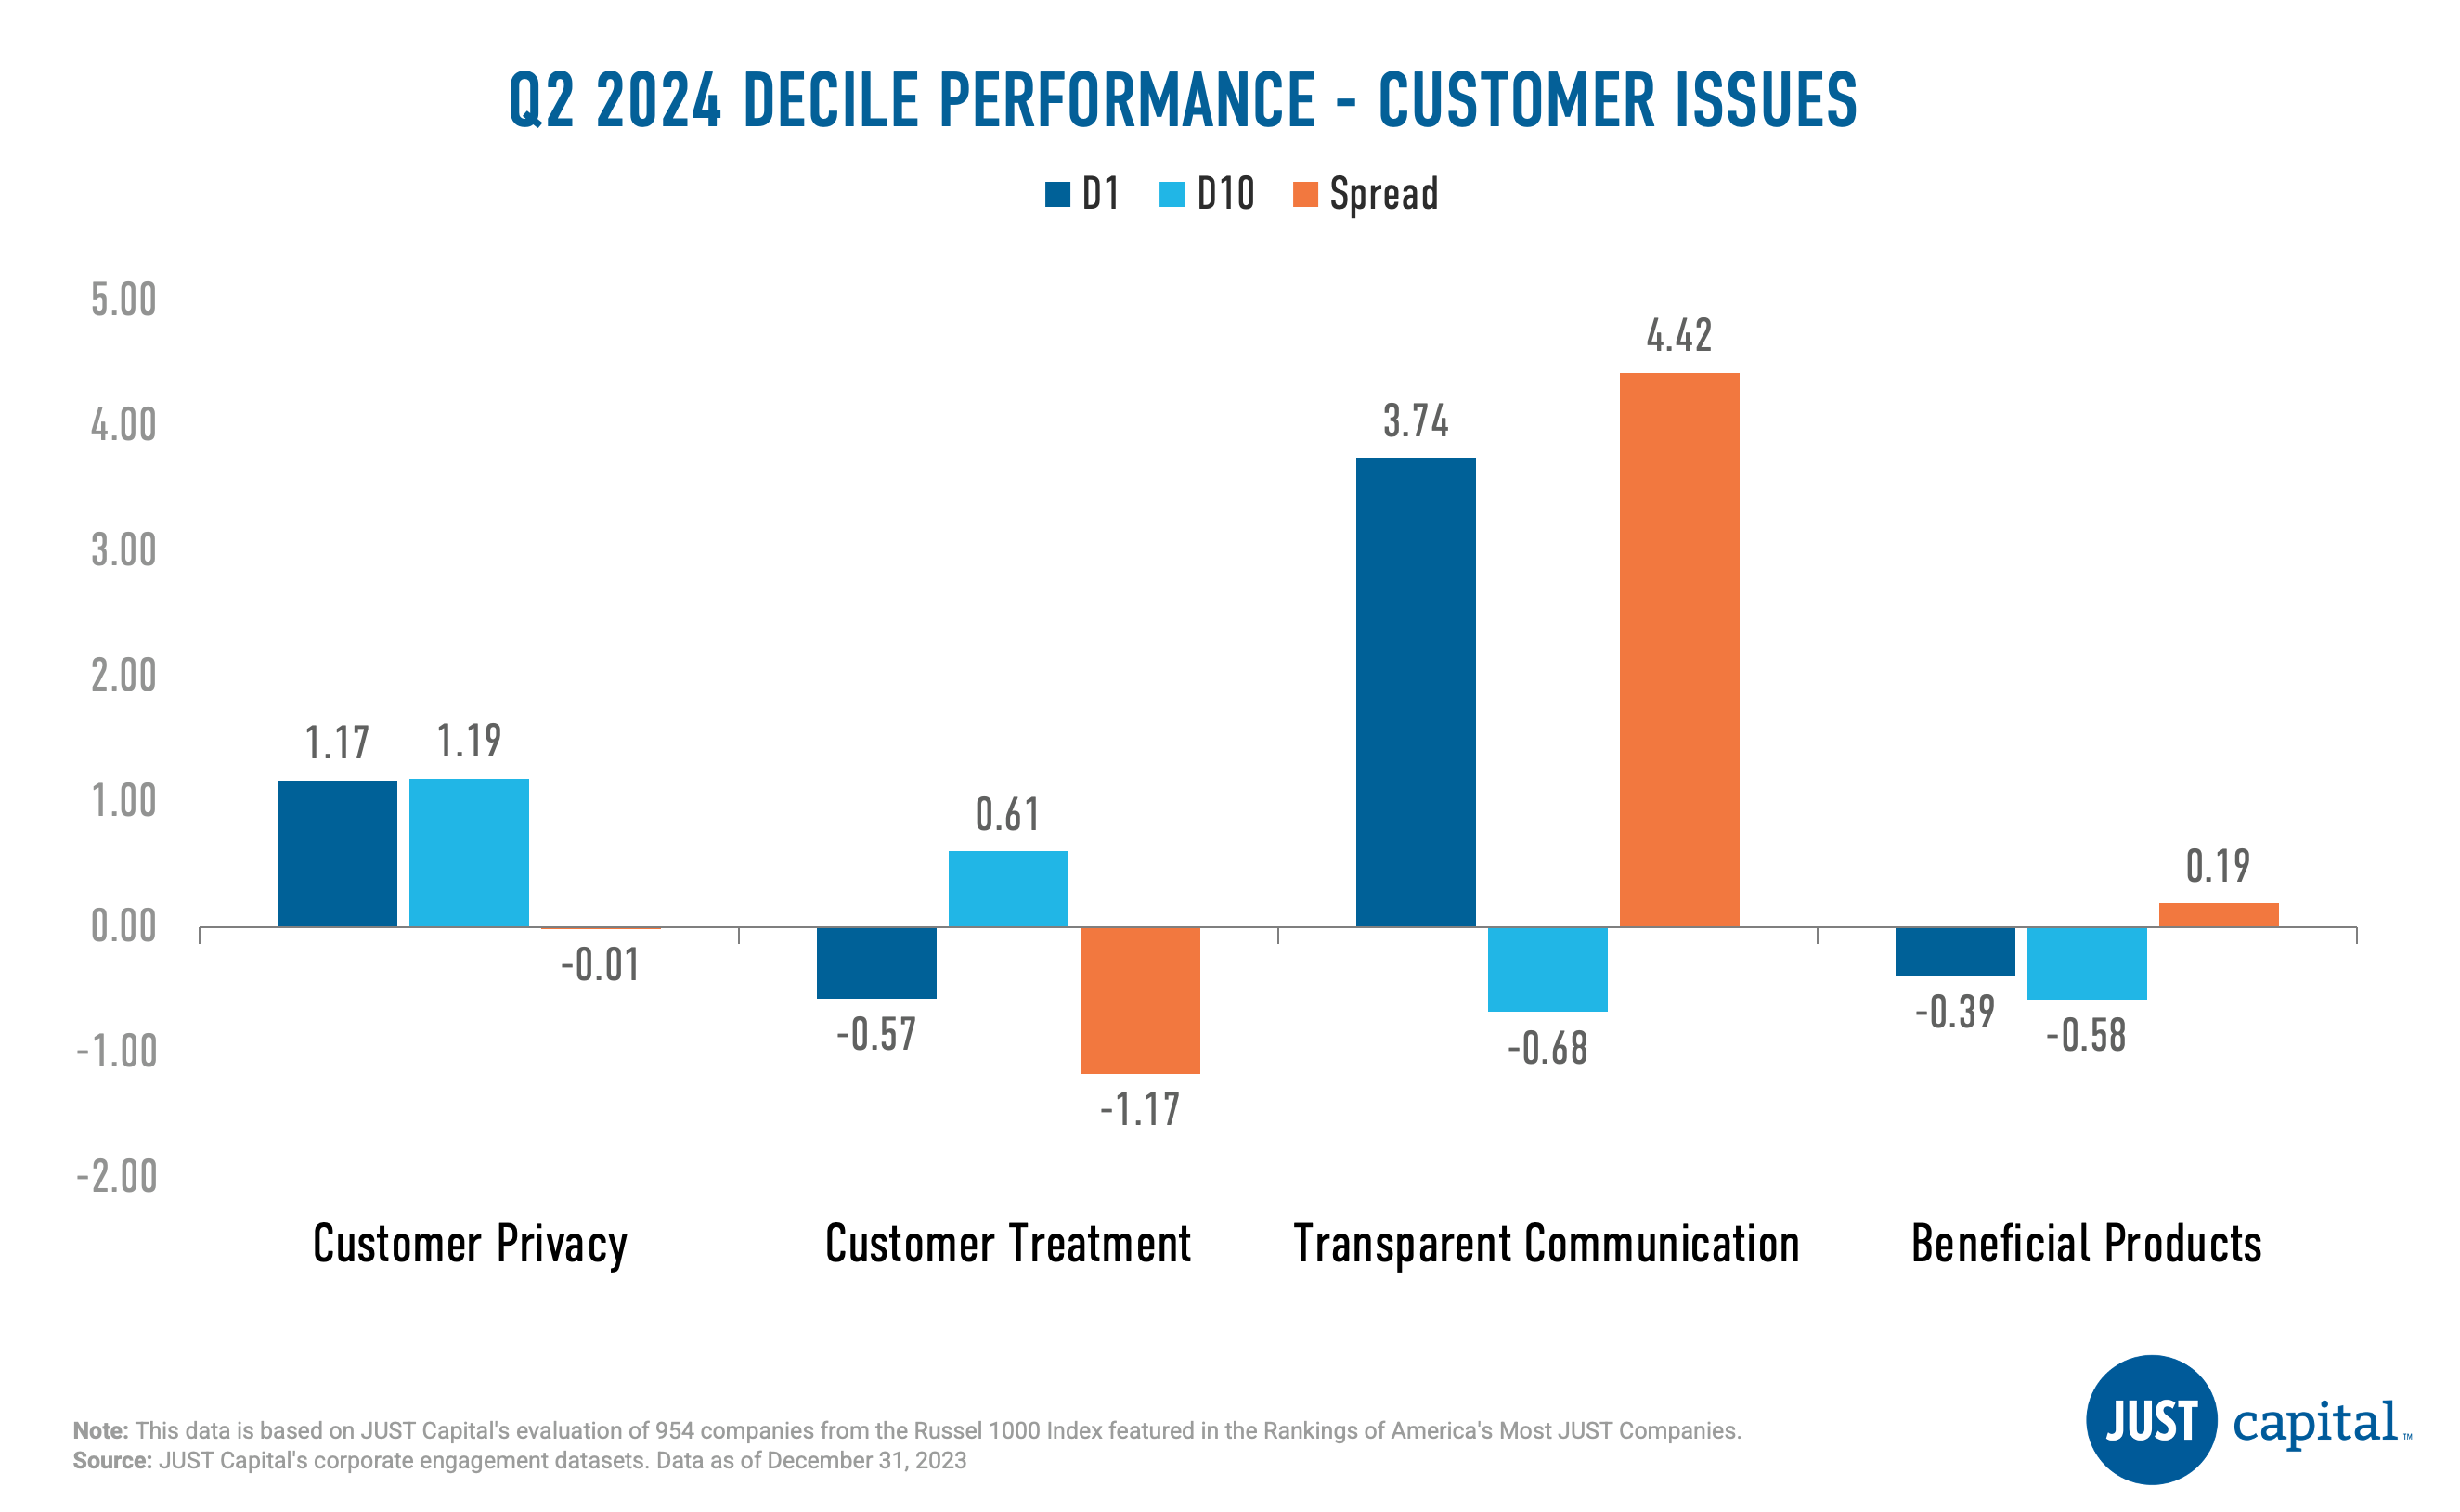
In Q2 2024, two out of 4 Customer Issues delivered negative performance. Transparent Communication was the best performer followed by Beneficial Products.
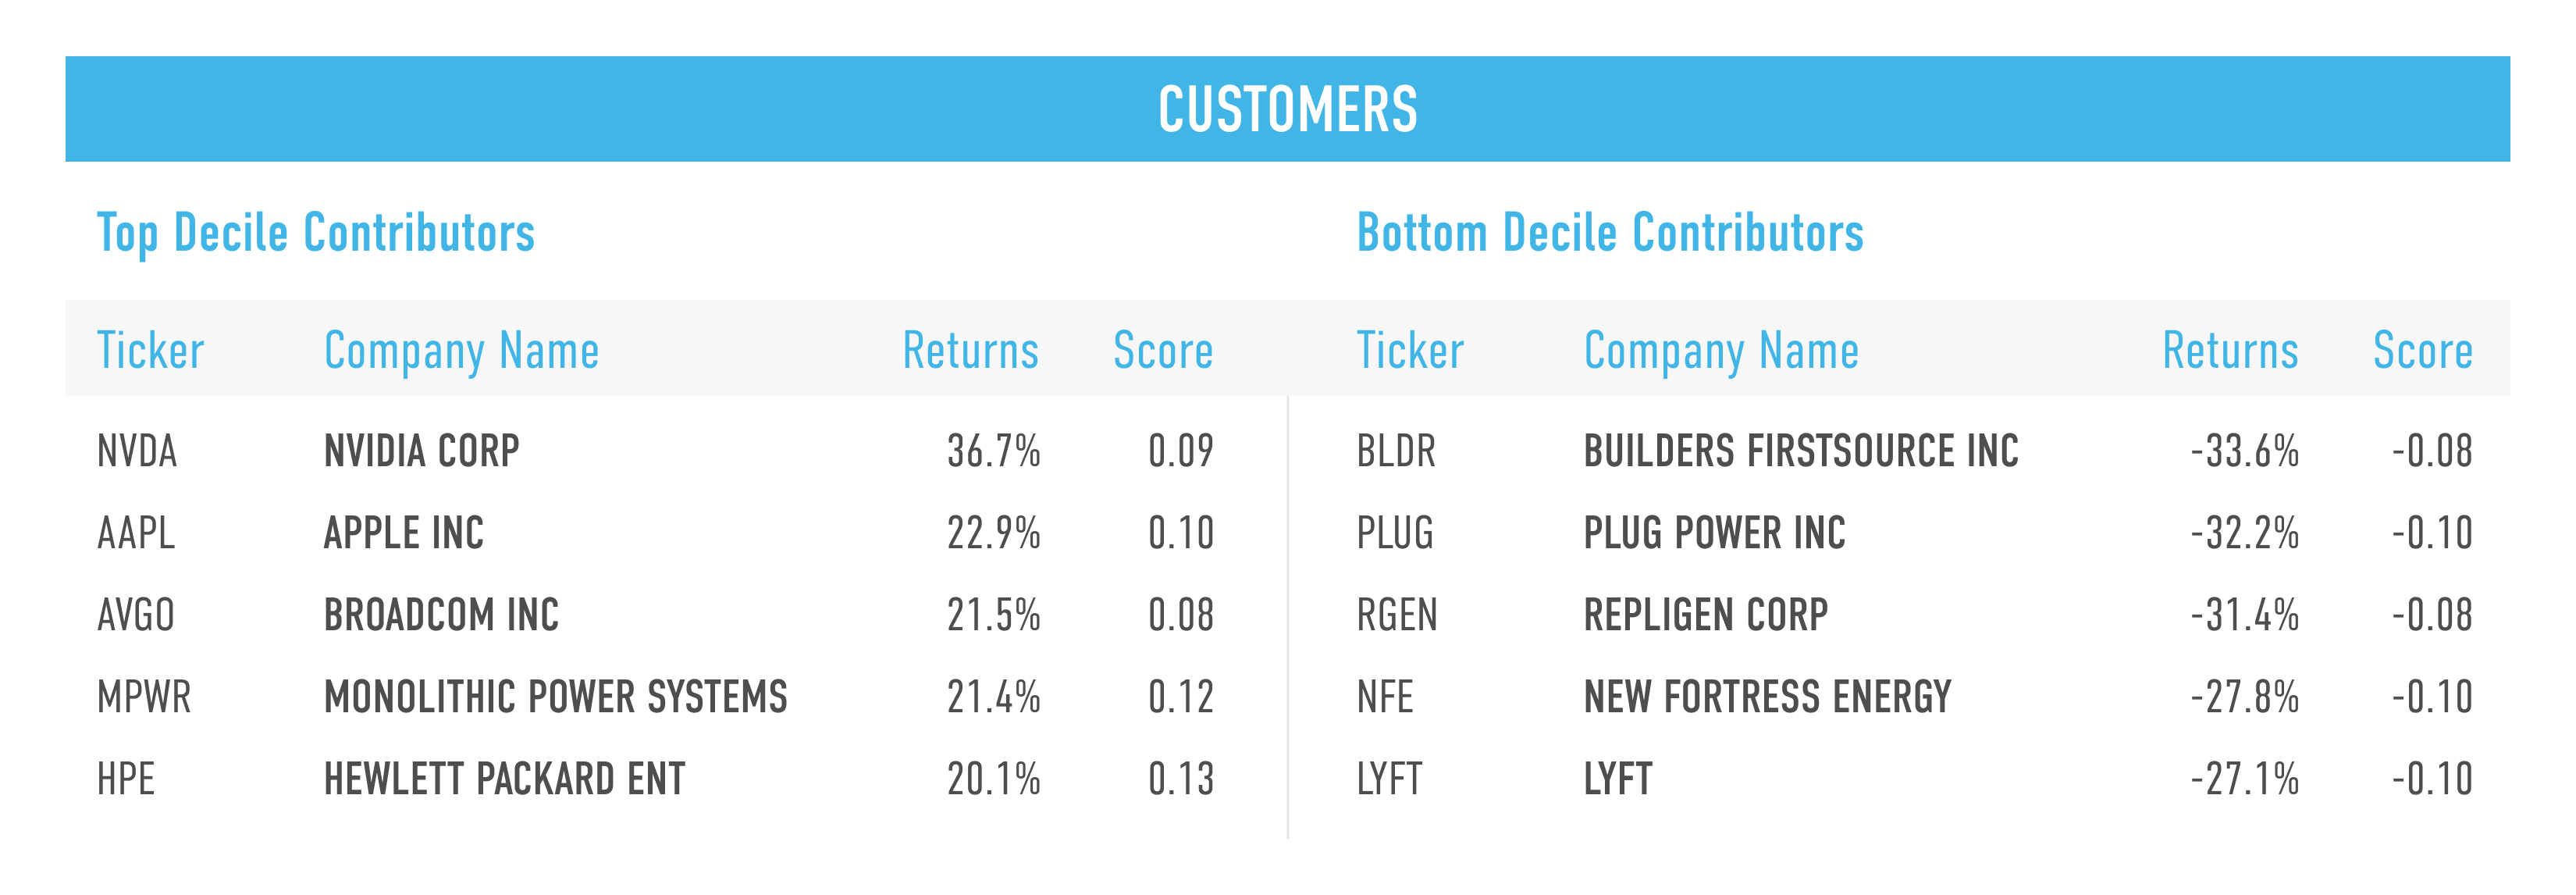
Shown below are the top and bottom five contributors to the top decile (D1), the best-ranked companies as measured by their Customers score, and the bottom decile (D10), the lowest-ranked names as measured by their Customers score.
The Environment stakeholder measures a company across four Issues:
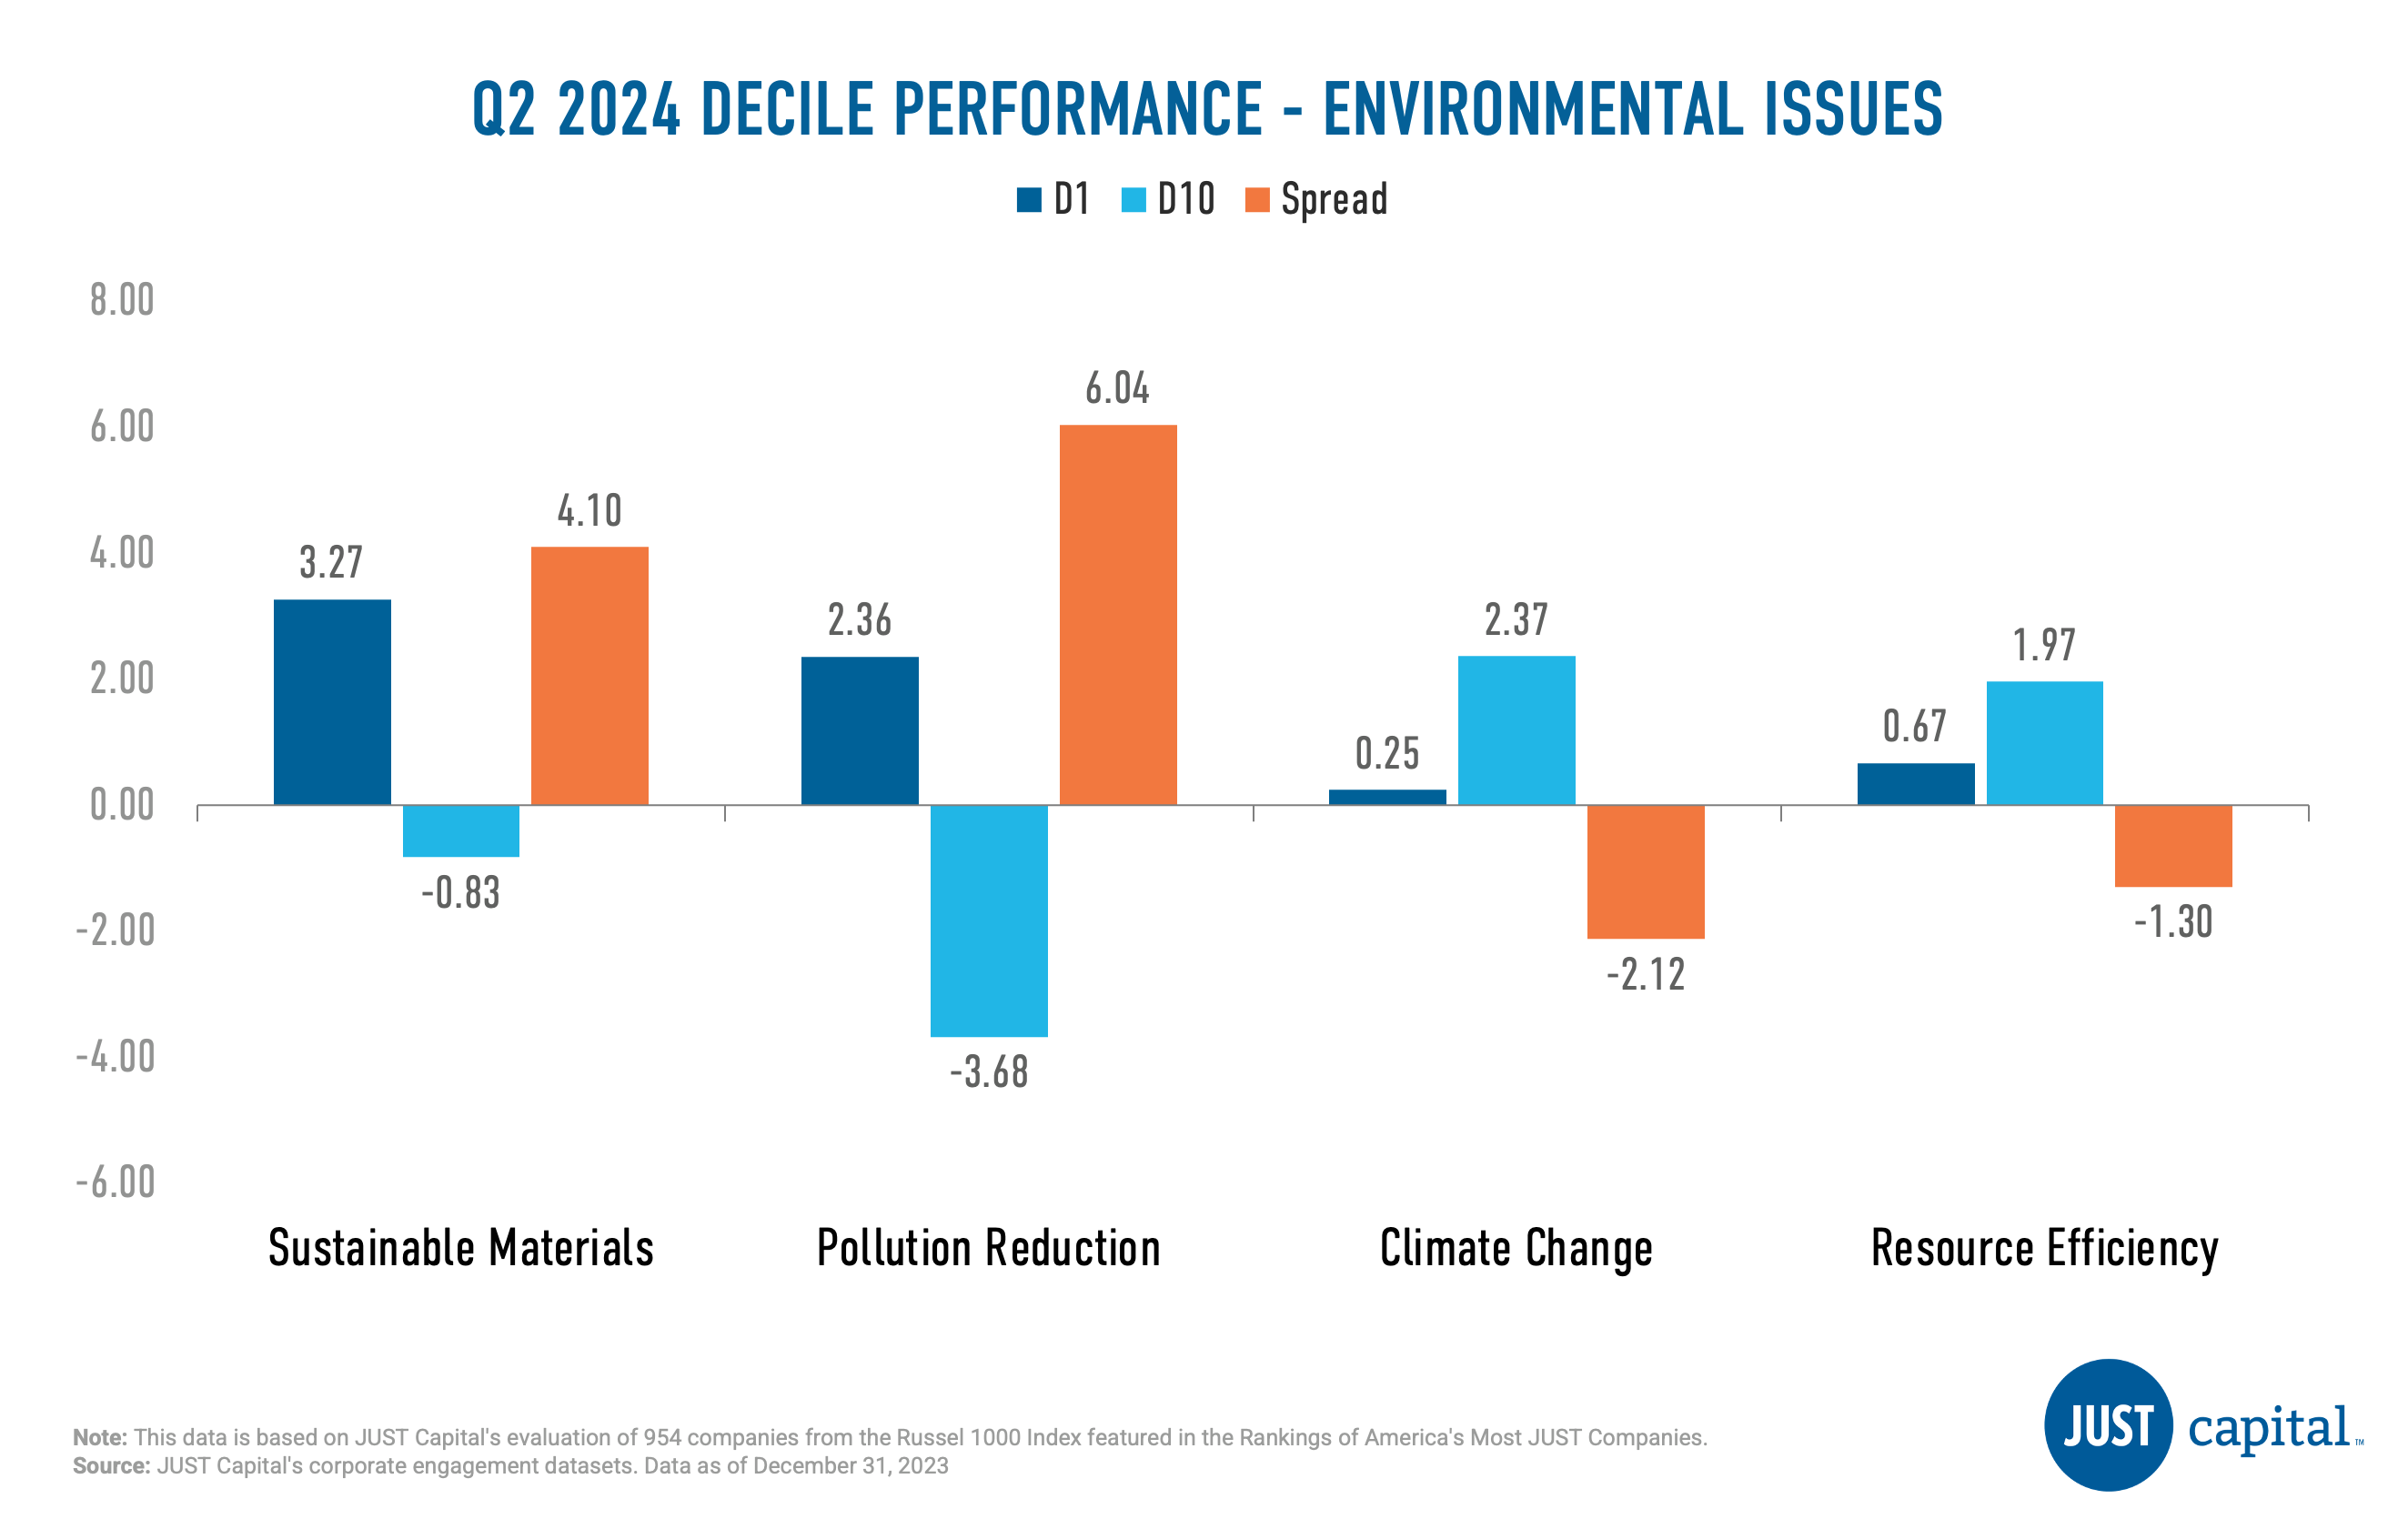
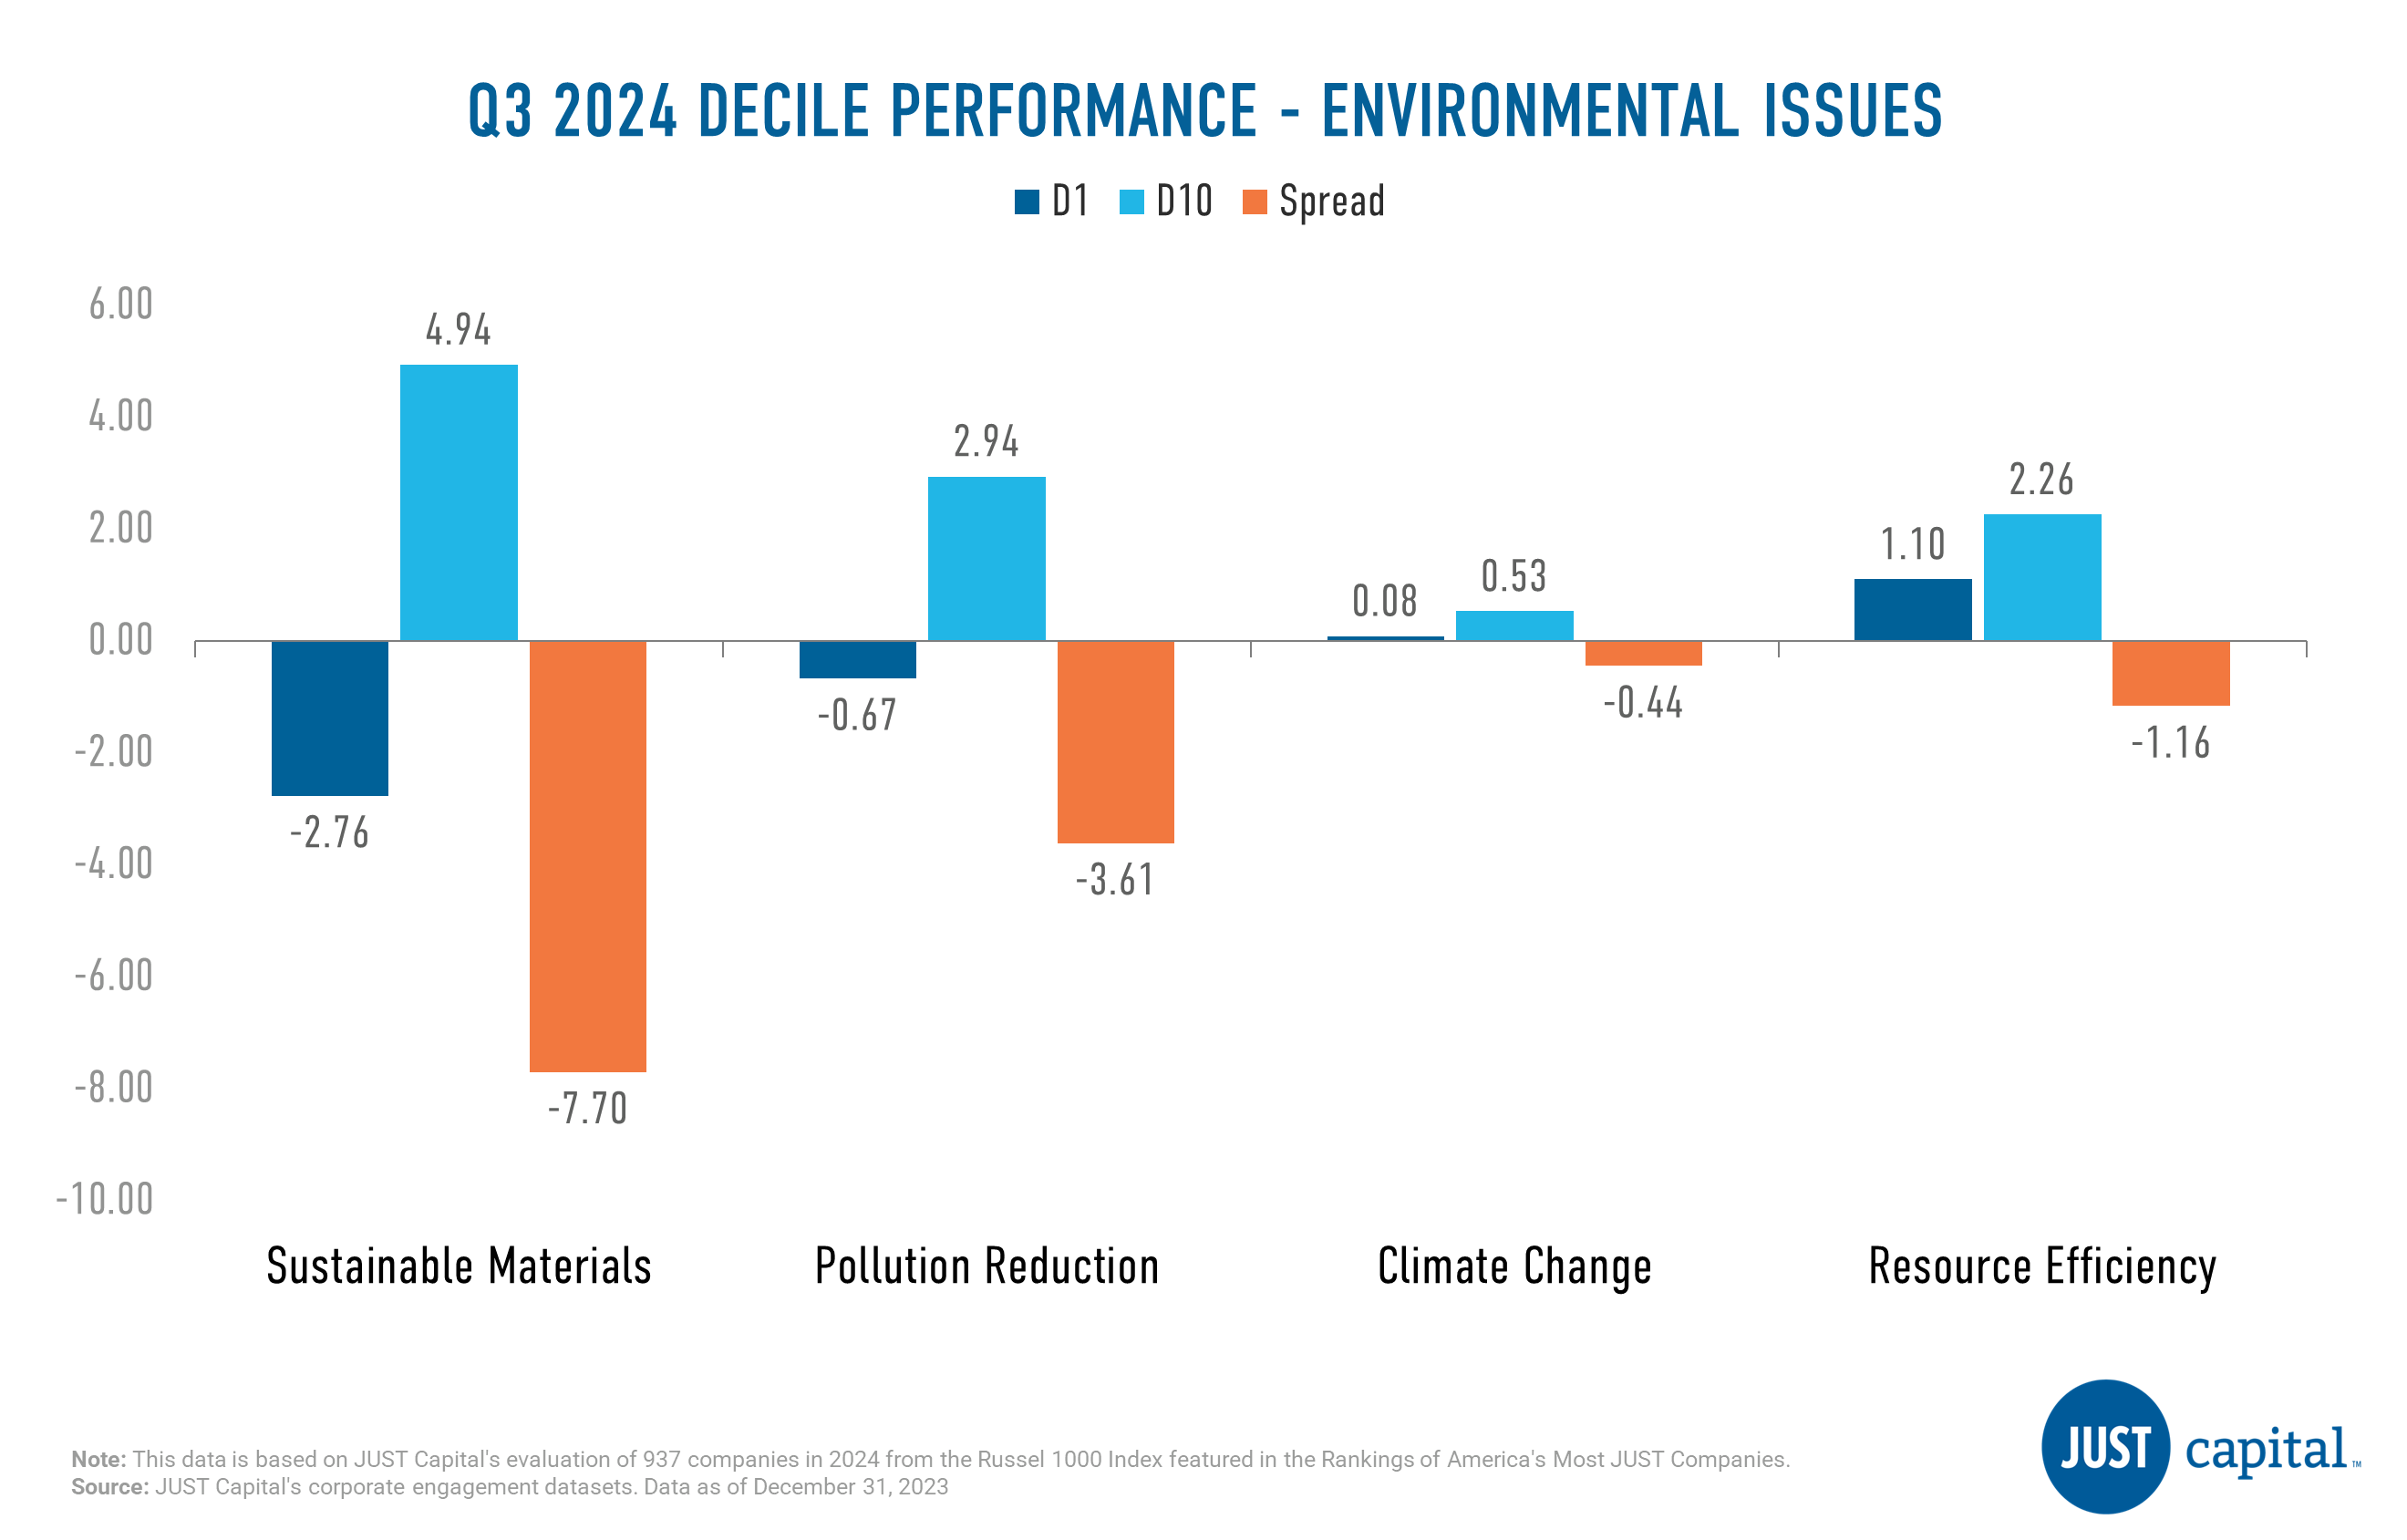
In Q2 2024, we saw two of four Environment Issues deliver positive performance. Pollution Reduction was the top contributor followed by Sustainable Materials in Q2. Climate Change and Resource Efficiency delivered negative performance this quarter.
Shown below are the top and bottom five contributors to the top decile (D1), the best-ranked companies as measured by their Environment score, and the bottom decile (D10), the lowest-ranked companies as measured by their Environment score.
Computation Methodology
We monitor the performance of these stakeholders and Issues on a long-short basis. The long and short portfolios are selected based on the factor scores as the top and bottom deciles within the universe of companies we track in the Russell 1000. Top decile (D1) companies are those that rank highest based on the factor score, and bottom decile (D10) companies are those that rank lowest based on the factor score.
D1 Performance is computed as
(Equally weighted average of returns of stocks in D1 bucket) – (Equally weighted average of returns of all stocks within the Universe)
D10 Performance is computed as
(Equally weighted average of returns of stocks in D10 bucket) – (Equally weighted average of returns of all stocks within the Universe)
Spread is computed as
D1 Performance – D10 Performance
Following a remarkable 2023, stocks have once again surged in 2024, with the S&P 500 achieving its most impressive first-quarter performance since 2019, boasting a year-to-date return of 10.55%. This notable upswing can be attributed to encouraging economic indicators, alleviating concerns regarding a potential U.S. economic downturn. Investors have shifted their focus towards the Federal Reserve’s anticipated transition from monetary policy tightening to easing.
The Nasdaq experienced a significant uptick of 9.3% in the first quarter, propelled by a sustained rally in artificial intelligence-related stocks and optimistic remarks from Federal Reserve officials. Notably, the Magnificent Seven, comprising 29% of the S&P 500’s market value, contributed 37% to the year-to-date return. However, a new group, dubbed the Gang of Four, including Nvidia, Microsoft, Meta Platforms (formerly known as Meta), and Amazon.com, emerged, accounting for 18% of the S&P 500 and 47% of the year-to-date return.
Market breadth remained robust with 369 stocks advancing and 134 declining, showcasing a broad-based rally across sectors. Of the 11 sectors, 10 experienced gains, underscoring the market’s overall strength.
In terms of sectors, technology, consumer cyclical, and consumer defensive sectors led the market gains, each yielding total returns of approximately 8% or higher. Notably, the real estate sector was the sole sector to finish the quarter in negative territory, while the broader stock market rally exhibited resilience and breadth.
As of March 29, 2024, our flagship index – the JUST U.S. Large Cap Diversified Index (JULCD) has out-performed the Russell 1000 (Cap-Weighted) benchmark by 0.35% year-to-date and by 10.7% since its inception. Additionally, the JUST 100 (equally weighted index) has outperformed the Russell 1000 (Equally-Weighted) index by 4.47% year-to-date and by 43.46% since its inception.
JUST Capital found that three of the five stakeholders we track delivered positive performance in Q1 2024. The Communities stakeholder delivered the strongest performance over this period with a long-short spread of 5.19%, while the Customers stakeholder fared most poorly at -2.73%. Within the Workers stakeholder, outperformance was driven by the top decile whereas for Communities & Shareholders & Governance stakeholder outperformance was driven by both deciles. For the Customers stakeholder, underperformance was driven by both deciles whereas for Environment stakeholder negative contribution was driven by bottom decile.
JUST Capital’s Overall Weighted Score takes into account the 20 core Issues determined through our annual survey research – including paying a living wage, creating a diverse, inclusive workplace, and helping combat climate change – across key business stakeholders: Workers, Communities, Shareholders & Governance, Customers, and Environment. This Overall Weighted Score had a positive long-short spread of 4.9% over the period ending March 31,2024.

The Workers stakeholder measures a company across five Issues:

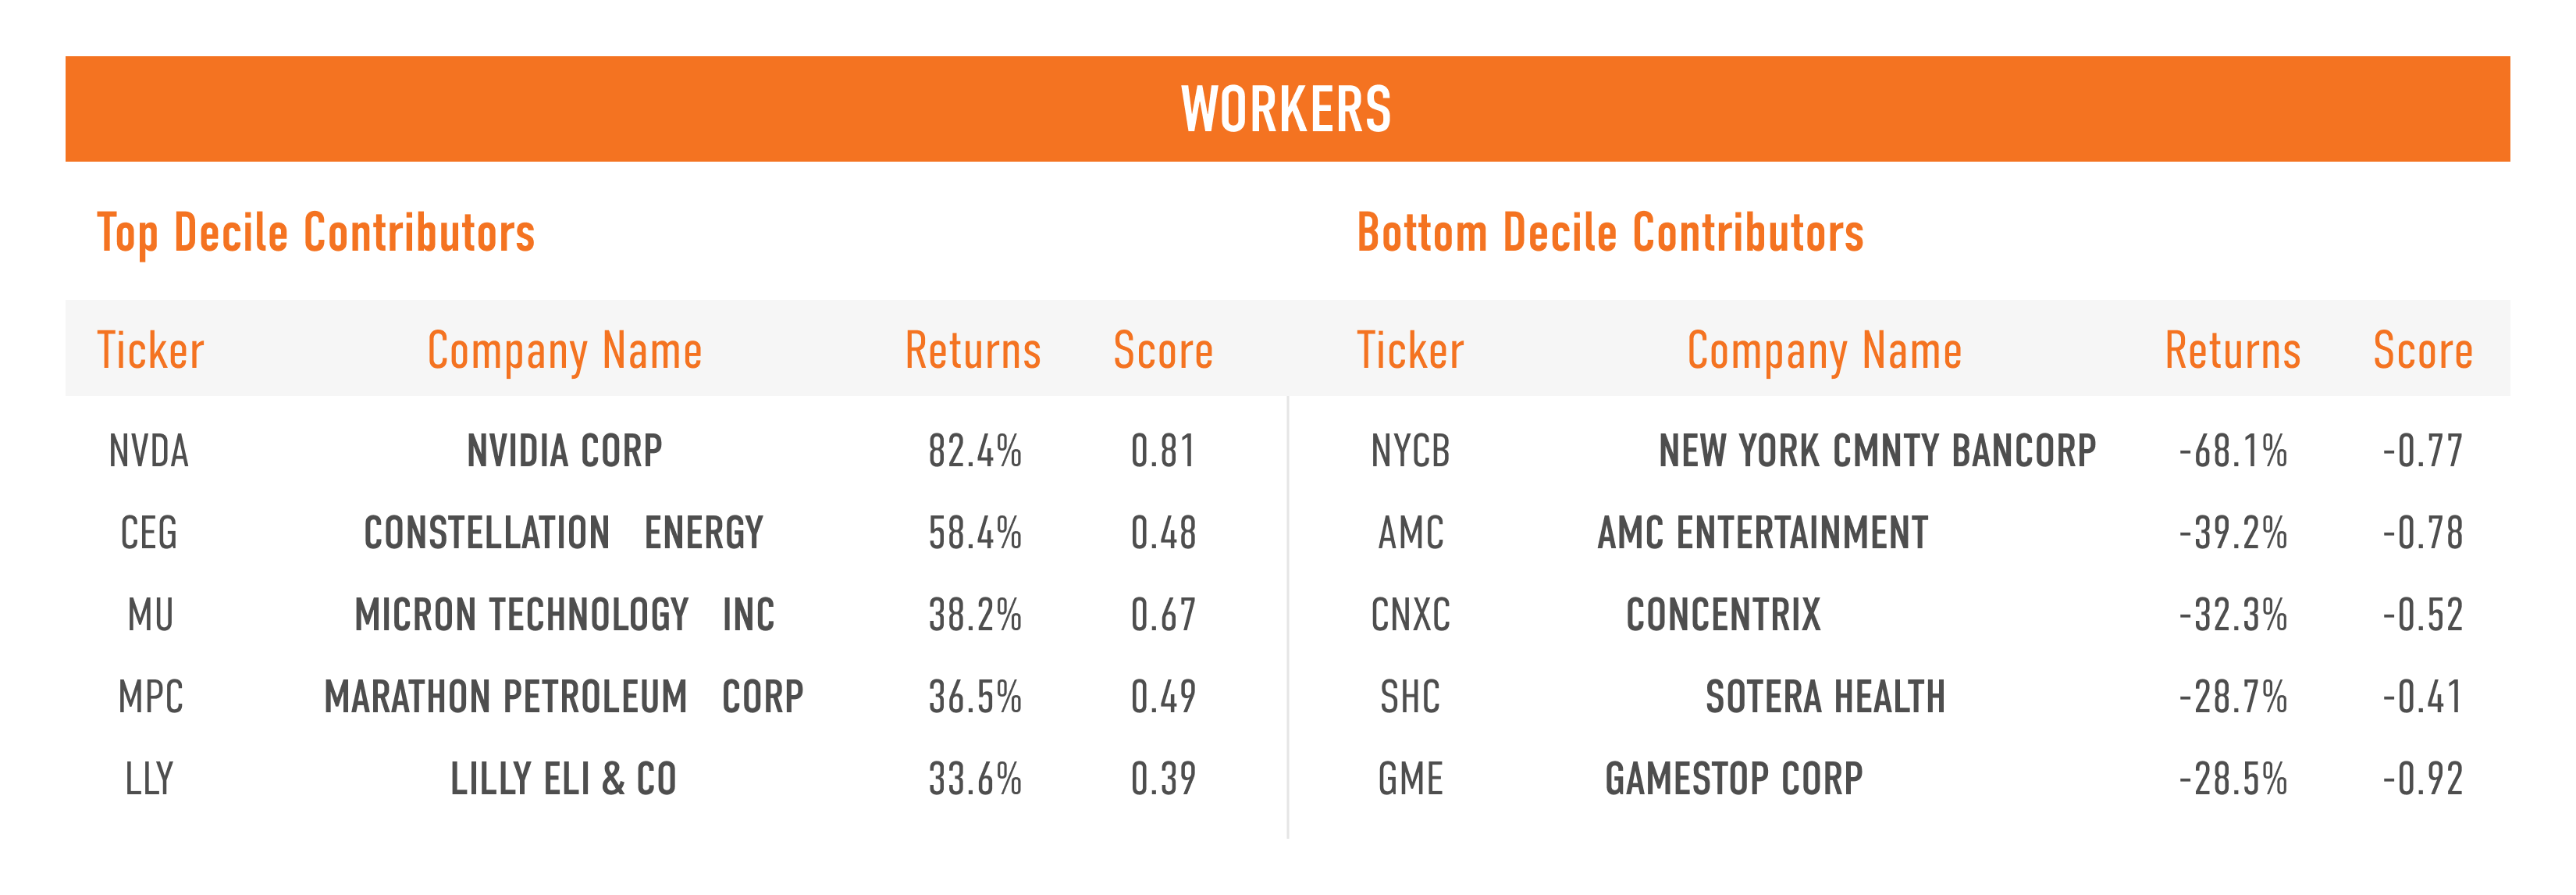
In Q1 2024, we saw all five issues deliver positive performance, with the Workforce Advancement Issue faring the best. Diversity Equity & Inclusion was the weakest performer amongst the Worker issues.
Shown below are the top and bottom five contributors to the top decile (D1), the top-ranked companies as measured by their Workers score, and the bottom decile (D10), the lowest-ranked companies as measured by their Workers score.
The Communities stakeholder measures a company across four Issues:

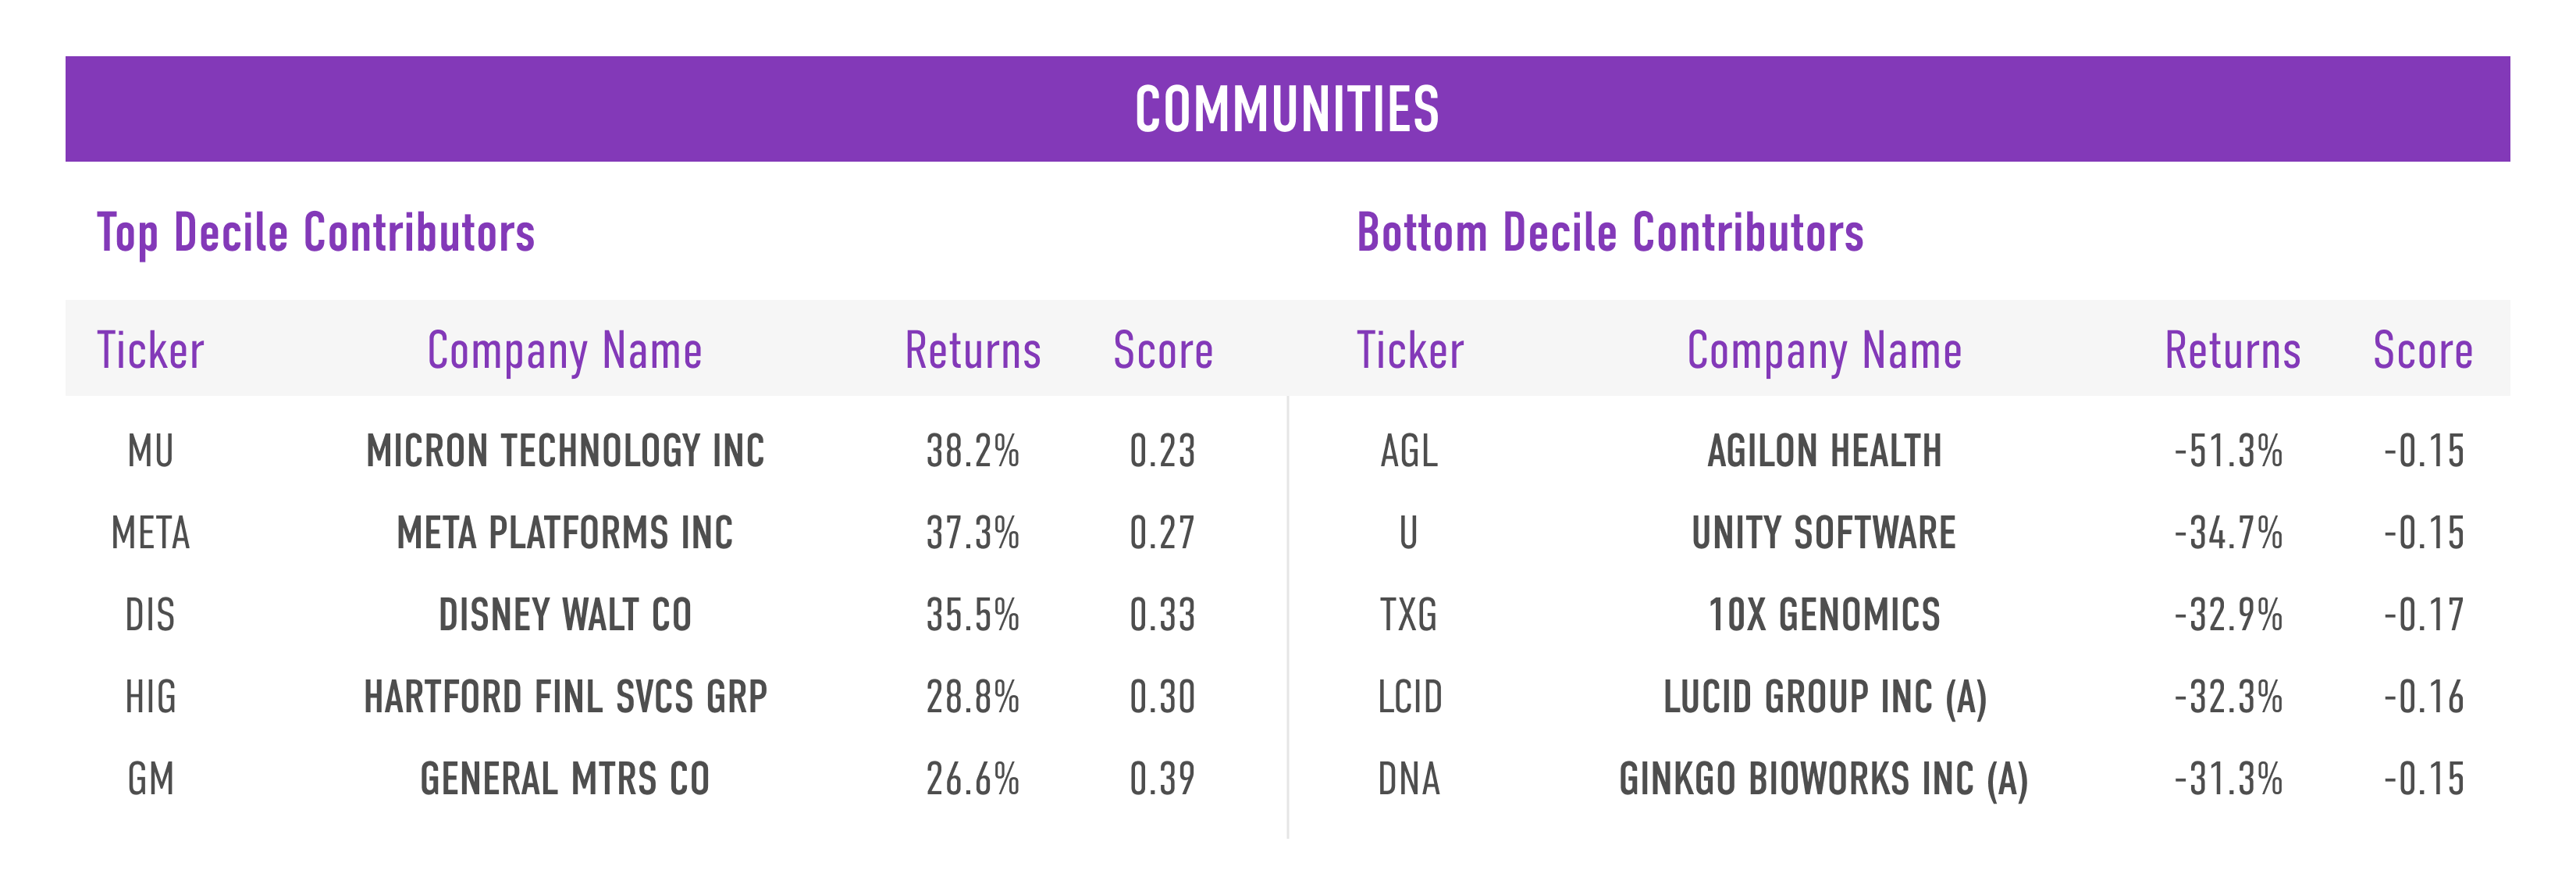
Local Job Creation was the strongest performer followed by Human Rights. All issues were positive in Q1 2024.
Shown below are the top and bottom five contributors to the top decile (D1), the best-ranked companies as measured by their Communities score, and the bottom decile (D10), the lowest-ranked companies as measured by their Communities score.
The Shareholders and Governance stakeholder measures a company across three Issues:
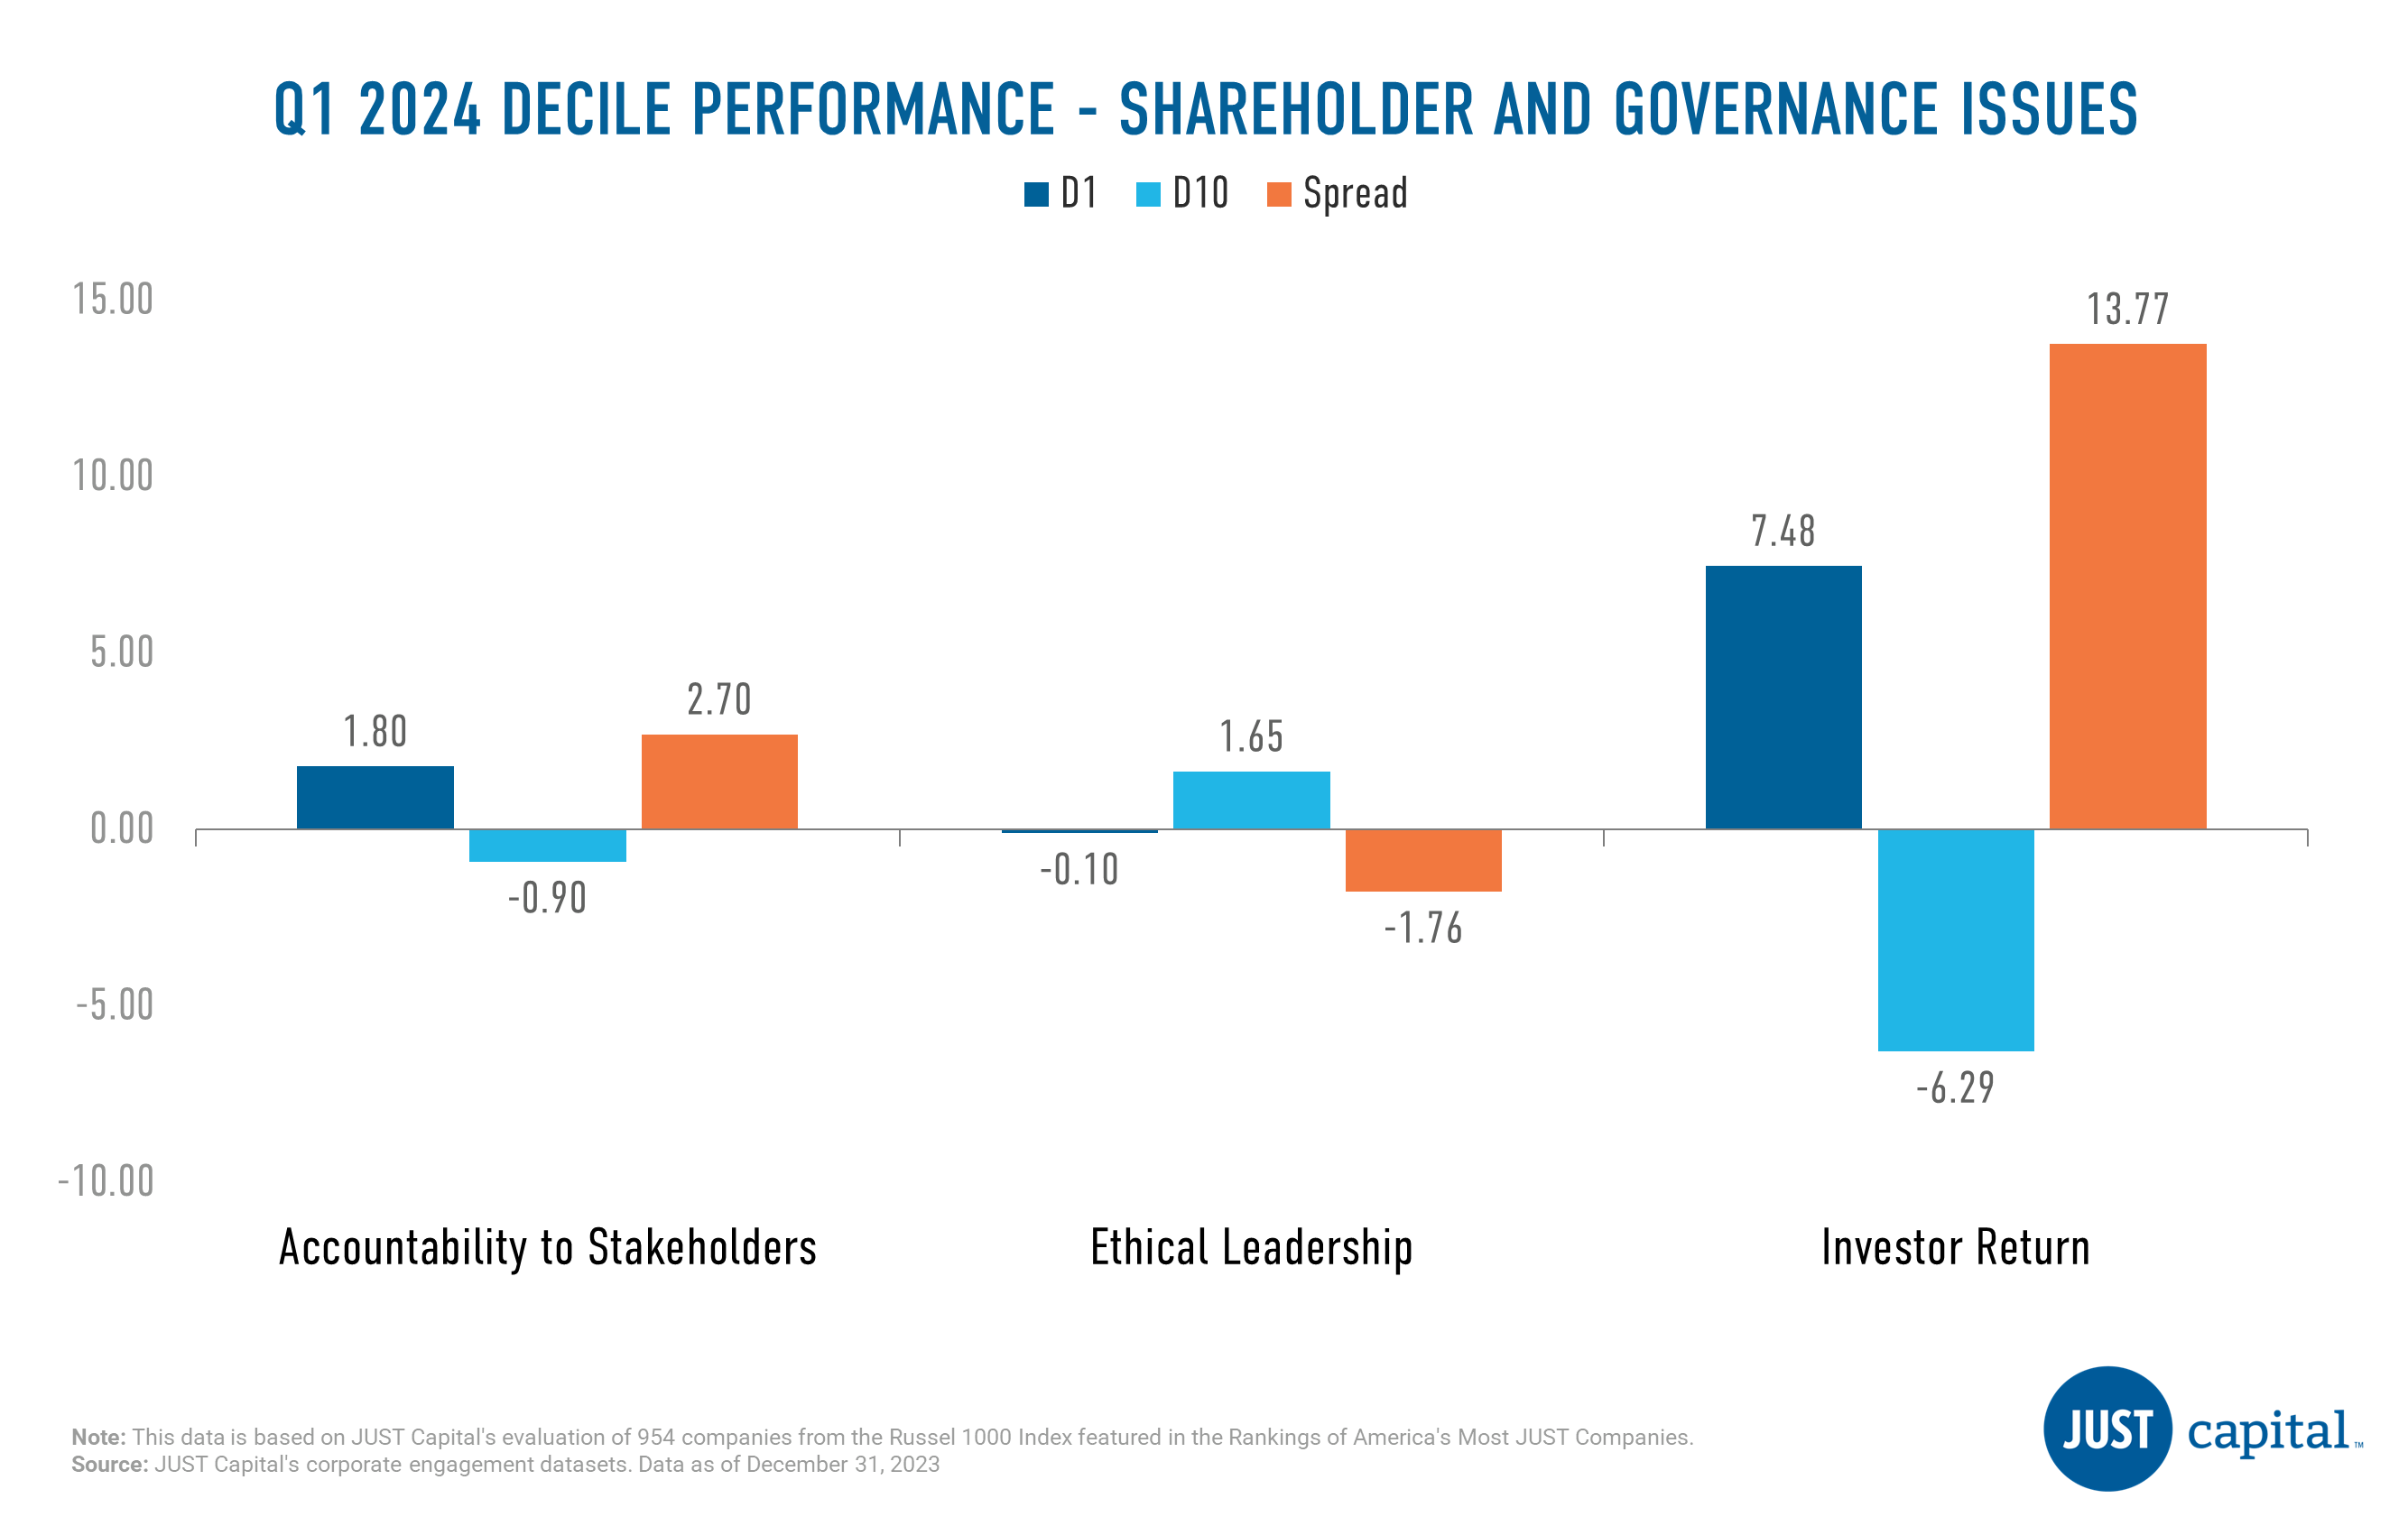
Investor Return Issue was the strongest performer in Q1 with a long-short spread of 13.77% followed by Accountability to Stakeholders issue whereas Ethical Leadership was negative this quarter.
Shown below are the top and bottom five contributors to the top decile (D1), the best-ranked companies as measured by their Shareholders and Governance score, and the bottom decile (D10), the lowest-ranked companies as measured by their Shareholders and Governance score.

The Customers stakeholder measures a company across four Issues:

In Q1 2024, three out of 4 Customer Issues delivered negative performance. Customer Privacy was the only positive contributor in Q1. Transparent Communication was the weakest performer followed by Customer Treatment.
Shown below are the top and bottom five contributors to the top decile (D1), the best-ranked companies as measured by their Customers score, and the bottom decile (D10), the lowest-ranked names as measured by their Customers score.

The Environment stakeholder measures a company across four Issues:

In Q1 2024, we saw two of four Environment Issues deliver positive performance. Resource Efficiency was the top contributor followed by Climate Change in Q1. Pollution Reduction and Sustainable Materials delivered negative performance this quarter.
Shown below are the top and bottom five contributors to the top decile (D1), the best-ranked companies as measured by their Environment score, and the bottom decile (D10), the lowest-ranked companies as measured by their Environment score.

We monitor the performance of these stakeholders and Issues on a long-short basis. The long and short portfolios are selected based on the factor scores as the top and bottom deciles within the universe of companies we track in the Russell 1000. Top decile (D1) companies are those that rank highest based on the factor score, and bottom decile (D10) companies are those that rank lowest based on the factor score.
D1 Performance is computed as
(Equally weighted average of returns of stocks in D1 bucket) – (Equally weighted average of returns of all stocks within the Universe)
D10 Performance is computed as
(Equally weighted average of returns of stocks in D10 bucket) – (Equally weighted average of returns of all stocks within the Universe)
Spread is computed as
D1 Performance – D10 Performance
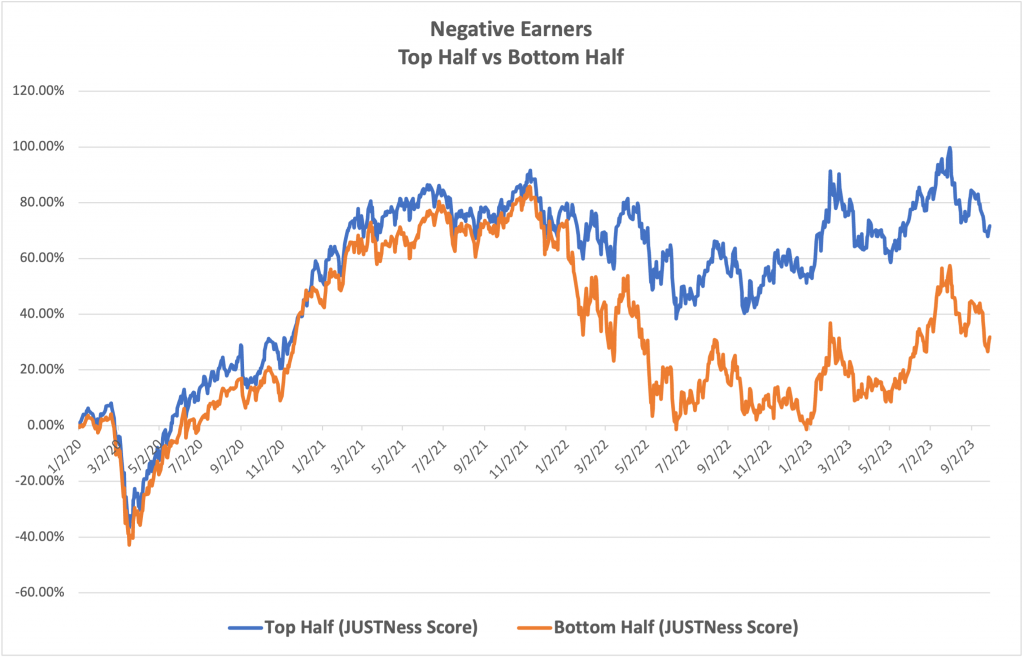
Can JUSTness be used to identify performance leaders within negative earning companies? We think so. In fact, according to our recent analysis, among the negative earners in the Russell 1000 (our coverage universe), JUST leaders have outperformed laggards by almost 40% since January 2020.
One of the rulemaking petitions from the SEC’s Human Capital Accounting Working group highlighted the fact that in 2020, more than half of U.S public companies reported negative earnings. Many of them are relatively young, technology-heavy firms, where investors are betting on future profitability. Traditional valuation techniques, like PE multiples, are less effective in valuing these firms; rather, investors rely on alternative approaches to form a view, things like investments in management quality, intellectual property and other forms of intangible value. In truth, major value-creating exercises of any modern firm – including research and development, and human capital – appear solely as expenses on the balance sheet – as if they provide no future value.
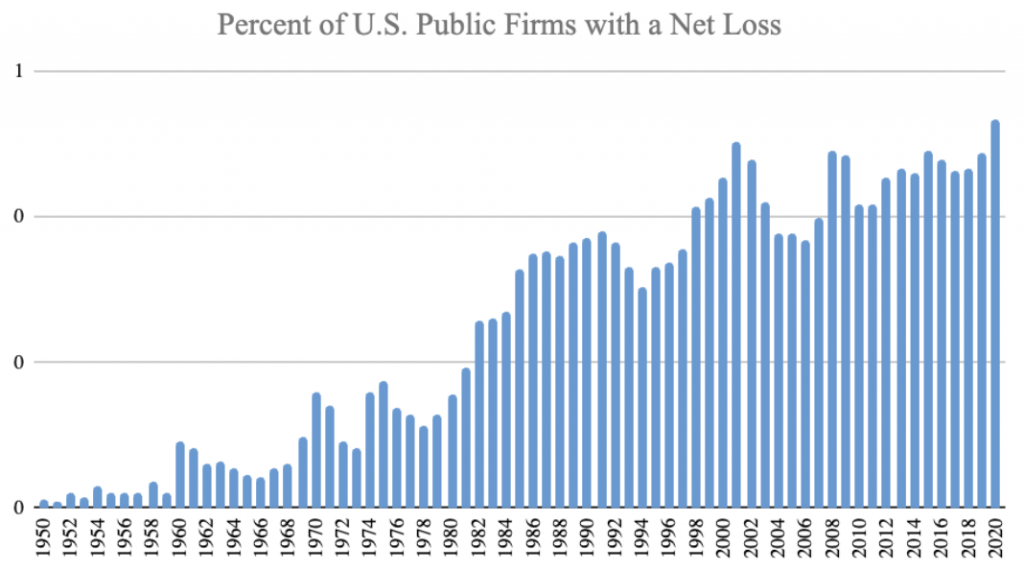
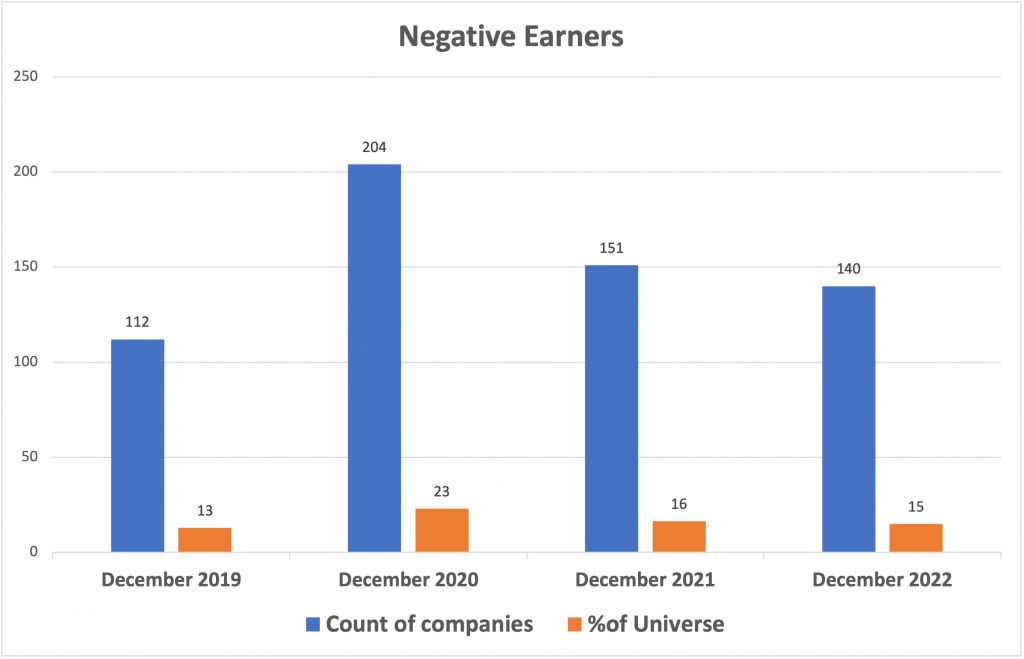
We looked at the number of negative earners within the Russell 1000 every year over a four year period using as a metric Net Income as of year-end, which is when our rankings are typically updated. The total number of companies on the list ranged from a low of 112 in December 2019 (13% of our universe) to 204 (23%) in December 2020.
This overall list was then split into two halves using Overall JUST score as the sole sorting variable, and the aggregate stock market performance of each half determined.
What we found was that the basket of negative-earning companies comprising those ranked in the top half outperformed those in the bottom half by a massive 39.84% between January 2020 and September 2023.
Why might this be? We think the best way to think about it is that negative earning companies with high overall JUST scores can be real diamonds in the rough. Put another way, high JUST scores can signal hidden opportunities. While their financial statements might currently be in the red, their commitment to their workers, to the communities where they operate, to becoming more environmentally sustainable and better governed all stand the companies in good stead for future growth and recovery. Investors can use JUST Overall scores to distinguish between performance leaders and laggards within this challenging segment.
As the investment landscape continues to evolve, integrating stakeholder alignment considerations into decision-making processes becomes not just a choice, but a strategic imperative for savvy investors aiming for sustainable and profitable portfolios.
This report was written by Mona Patni, Director of Quantitative Research & Analytics.
After a strong start to 2023, the Russell 1000 was down 3.15% in Q3, bringing its year-to-date gains to 13%. On a sector level, nine of the 11 Russell 1000 sectors finished the third quarter with negative returns, a stark reversal from the broad gains of the second quarter. Energy was, by far, the best-performing sector, thanks to a surge in oil prices driven by oil production cuts from Saudi Arabia and Russia. Communications Services also finished Q3 with a slightly positive quarterly return, driven in part by hopes that advanced artificial intelligence would boost search and social media companies’ future advertising revenues.
Looking at sector laggards, the impact of rising bond yields was again clearly visible as Consumer Staples, Utilities, and Real Estate were the lowest-performing sectors in the third quarter. Those sectors offer some of the highest dividend yields in the market, but with bond yields quickly rising, those dividend yields become less attractive, leading investors to rotate out of the high-dividend sectors and into less-volatile bond funds as a result. The IT sector also was one of the weakest this quarter.
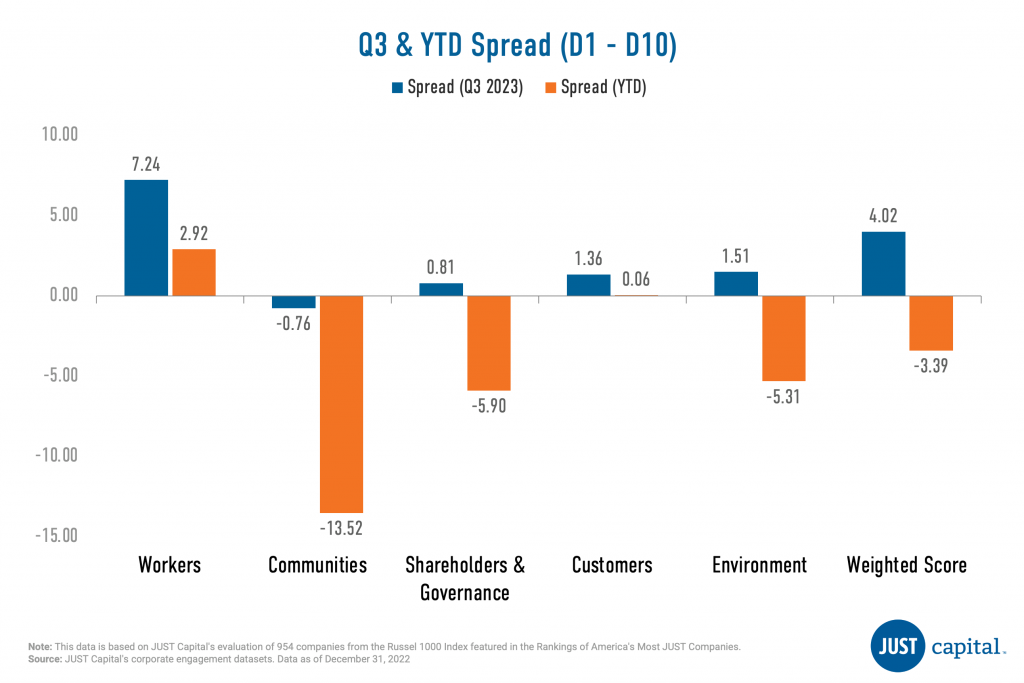
JUST Capital found that four of the five stakeholders we track delivered positive performance in Q3 2023. However, over the longer term from Jan 2018 to September 2023, the leaders in corporate stakeholder performance across all five stakeholders have outperformed the laggards by 56.5% as measured by JUST Overall Score. In Q3 2023, the Workers stakeholder delivered the strongest performance over this period with a long-short spread of 7.24%, while the Communities stakeholder fared most poorly at -0.76%. Within the Workers, Shareholders & Governance, and Environment stakeholders, outperformance was driven by both deciles, with the top decile outperforming and bottom decile underperforming. For the Communities stakeholder, underperformance was driven by the top decile, whereas for the Customer stakeholder, the top decile underperformed.
JUST Capital’s Overall Weighted Score takes into account the 20 core Issues determined through our annual survey research – including paying a living wage, creating a diverse, inclusive workplace, and helping combat climate change – across key business stakeholders: Workers, Communities, Shareholders & Governance, Customers, and Environment. This Overall Weighted Score had a positive long-short spread of 4.02% over the period ending September 30, 2023, which was an improvement from Q2 2023 at -1.43%.
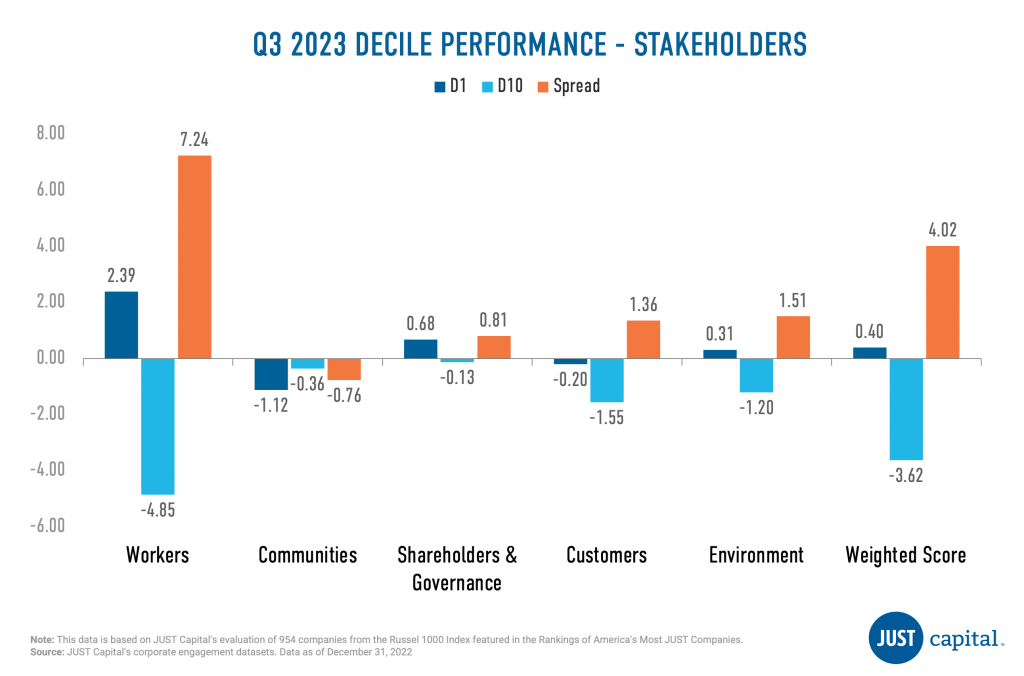
Shown below is the Year-to-Date (YTD) and Q3 performance, which is quantified by the spread between the top and bottom deciles for each stakeholder as well as the overall weighted score. Year-to-date, the Workers stakeholder has delivered the strongest performance and the Communities stakeholder has delivered the weakest.
The Workers stakeholder measures a company across five Issues:
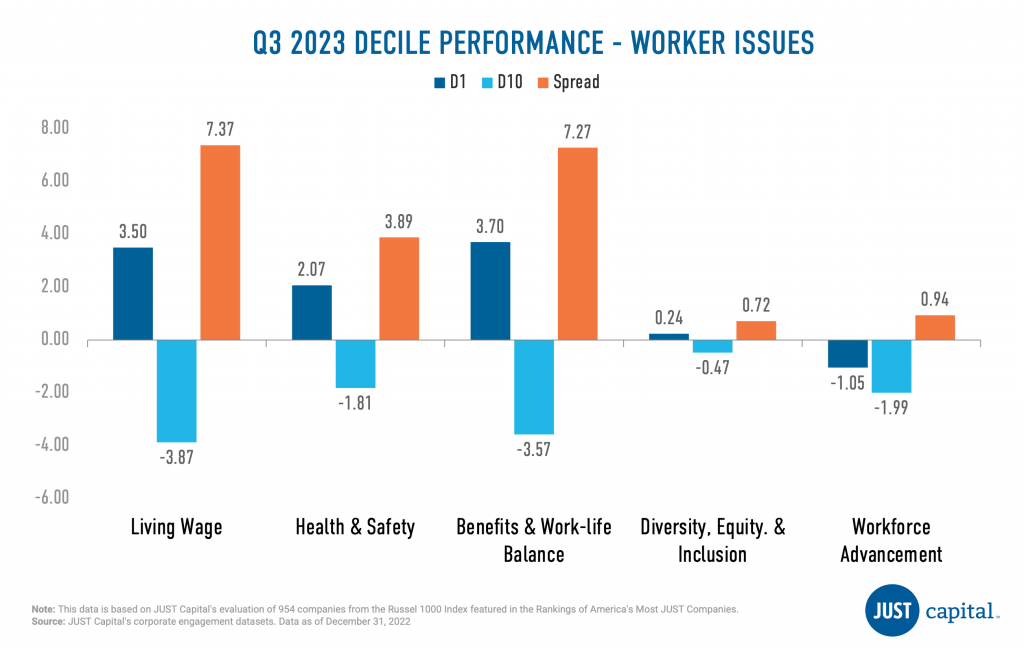
In Q3 2023, we saw all five issues deliver positive performance, with Living Wage and Benefits Issues faring the best. Outperformance in all Issues – except Workforce Advancement – was driven by contribution from both top and bottom decile companies, whereas within Workforce Advancement, positive contribution was driven only by the bottom decile.
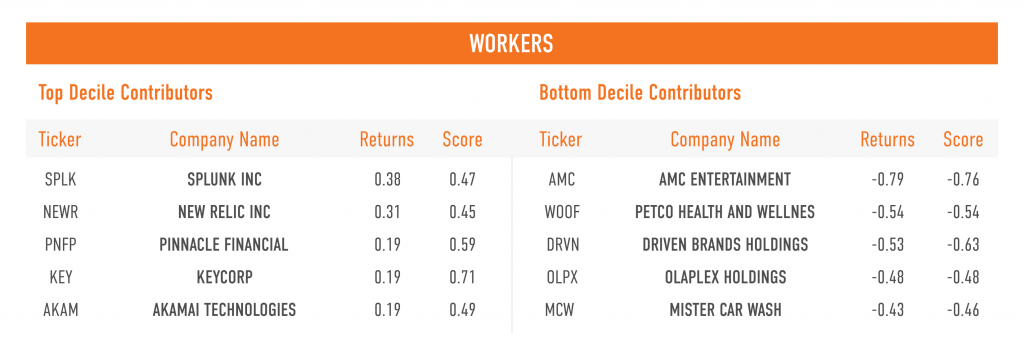
Shown below are the top and bottom five contributors to the top decile (D1), the top-ranked companies as measured by their Workers score, and the bottom decile (D10), the lowest-ranked companies as measured by their Workers score.
The Communities stakeholder measures a company across four Issues:
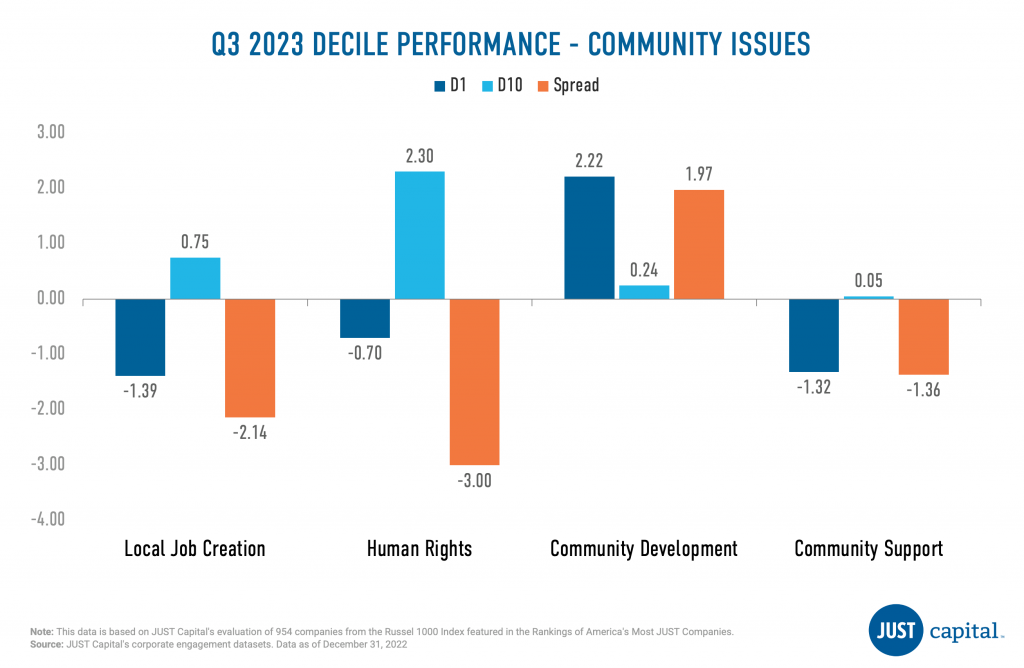
Human Rights was the weakest performer followed by Local Job Creation, with negative contributions coming from both top and bottom decile companies.
Shown below are the top and bottom five contributors to the top decile (D1), the best-ranked companies as measured by their Communities score, and the bottom decile (D10), the lowest-ranked companies as measured by their Communities score.
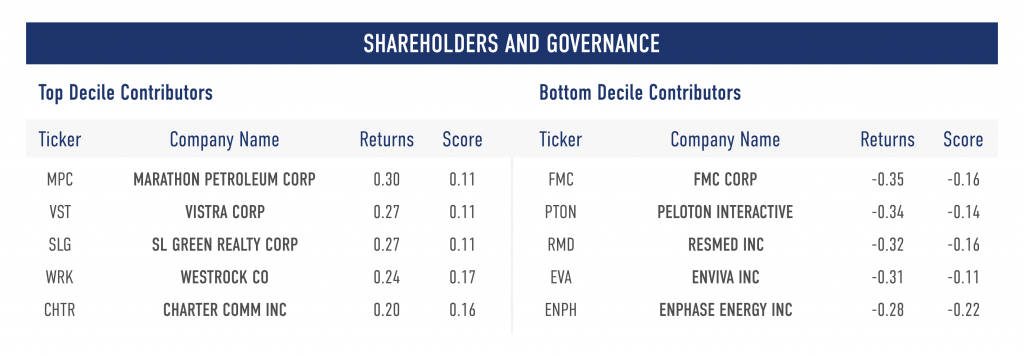
The Shareholders and Governance stakeholder measures a company across three Issues:
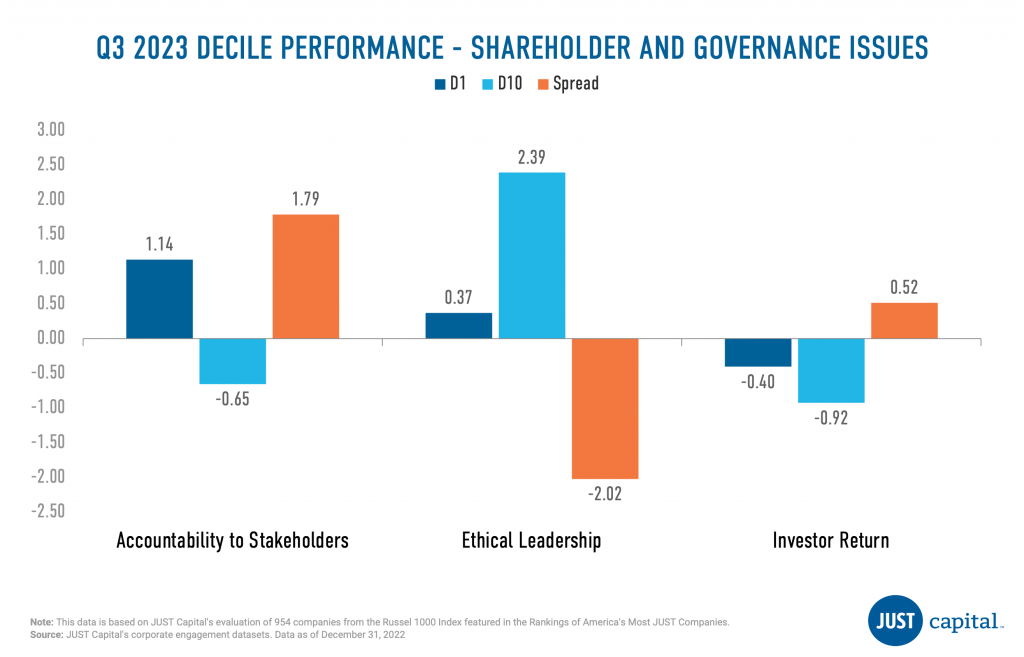
In Q3 we saw the Accountability to Stakeholders Issue deliver positive performance, with a long-short spread of 1.79%, whereas Ethical Leadership performance was negative. Investor Return was also positive this quarter.
Shown below are the top and bottom five contributors to the top decile (D1), the best-ranked companies as measured by their Shareholders and Governance score, and the bottom decile (D10), the lowest-ranked companies as measured by their Shareholders and Governance score.
The Customers stakeholder measures a company across four Issues:
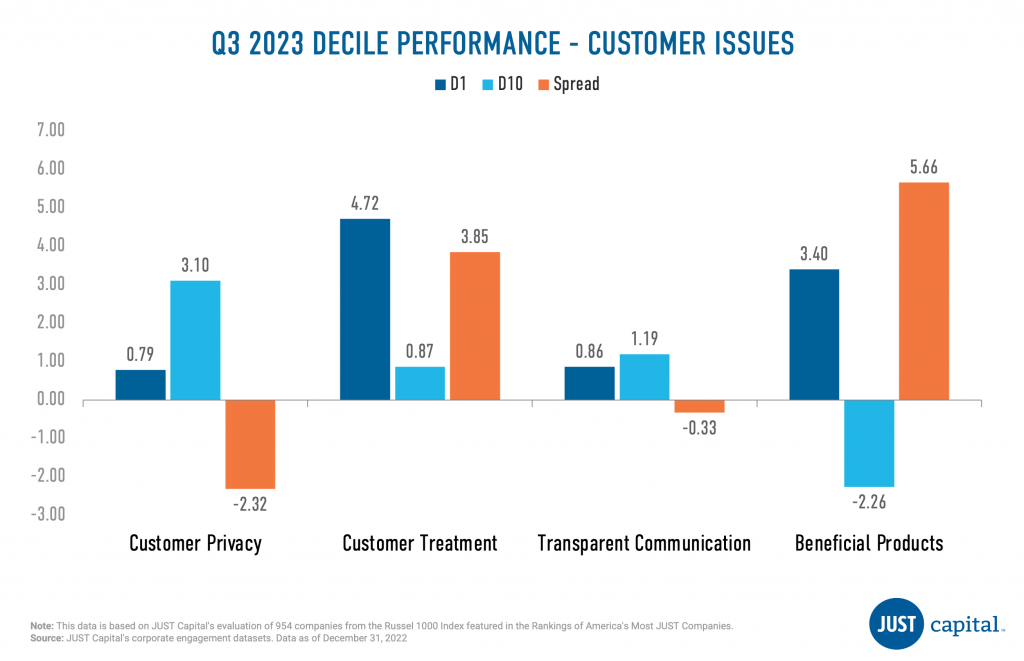
In Q3 2023, we saw Beneficial Products outperform the other Customer Issues, with a long-short spread of 5.6%. Customer Treatment was also positive whereas Customer Privacy and Transparent Communication were negative contributors to Customers performance.
Shown below are the top and bottom five contributors to the top decile (D1), the best-ranked companies as measured by their Customers score, and the bottom decile (D10), the lowest-ranked names as measured by their Customers score.
The Environment stakeholder measures a company across four Issues:
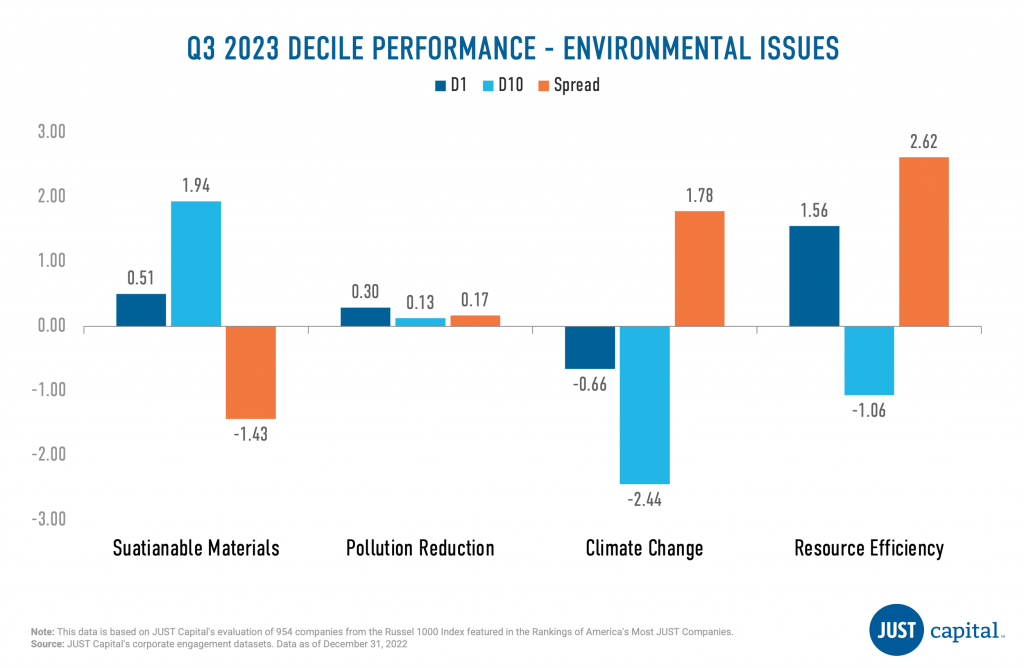
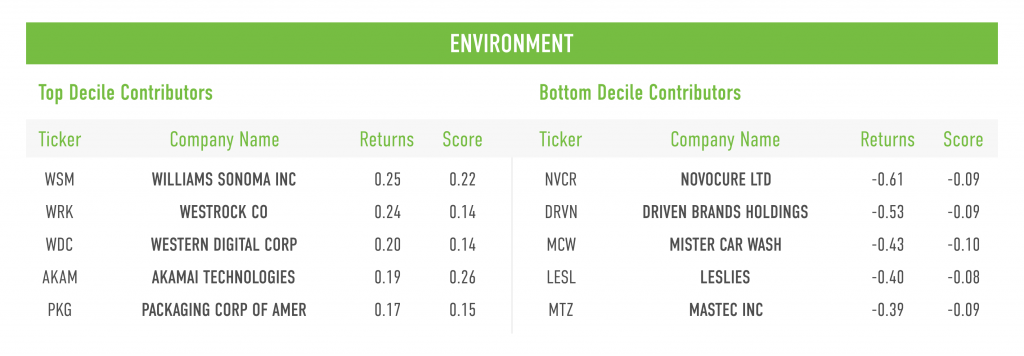
In Q3 2023, we saw three of four Environment Issues deliver positive performance, with Sustainable Materials being a negative contributor this quarter.
Shown below are the top and bottom five contributors to the top decile (D1), the best-ranked companies as measured by their Environment score, and the bottom decile (D10), the lowest-ranked companies as measured by their Environment score.
Computation Methodology
We monitor the performance of these stakeholders and Issues on a long-short basis. The long and short portfolios are selected based on the factor scores as the top and bottom deciles within the universe of companies we track in the Russell 1000. Top decile (D1) companies are those that rank highest based on the factor score, and bottom decile (D10) companies are those that rank lowest based on the factor score.
D1 Performance is computed as
(Equally weighted average of returns of stocks in D1 bucket) – (Equally weighted average of returns of all stocks within the Universe)
D10 Performance is computed as
(Equally weighted average of returns of stocks in D10 bucket) – (Equally weighted average of returns of all stocks within the Universe)
Spread is computed as
D1 Performance – D10 Performance
This report was authored by JUST Senior Director of Quantitative Research & Analytics Mona Patni and Senior Research Manager Laura Thornton.
As we continue to experience global heat waves, wildfires, and extreme weather, it is increasingly important that companies consider the ways in which climate impacts all their key stakeholders – including workers, customers, communities, shareholders, and the environment in which they operate.
In particular, workers stand to be keenly affected by climate change, which looms large over the well-being of their communities as well as the security of certain jobs and industries. Calls for transitioning to greener energy sources represent not only a vital step in addressing climate change; they also carry significant implications for workers and communities that have traditionally relied on the fossil fuel industry for jobs.
With Climate Week and Labor Day not far behind us – we were interested to analyze the companies that lead on investing in the needs of their workforces and reducing their environmental impact. Building upon the collection of index concepts that JUST Capital launched earlier this year, we’ve constructed a new concept: the Workers & Environment Leaders, which tracks the top 20% of companies that perform best across all the Environment- and Worker-related Issues in our 2023 Rankings.
What we found is that the Workers & Environment Leaders has outperformed the Russell 1000 by a significant 21.73% from January 2018 to July 2023.
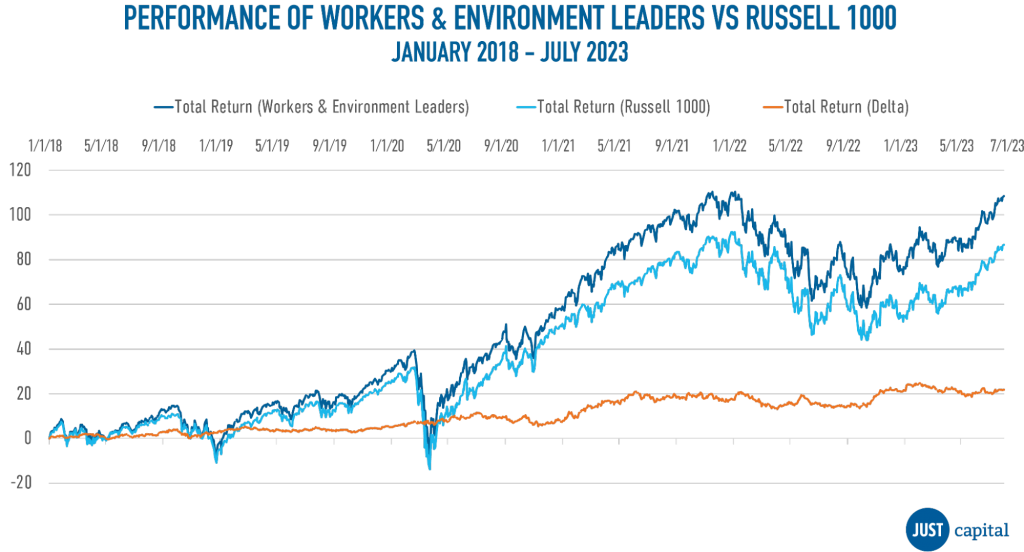
The companies that are investing in both their workers and the environment are clearly seeing strong returns in the market, signaling that investors benefit when the transition to green energy is conducted with workers central to the conversation.
Amongst the companies included in the Workers & Environment Leaders, several stand out for their efforts to prioritize the health of both their workforce and the environment.
All of these companies have also set climate commitments through the Council for Inclusive Capitalism, which houses resources for companies on the journey to enabling a just transition.
The importance of this “just transition” cannot be understated. As we continue to face uncertainty for the workforce and climate alike, an integrated approach is essential in fulfilling the priorities of the public, which drive corporate performance in our Rankings as well as inclusion in the Workers & Environment Leaders index concept. Companies working toward a just transition are able to:
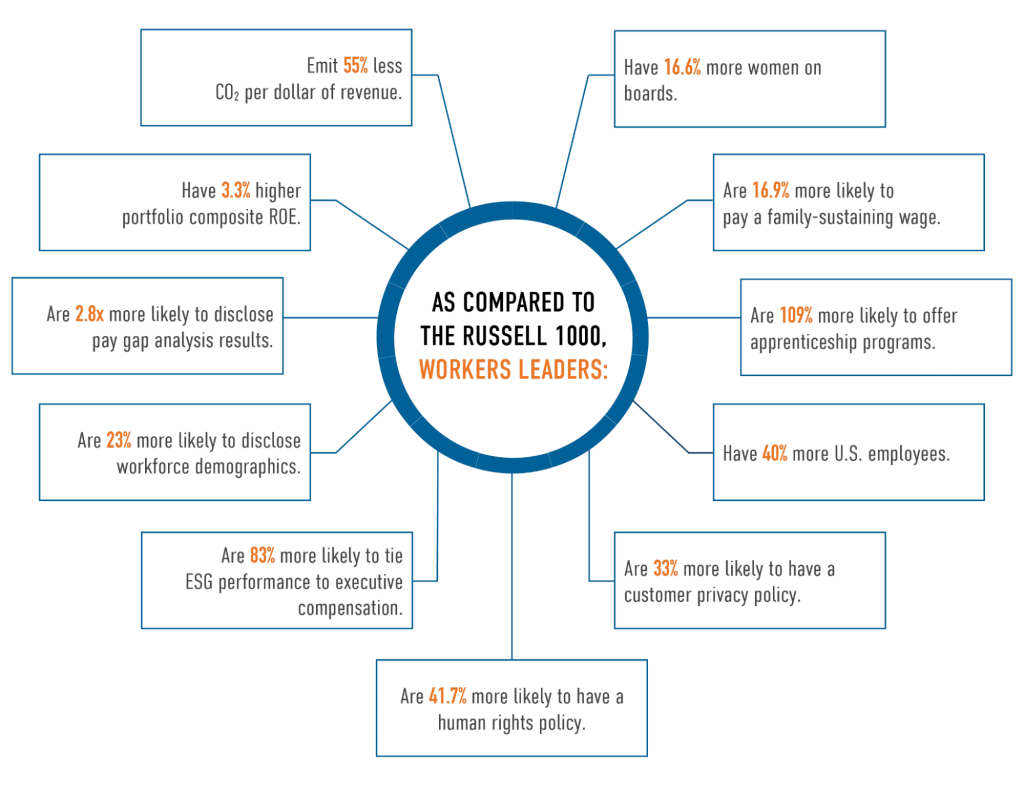
Companies in the Workers & Environment Leaders not only outperform in the market, they outperform their Russell 1000 peers on many of the issues we track. As compared to the Russell 1000, Workers & Environment Leaders:
The Workers & Environment index concept – along with the others we launched earlier this year – are a powerful tool in our helping us continue to build the business and investor case for why just business is better business. They can be leveraged and licensed as is, or spark a conversation for how we might work together to craft a custom index or product. If you are interested in learning more, please contact us.