
Following up on our recent report exploring racial and ethnic board data disclosure at the 100 largest employers in the Russell 1000, we’re now going to take a look at our larger Rankings set of companies in that index, analyzing the characteristics of those that disclose their racial and ethnic board diversity relative to those that do not.
With increased external pressure for greater board diversity from investors, financial exchanges, and government, it is clear that stakeholders are expecting corporations to include in their commitments to fighting systemic inequity by building diverse boards. Organizations like the Board Diversity Action Alliance argue that diverse leadership at the very top is necessary to make these commitments work. A growing number of shareholders are convinced – as we highlighted in last week’s chart, board diversity has constituted 9% of ESG proposals this proxy season.
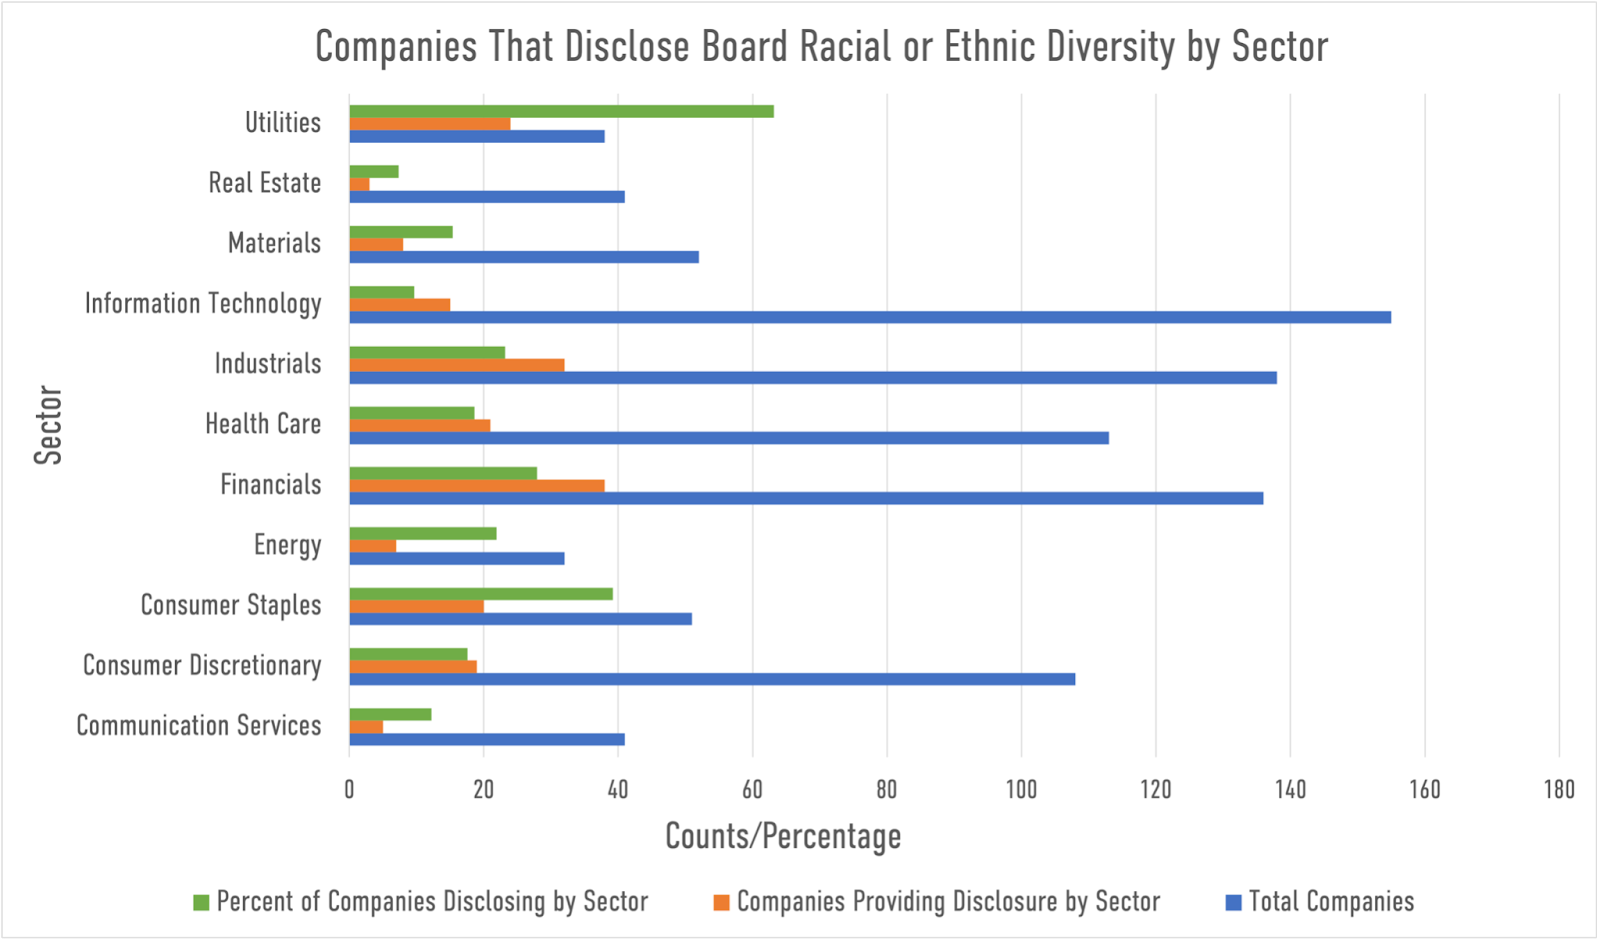
Our charts this week highlight the sectors that have provided disclosure of their boards’ racial and ethnic diversity relative to other sectors that did not disclose. Looking at the data, we see significant disclosure percentage-wise within the Utilities sector, with 63% of companies disclosing their board racial and ethnicity data, followed by 39% of companies in the Consumer Staples sector. It is worth noting that many of the country’s largest utilities companies operate in states with board disclosure requirements like California, Illinois, and New York.
American Electric Power (JUST Ranked #53) is an example, however, of a utilities company that has gone beyond a requirement for disclosure, with 50% of its board seats filled by directors who are not white men as of April 2021, as disclosed on its website.
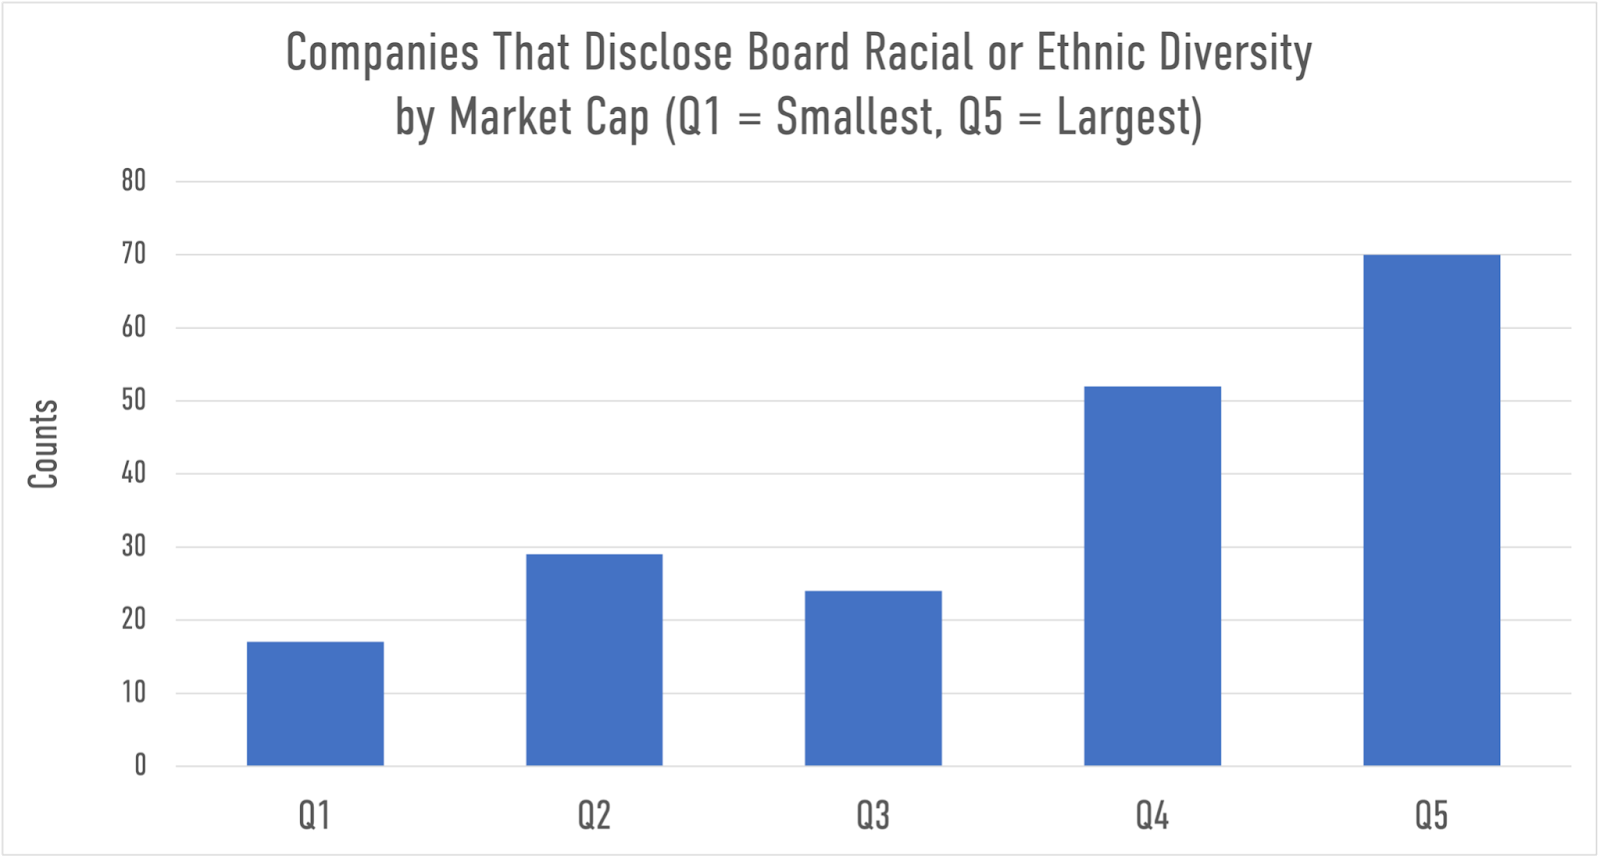
Looking at the breakdown of companies by market cap, we see that companies in the two largest market capitalization quintiles (Q4-5) are most likely to disclose relative to the three lower market cap quintiles (Q1-3).
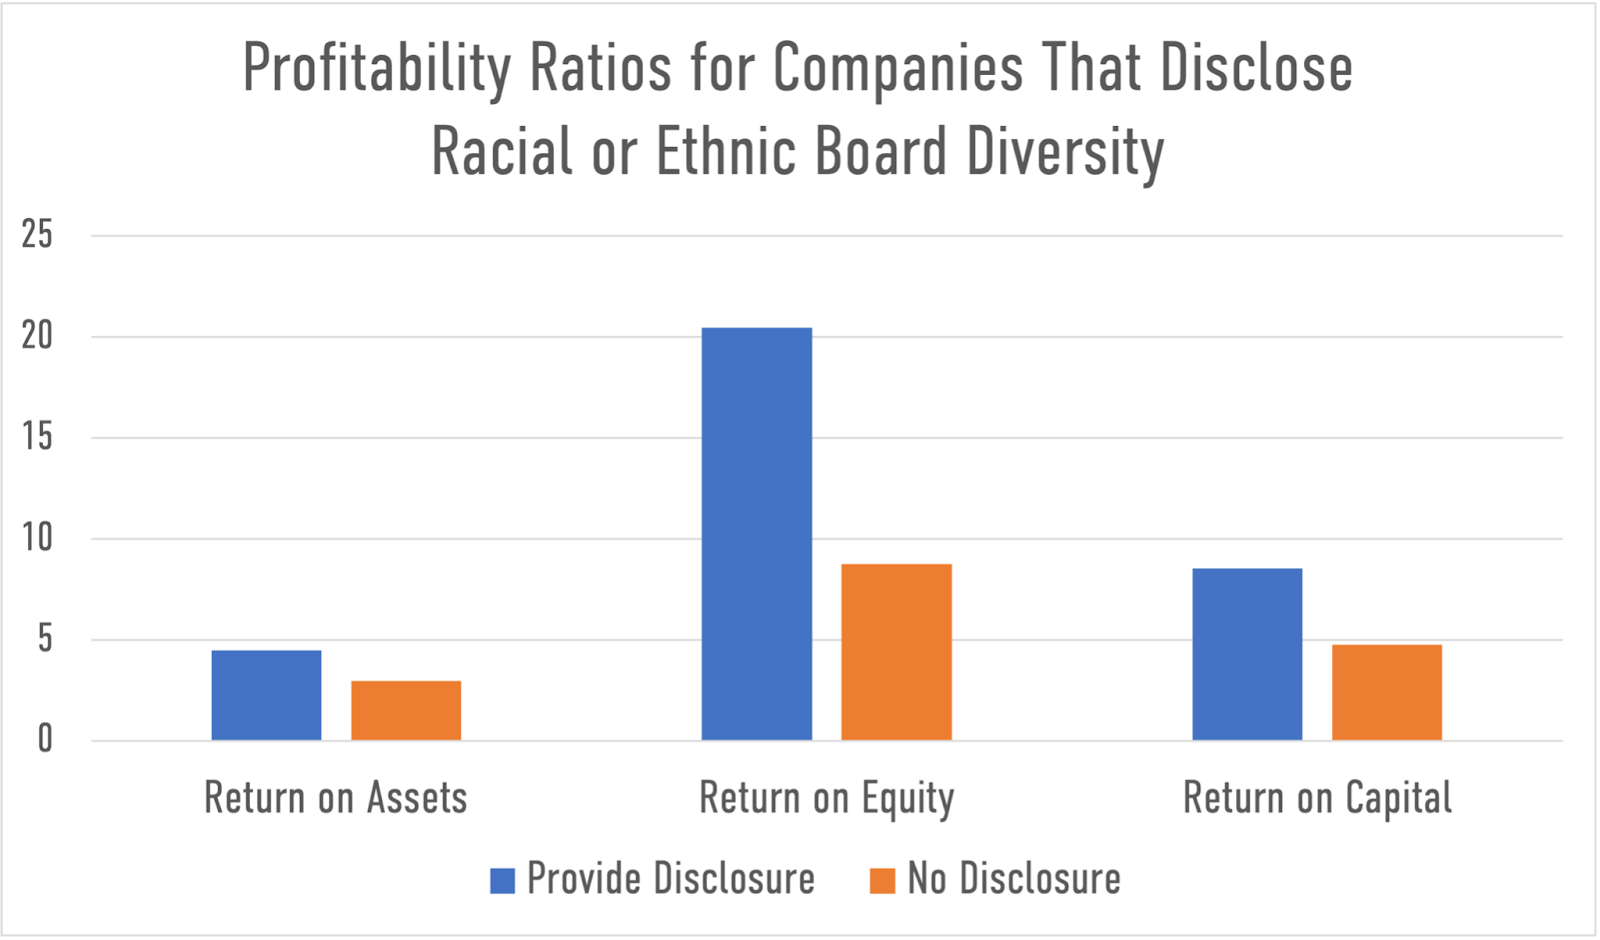
We also looked at profitability ratios, financial metrics analysts and investors use to measure and evaluate the ability of a company to generate profit relative to revenue, balance sheet assets, operating costs, and shareholders’ equity during a specific period. Companies commonly look for a high ratio, as this means the business is performing well by generating revenues, profits, and cash flow.
Looking at the data for Return on Equity (ROE), Return on Assets (ROA), and Return on Capital (ROC), we see that each is significantly higher for companies that disclose racial or ethnic board diversity data.
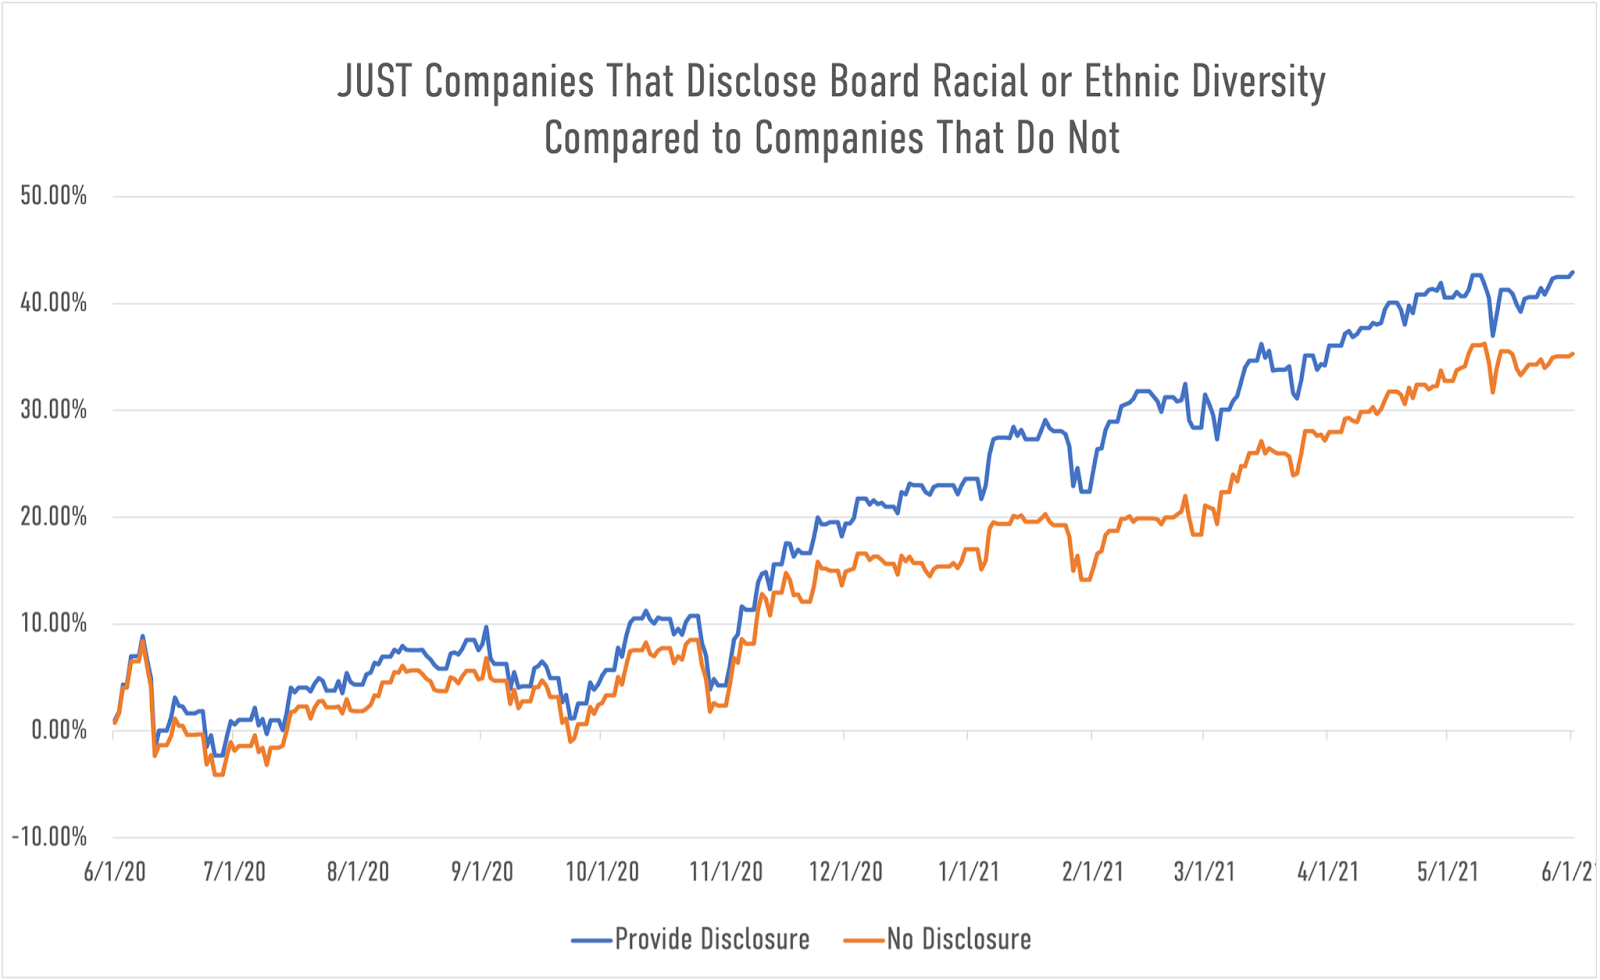
Lastly, we see a cumulative return of 42.9% over the trailing 12 months (as of 5/31/2021) from the 193 companies that disclose board diversity data by race and ethnicity, compared to the 735 companies that provide no disclosure at all, with a return of 35.3%.
Increased disclosure is one of the key first steps to advancing toward racial, ethnic, and gender diversity – whether in the boardroom or in the workplace, and as we explore in detail in our JUST Report published this week, there are clear indicators that pressure to release board composition data is not letting up. While companies have historically wanted to keep this data close, especially if they consider it unfavorable, our analysis indicates that at the least, there is no financial disincentive to releasing it and pursuing greater diversity in the boardroom.
If you are interested in supporting our mission, we are happy to discuss data needs, index licensing, and other ways we can partner, please fill out our request form to answer a few questions, and someone from our Investor Solutions team will reach out to you within two business days. Please send any requests to republish our Chart of the Week charts to Charlie Mahoney.