JUST Report
JUST Jobs Scorecard: Human Capital Disclosure Rising, But Still Plenty of Room for Improvement
- More Reports
- View all JUST Reports
Businesses and their employees are both navigating major human capital challenges at the moment. They run the gamut: An unpredictable job market, persistent inflation, heightened focus on workplace culture and employee engagement, pressures to lift wages and foster worker economic well-being, looming uncertainties posed by AI, the battle for talent, and much more. Critically, Americans across all ages, demographics, and geographies – as reflected in JUST Capital polling and focus groups – are united in recognizing the importance of addressing these challenges. And they consider prioritizing better jobs and outcomes for workers, and being transparent about company strategies and policies for doing so, as being essential elements of business leadership today.
“I would say offer really good retirement packages to boost morale and give your employees something to look forward to. I feel like a happy employee makes a happy company. I believe an employee that puts in 20 plus years should have some type of reward at the end for doing a job well done.”
–Male, 40-44, Moderate
“Having some human compassion for your employees, that you actually understand that sometimes kids are sick, spouses are sick, whatever, and you’ve got to take care of business at home.”
–Male 45-49, Conservative
Unfortunately, without a standard set of foundational job quality metrics or a clear definition of what good looks like, it’s not always apparent how company leaders can demonstrate their employee value proposition or evaluate where they should invest to improve performance.
Pathway to Quality Jobs
This context is why we’ve created the JUST Jobs Scorecard – a data-driven, interactive tool designed to help corporate leaders and stakeholders assess companies’ job quality performance and disclosure.
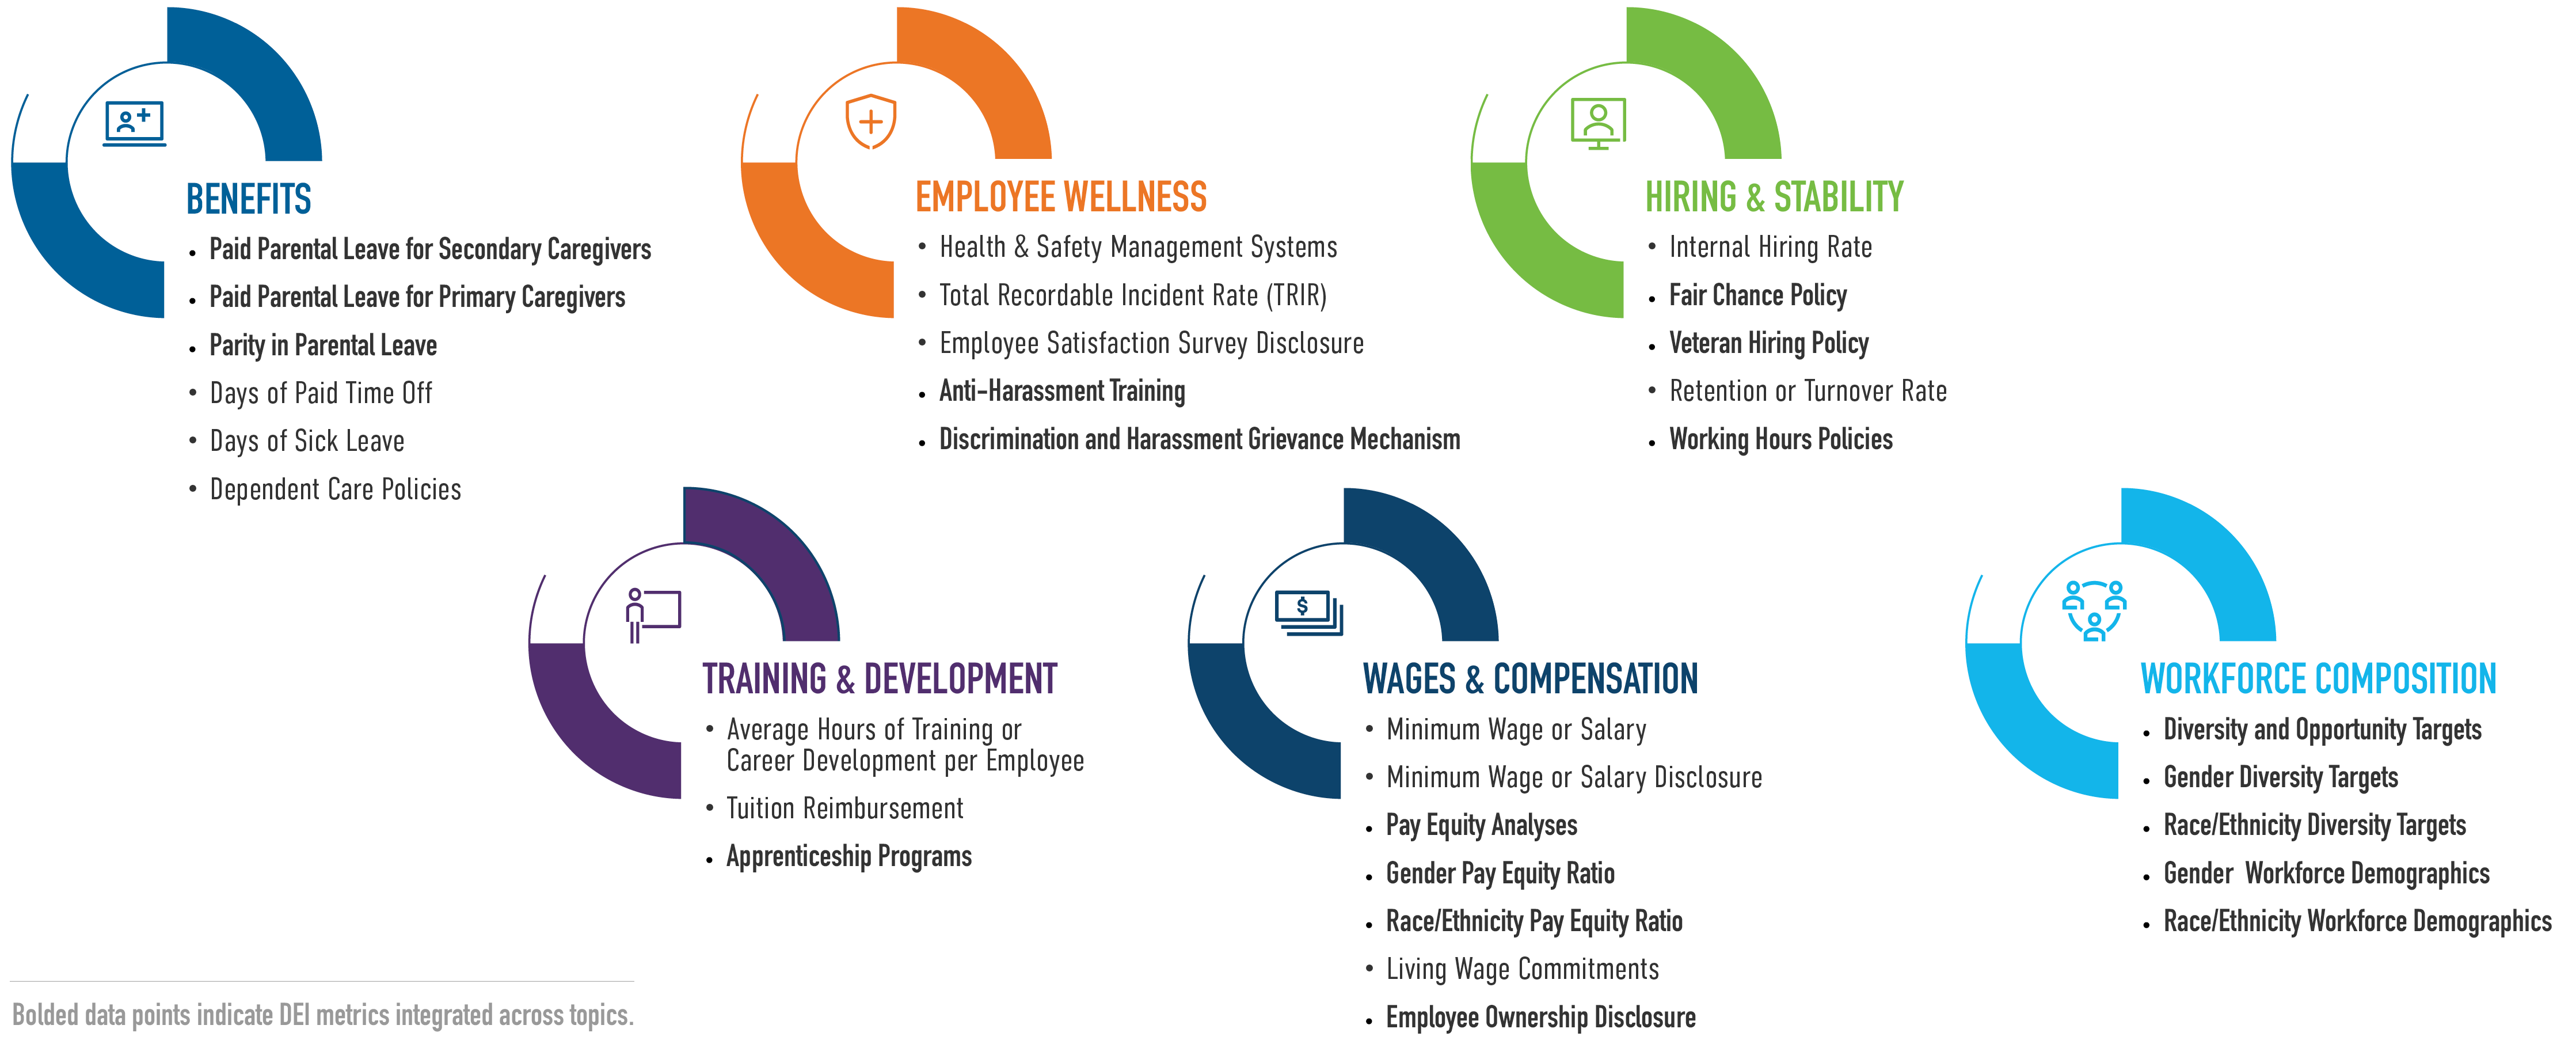
Following extensive corporate testing and review, the Scorecard focuses on 31 foundational job metrics, offering company leaders a roadmap toward understanding their current performance on job quality issues. However, the Scorecard doesn’t end with a performance snapshot; instead, it provides a path to improvement through clear performance thresholds and benchmarks against industry and Russell 1000 peers. We first released a pilot version of the Scorecard to company leaders in 2023 and have updated the 2024 JUST Jobs Scorecard based on their feedback and input from experts.
A Growing Disclosure Landscape
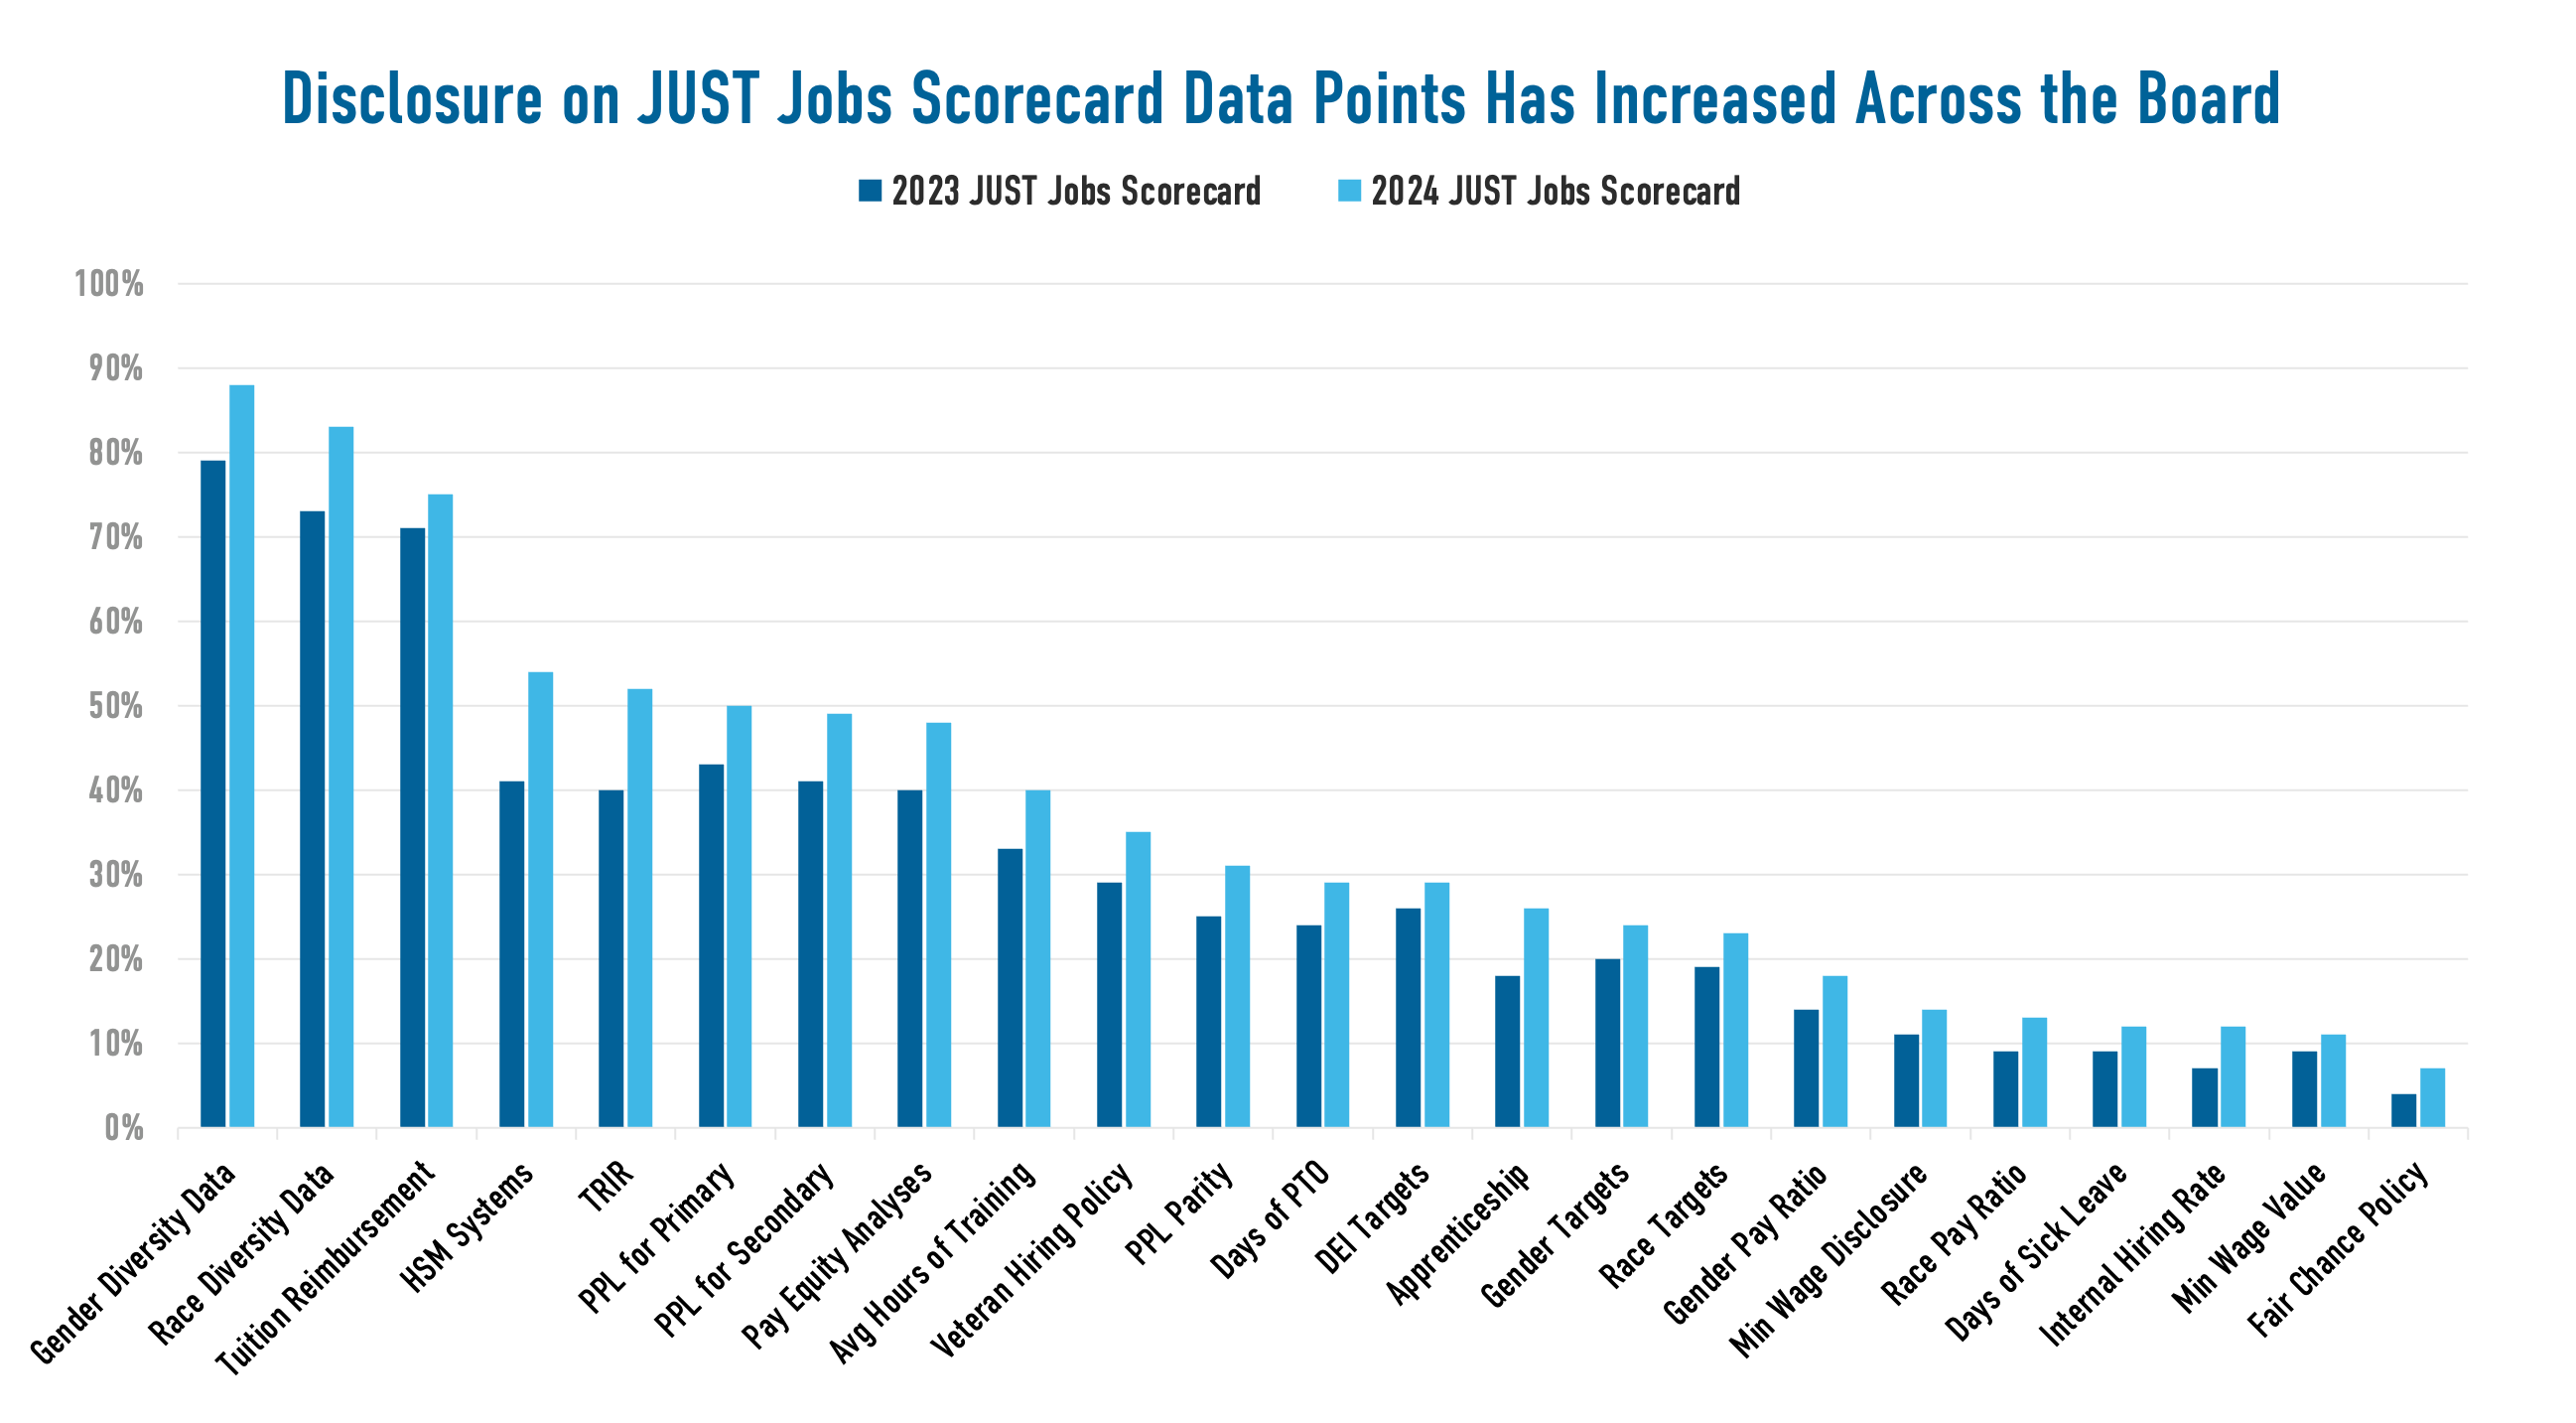
When we released our findings from the 2023 JUST Jobs Scorecard last March, they pointed to the opportunity for companies to improve their leadership in emergent disclosure. In short, disclosure on job quality metrics was and generally remains limited. While that remains broadly true, we were interested to find in the 2024 JUST Jobs Scorecard that companies are beginning to make strides, with disclosures increasing for every data point featured in both iterations of the Scorecard.
These data point improvements played out in improved overall performance as well. While America’s largest companies have more work to do to improve transparency around some key job quality data points, overall performance on the 2024 JUST Jobs Scorecard speaks to noticeable improvement since the 2023 pilot version of this tool. More than one-fourth of companies (256 companies, or 27.3% of all scored companies) have moved from the Beginner category (taking early steps towards transparency, overall scores between 0 and 0.99) into the Explorer category (making progress with limited disclosure and practice, an overall score between 1 and 1.99).
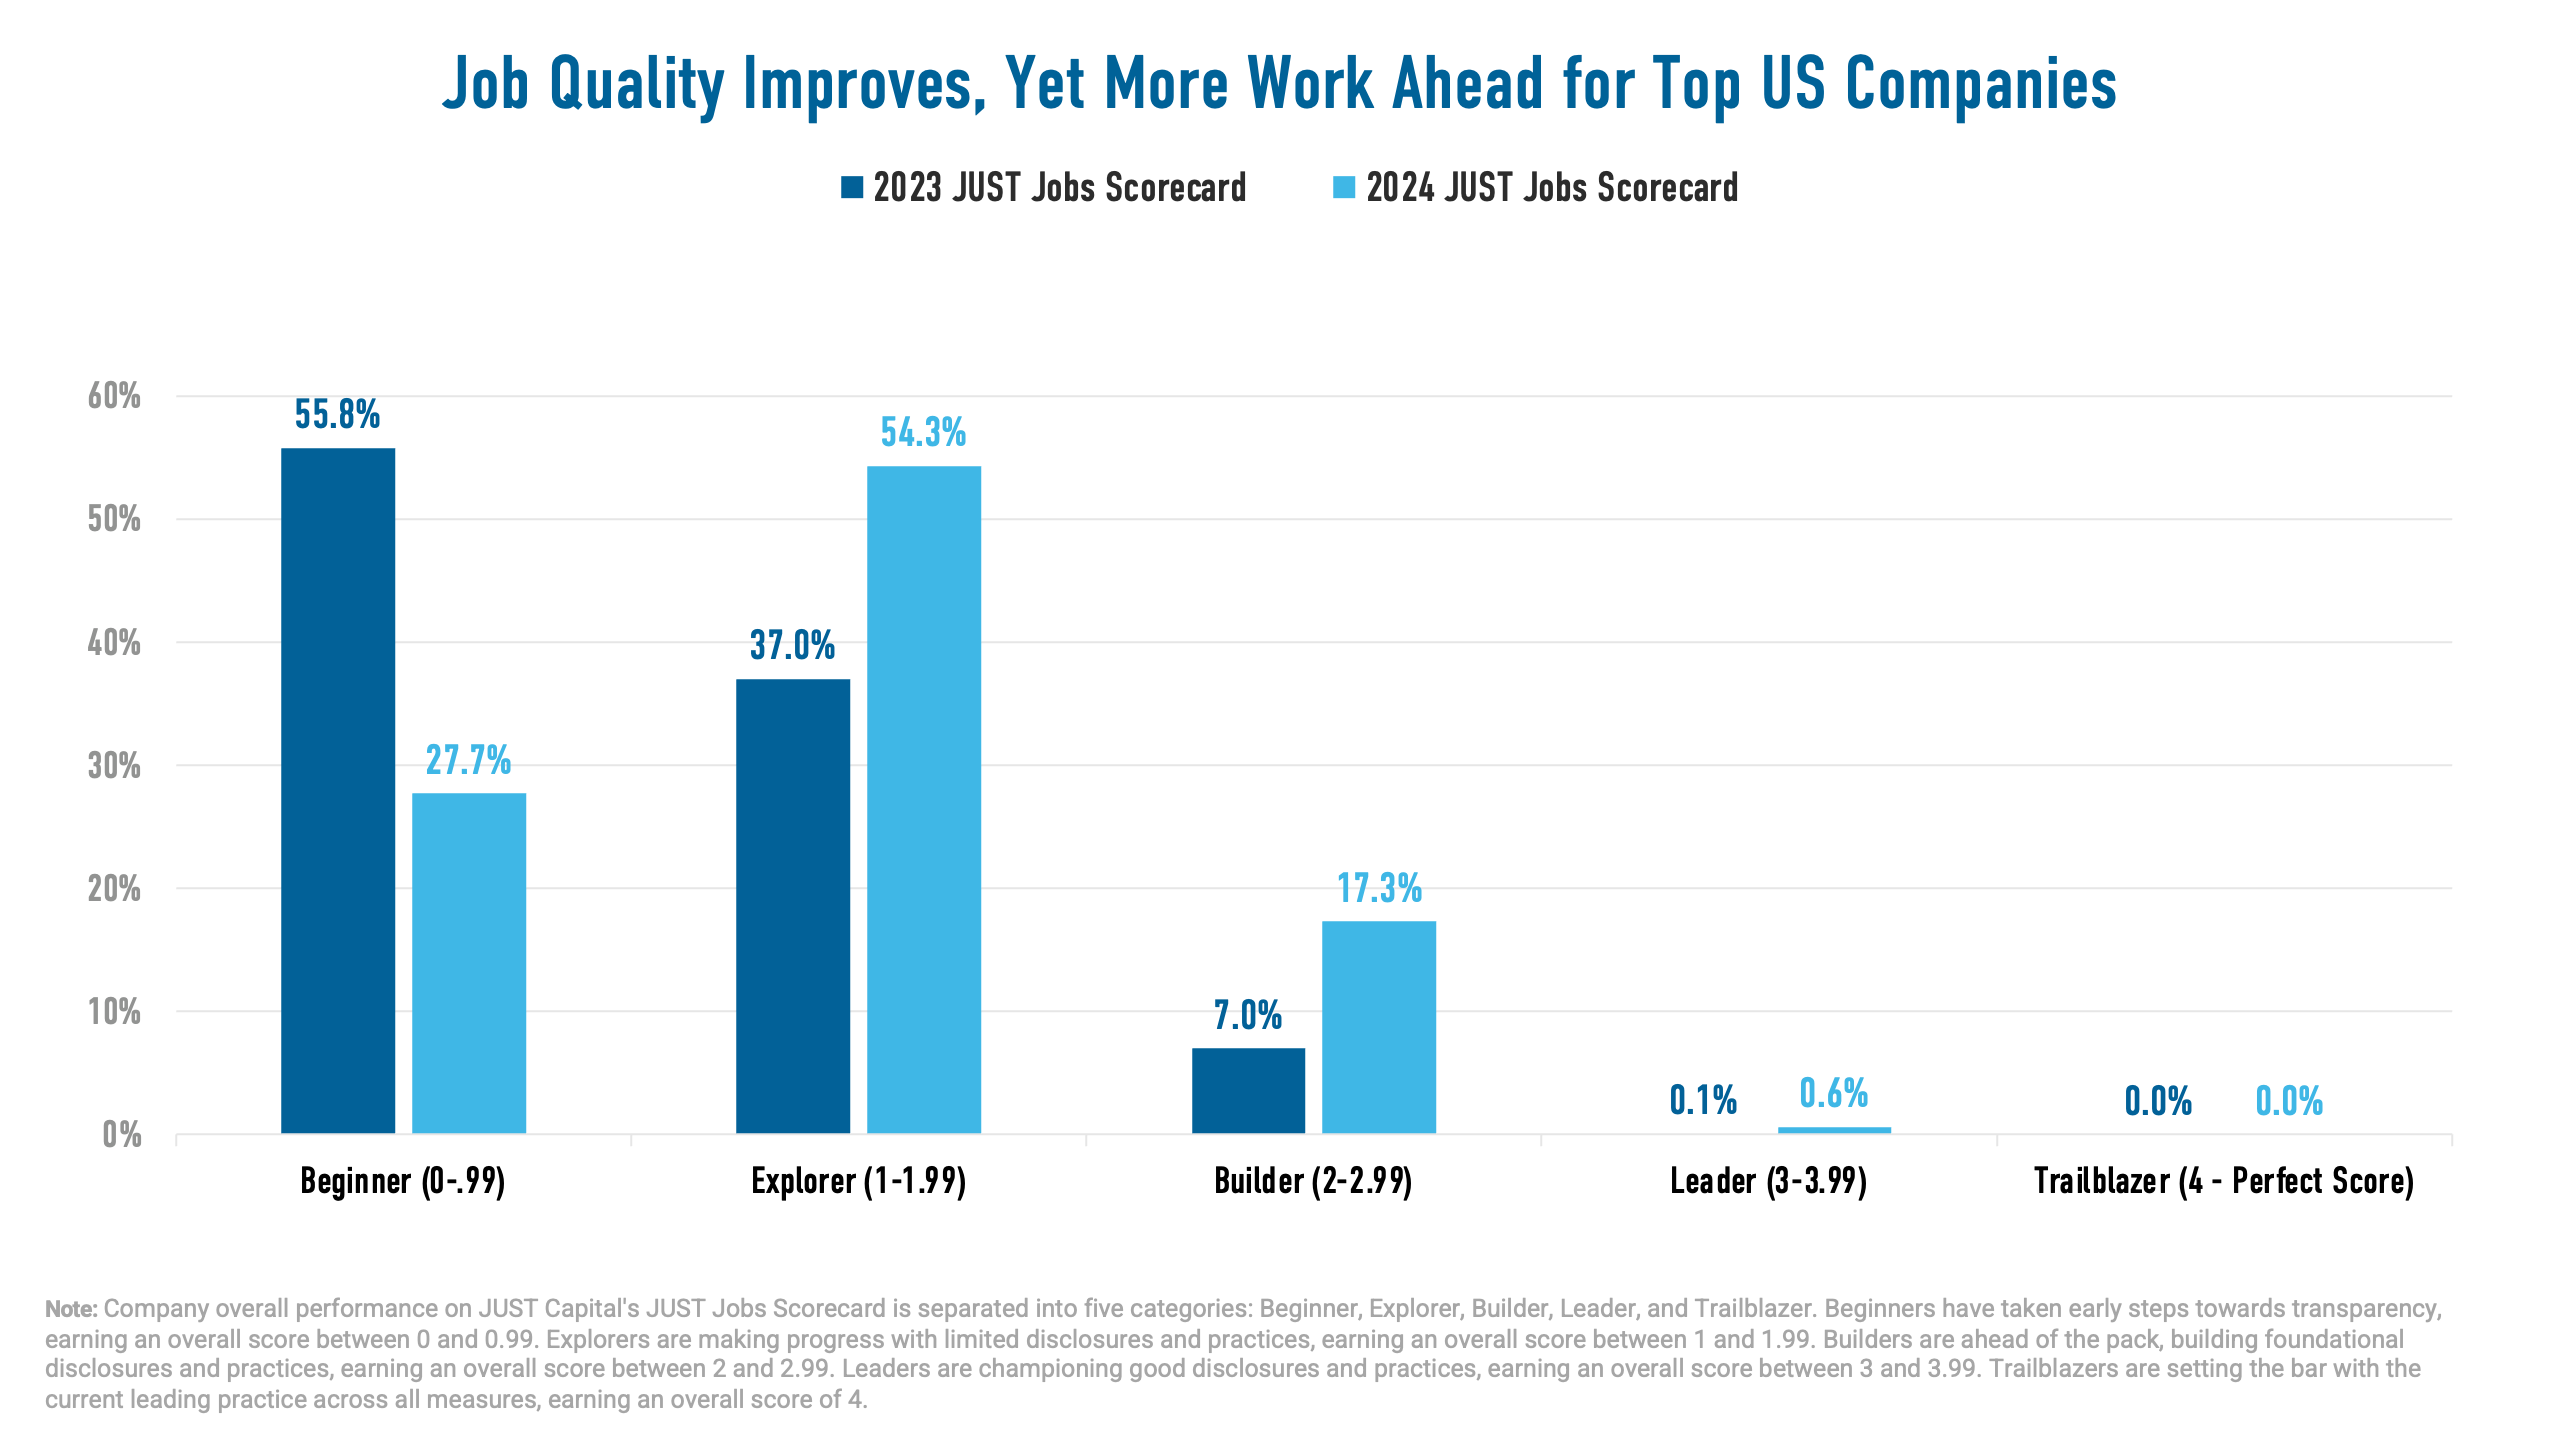
We’re also highlighting six companies as Leaders on the Scorecard (championing good disclosures and practices, an overall score between 3 and 3.99 out of 4), a designation only one company earned on the 2023 pilot Scorecard. Dig into the JUST Jobs Scorecard for each of this year’s Leaders here:
The good news is that America’s largest employers still have plenty of opportunity to become leaders in the space, as few companies currently exhibit strong performance across all key components of job quality. The Beginner and Explorer categories are the most heavily populated, and no company earned the Trailblazer designation, reserved for those who set the bar with the current leading practice across all measures with an overall score of 4. Additionally, there is ample opportunity for companies to choose which of the six topic areas most closely align with their own workforce leadership path, and to invest in that area as it relates to their specific business and operational strategy.
On balance, this upward shift in companies’ overall scores suggests that, in aggregate, corporate America is gradually moving toward greater transparency and improved performance on job quality metrics.
Although the Scorecard includes Overall Performance categories, it intentionally focuses on performance and pathways to improvement on six topic areas and across all 31 of its metrics. The Scorecard’s topic areas mirror the progress, room for improvement, and emergent leadership by a few companies seen in the Overall Performance outcomes. No topic area boasts extensive disclosure, and variation does exist. For example, on both the Benefits and Wages & Compensation topics, a single company scores a four by meeting leading disclosure and performance thresholds, which significantly lags other topic areas. Sixty-one companies score a perfect four on Employee Wellness, forty-nine do the same in Training & Development, and the Workforce Composition topic indicates thirty-seven leading companies. The variation across topics indicates that companies can prioritize a particular area within job quality as a connection point to their own business reality for disclosure, investment, improvement, and leadership.
Companies also have room to improve on the type of data disclosed. Most job quality metrics focus on the existence of a given policy in the workplace, as opposed to the quality of that policy or its effectiveness and impact on workers. Metrics that track quality, effectiveness, and impact tend to have lower disclosure rates than those reporting a policy’s existence. As corporate transparency on job quality advances, companies will lead by providing relevant details about their employee offerings, the standards they aim to achieve, and/or the outcomes they are having for workers.
Scorecard Metrics: Inconsistent Disclosure
The Scorecard’s metrics tell the same story. There’s a great deal of variation in company transparency, with some data points reaching above 80% disclosure rates and many falling below 20%. Disclosures across more than half of all data points in the Scorecard fall below 40%, as illustrated in the chart below:
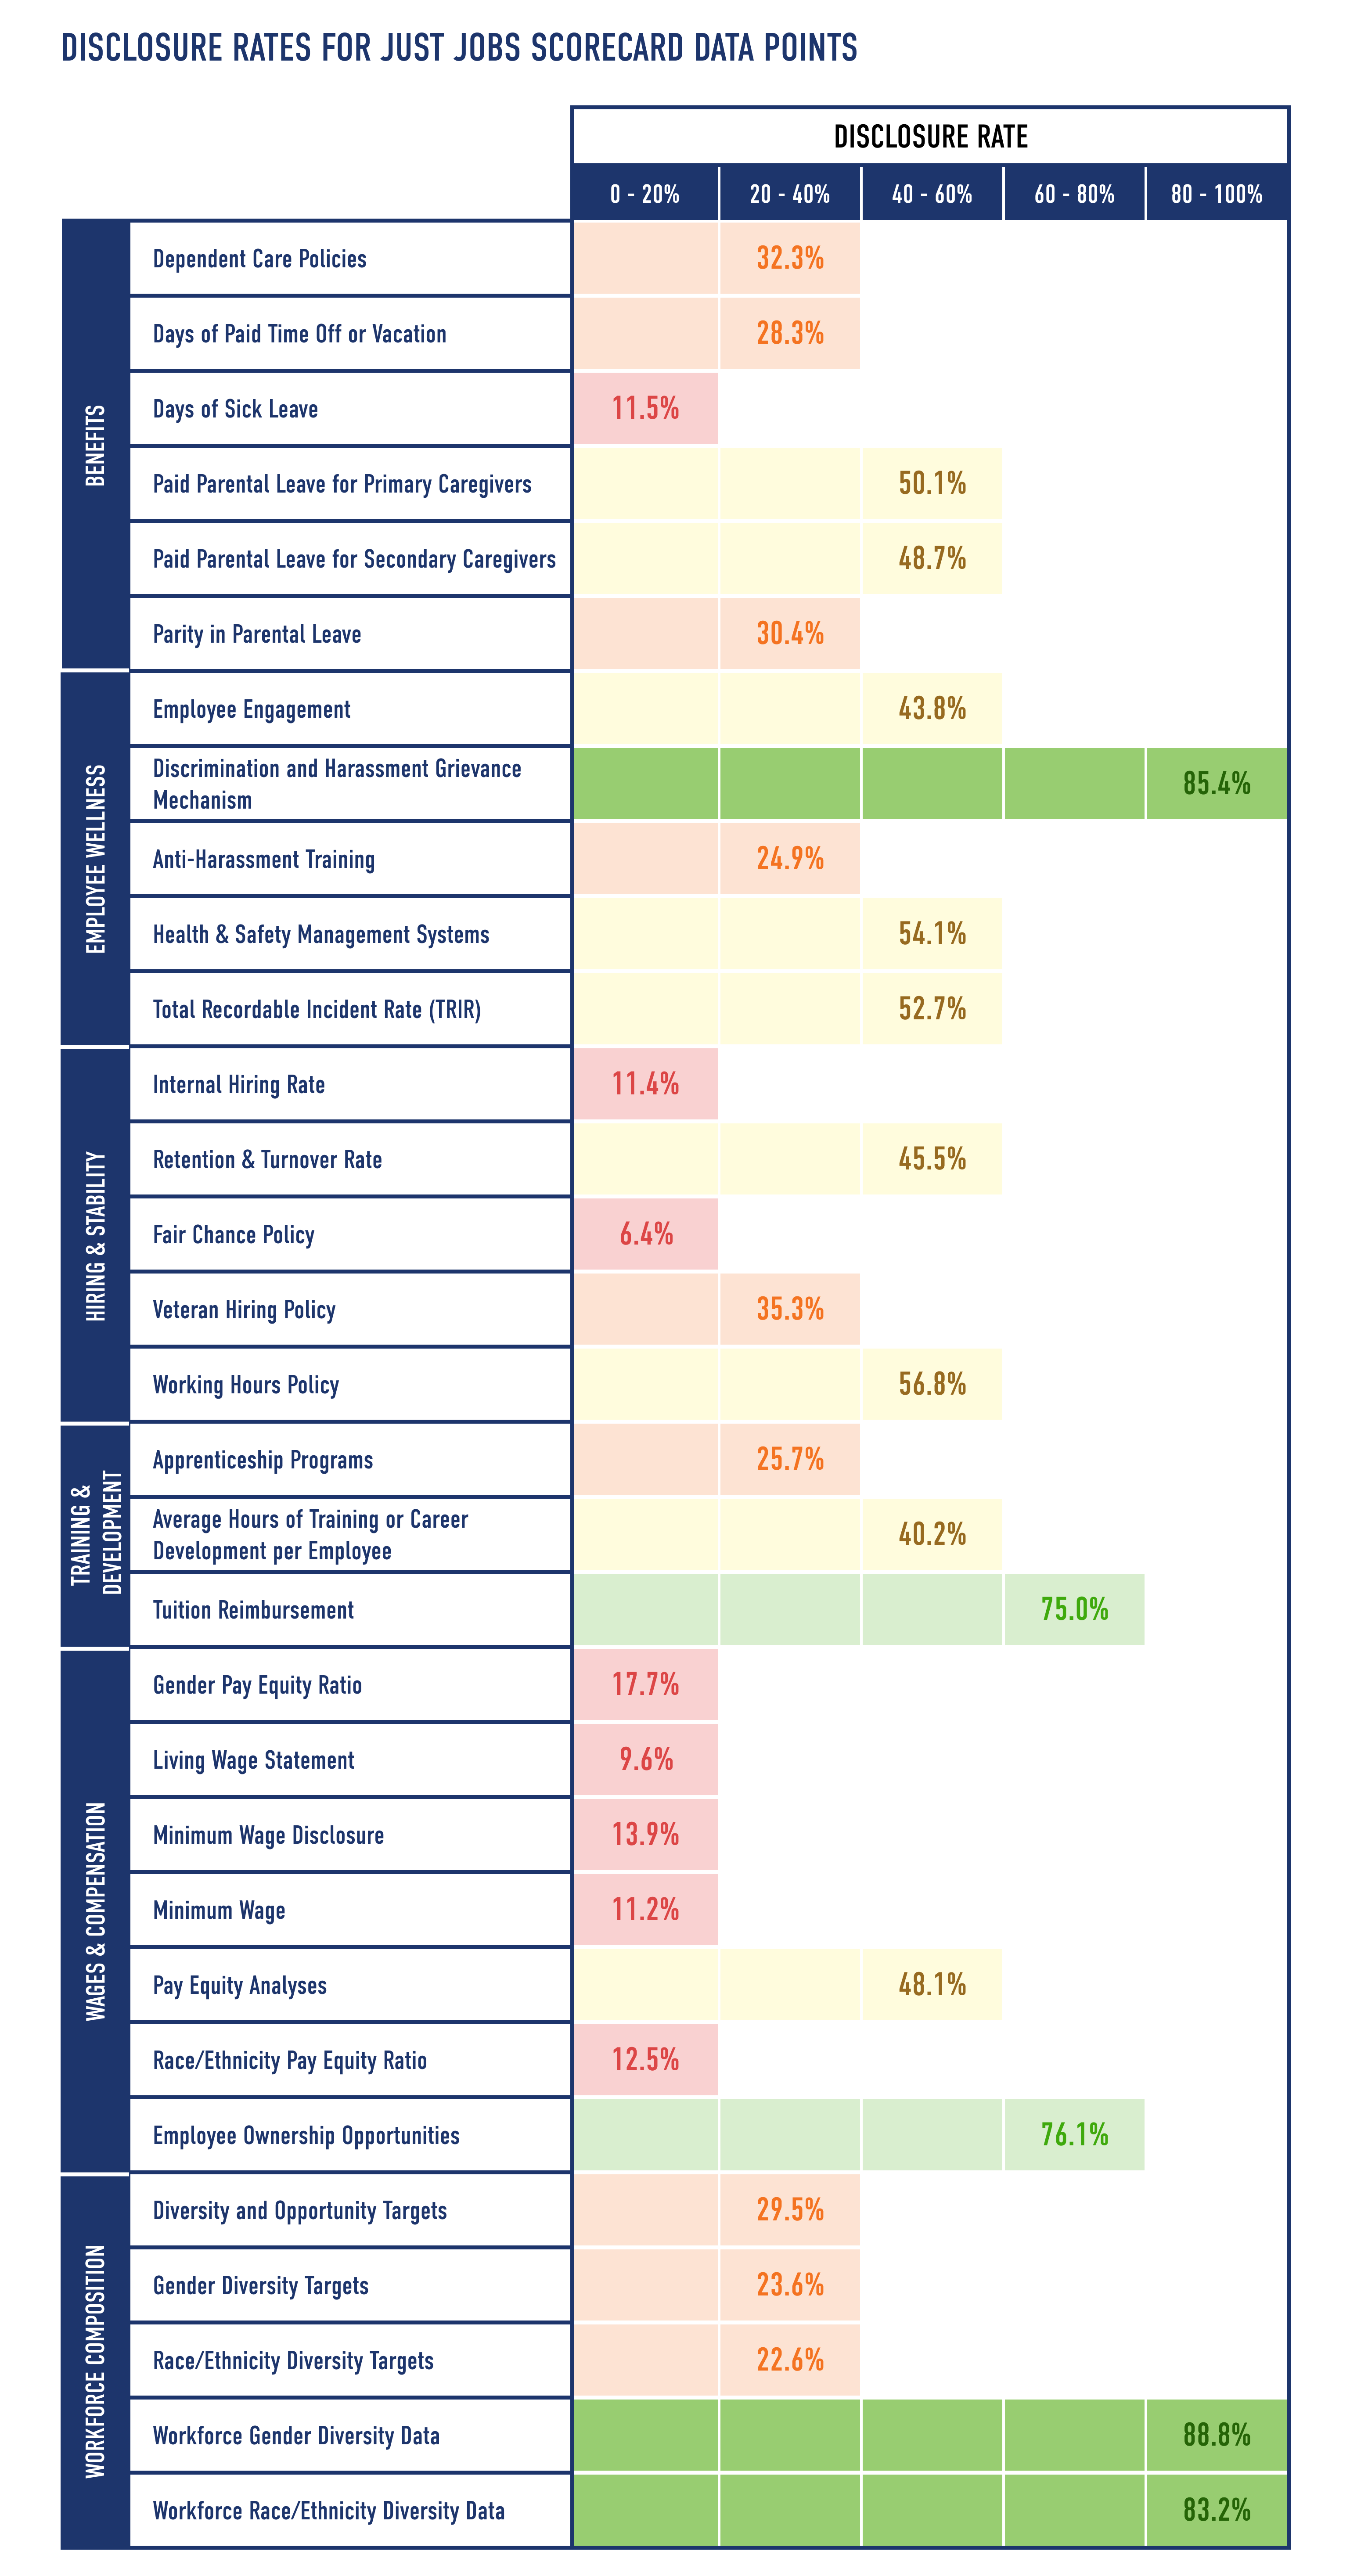
A few of the data points we track in the Scorecard stand out for their high levels of disclosure. This group includes:
- Workforce Gender Diversity Data: 89% of Russell 1000 companies disclosing.
- Discrimination and Harassment Grievance Mechanism: 85% of Russell 1000 companies disclosing.
- Workforce Race/Ethnicity Diversity Data: 83% of Russell 1000 companies disclosing.
- Employee Ownership Opportunities: 76% of Russell 1000 companies disclosing.
- Tuition Reimbursement: 75% of Russell 1000 companies disclosing.
Other data points signal significant increases in the number of companies disclosing since the 2023 Scorecard:
- 13% more companies disclosed information about their approach to worker wellness:
- Health & Safety Management Systems: increased from 41% to 54%
- Total Recordable Incident Rate (TRIR): increased from 40% to 53%
- Companies were more likely to be transparent about their demographic diversity and how they prioritize equitable pay for all employees:
- Workforce Race/Ethnicity Diversity Data: increased by 10 percentage points (from 73% to 83%)
- Workforce Gender Diversity Data: increased by 10 p.p. (from 79% to 89%)
- Pay Equity Analyses: increased by 8 p.p. (from 40% to 48%)
- More and more companies are recognizing the importance of transparent paid parental leave programs for all caregivers:
- Paid Parental Leave for Secondary Caregivers: increased by 8 p.p. (from 41% to 49%)
- Paid Parental Leave for Primary Caregivers: increased by 7 p.p. (from 43% to 50%)
- In today’s increasingly difficult hiring market, companies are investing in their people and creating pathways into the workforce:
- Apprenticeship Programs: increased by 8 p.p. (from 18% to 26%)
- Average Hours of Training or Career Development per Employee: increased by 7 p.p. (from 33% to 40%)
While we’re seeing disclosure uptick across the board, some metrics most prioritized by the American public remain infrequently disclosed.
“A wage you can actually live on. A wage that you can pay your bills and you’re not trying to take out payday loans or get extra credit cards or sell something that you have extra of or anything like that. You should be able to have enough money in the bank to pay your rent.”
–Female 45-49, Moderate
A few of the data points with the lowest disclosures in our Scorecard include:
- Only 11% of companies disclose their exact minimum wage or salary, and only 14% disclose any information about their minimum wage. This issue has remained the number one priority for the American public as inflation rises and the cost of living increases continue to skyrocket.
- Only 6% of companies disclose a fair chance policy, including programs or policies that companies can implement to hire more or lower barriers for formerly incarcerated individuals.
- Only 11% of companies disclose an internal hiring rate, a key metric for measuring opportunities for advancement at a company.
Job Quality Drives Success & Benefits Shareholders
The business case for leadership on human capital remains a powerful incentive for many. By investing in quality jobs and publicly highlighting this fact, companies will be better positioned to attract and retain employees who increasingly choose companies that implement practices that better support their needs and priorities. They will be more effective in engaging workers to boost productivity, operating quality, innovation and leadership. They will strengthen culture and competitive advantages.
“And I do notice when the morale is up, workmanship is up, creativity is up. People want to do more when they’re treated great. I just see that on a day-to-day basis.”
–Female 45-49, Liberal
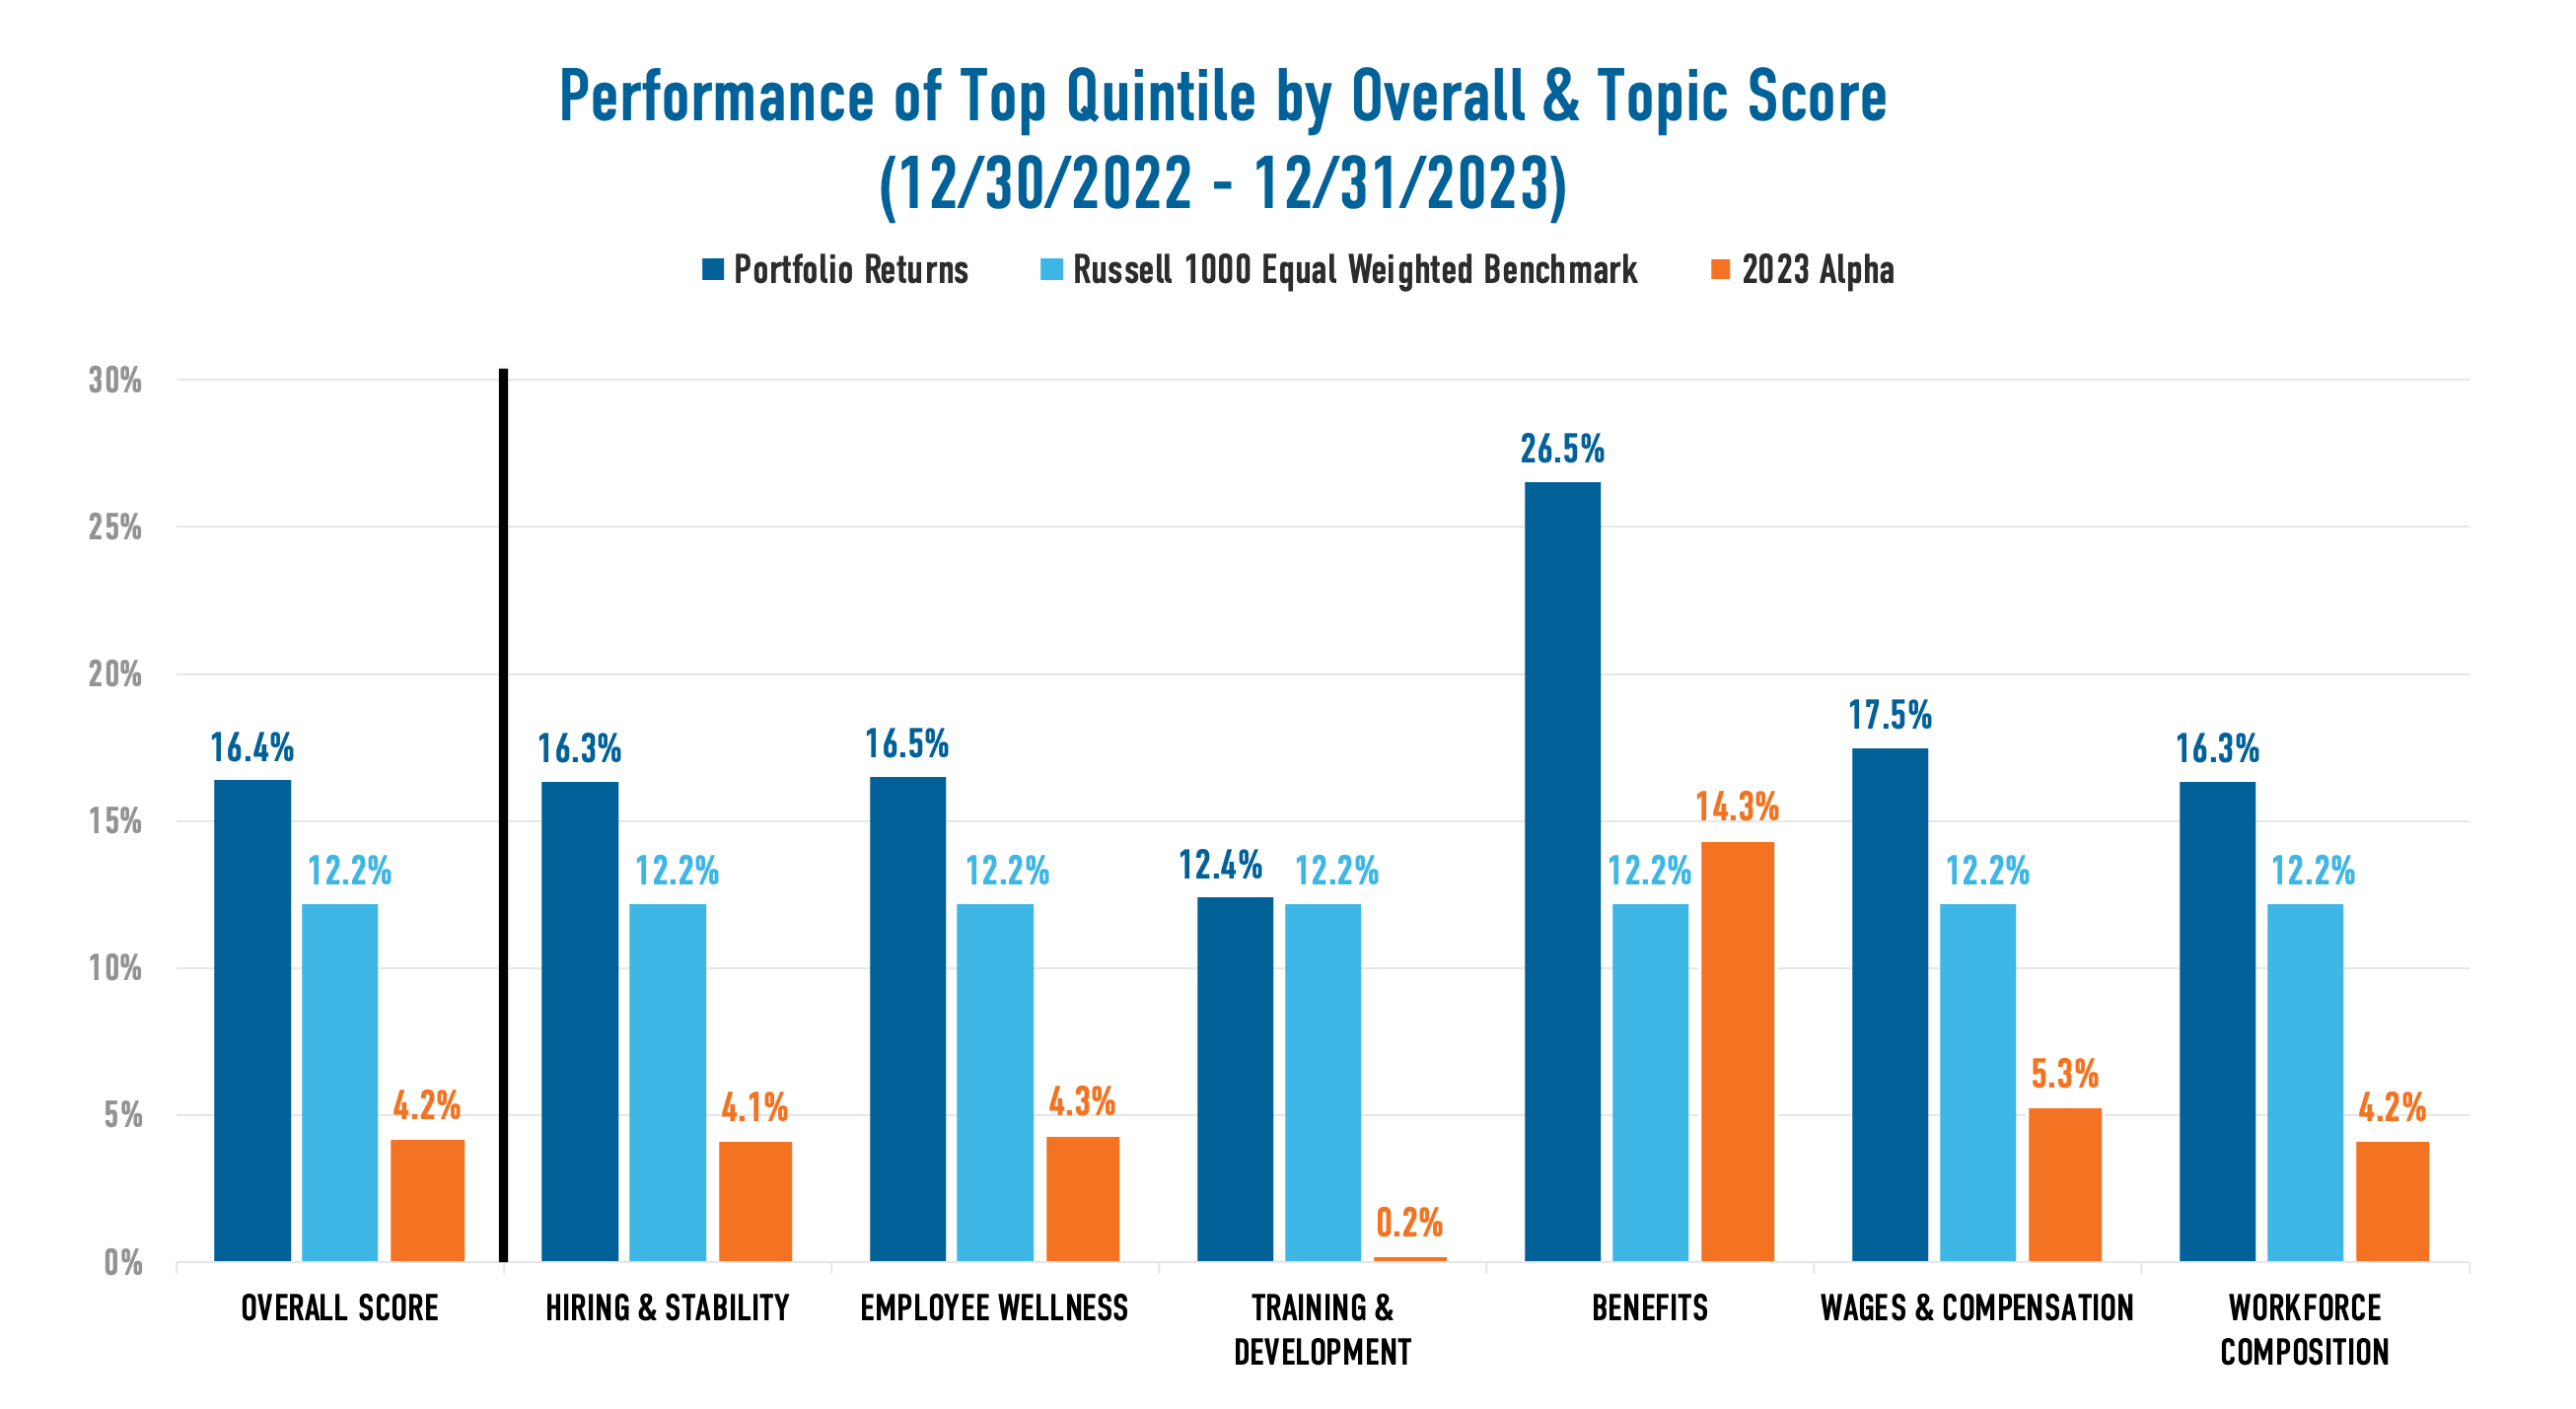
The connection between human capital and market performance is also increasingly critical. The substantial momentum that investors and market regulators have created around the disclosure of human capital metrics, coupled with the very real ‘war for talent’ that companies face, have placed a premium on companies establishing themselves as top employers that can directly impact their bottom line.
To explore this, we examined the market performance of the highest-scoring companies within the top quintile, as determined by their JUST Jobs Scorecard Overall Performance Score and Topic Area Scores. Compared to the benchmark, we found that Scorecard leaders demonstrated substantially superior performance across nearly every Scorecard category, with the difference especially striking for companies that excelled in the Benefits and Wages & Compensation categories.
As company leaders prioritize creating quality jobs for their employees, the JUST Jobs Scorecard is useful for benchmarking performance, identifying strengths and areas for improvement, overcoming challenges and determining action steps. The Scorecard is one aspect of JUST’s overall strategy for driving worker well-being and improved stakeholder performance for America’s largest publicly traded companies. Our annual Rankings of America’s Most JUST Companies and the Worker Financial Wellness Initiative show more of our work.
The JUST Jobs Scorecard was built to support companies on their path toward improved disclosure and performance in providing quality jobs. To unpack your company’s performance, learn more about implementing the Scorecard, and connect with JUST resources, peer cohorts, programmatic Initiatives, and partners, please reach out to corpengage@justcapital.com.
Building the JUST Jobs Scorecard
After previewing a beta version of the Scorecard to a smaller audience of companies and subject-matter experts for feedback and user testing in 2023, we created the improved 2024 JUST Jobs Scorecard, encompassing the feedback and user testing learnings we gathered.
The updated 2024 JUST Jobs Scorecard has undergone several enhancements to more comprehensively capture the aspects of a “good job.” These improvements include the revision of new data points, bringing the total up to 31, and Topic Areas to more holistically assess the different elements of job quality.
In response to feedback from subject-matter experts and practitioners, we revised the scoring logic of some data points, more details of which can be found in our methodology. Finally, we also expanded our recognition of companies who lead the pack on JUST Jobs by creating a “Top Performer” designation, recognizing the companies who have achieved a perfect score in any given topic area, in addition to our existing recognition of industry leaders.
Bringing together what we have learned from expert feedback and the updated data, we are proud to present this collection of insights from the 2024 JUST Jobs Scorecard on the progress of America’s largest companies and the evolving landscape of job quality data.