
On November 30th the JUST U.S. Large Cap Diversified Index (JULCD) marked its second anniversary of live trading. JULCD is based on JUST Capital’s unique methodology to rank the largest U.S. companies on the issues that matter most to the American public. JULCD offers diversified U.S. equity exposure and is generally compared with broad U.S. equity benchmarks, as well as Environmental, Social, and Governance (ESG) tilted indexes. It includes the top 50% of JUST-ranked companies within each of the 10 broad ICB industries.
We take this opportunity to assess JULCD’s performance since inception from the perspectives of return, risk, and relative returns compared with ESG-focused peers. While JUST Capital’s methodology include 36 aspects of just business behavior, we also highlight here a few of its ESG attributes, within each of the three ESG pillars. The next reconstitution of the JULCD will take place on December 21st, based on JUST Capital’s 2018 rankings release that will take place December 10th.
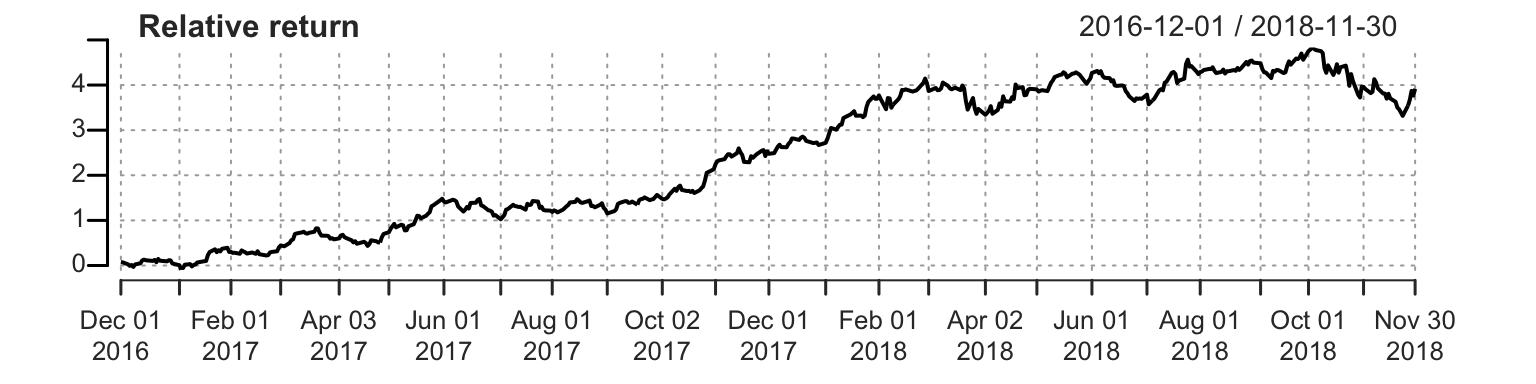
First we examine JULCD’s performance compared with its parent universe, the Russell 1000. As shown below, since its inception JULCD has returned 33.8%, or 3.9% more than the Russell 1000 over the same two-year period. This is equivalent to 1.7% annualized outperformance.
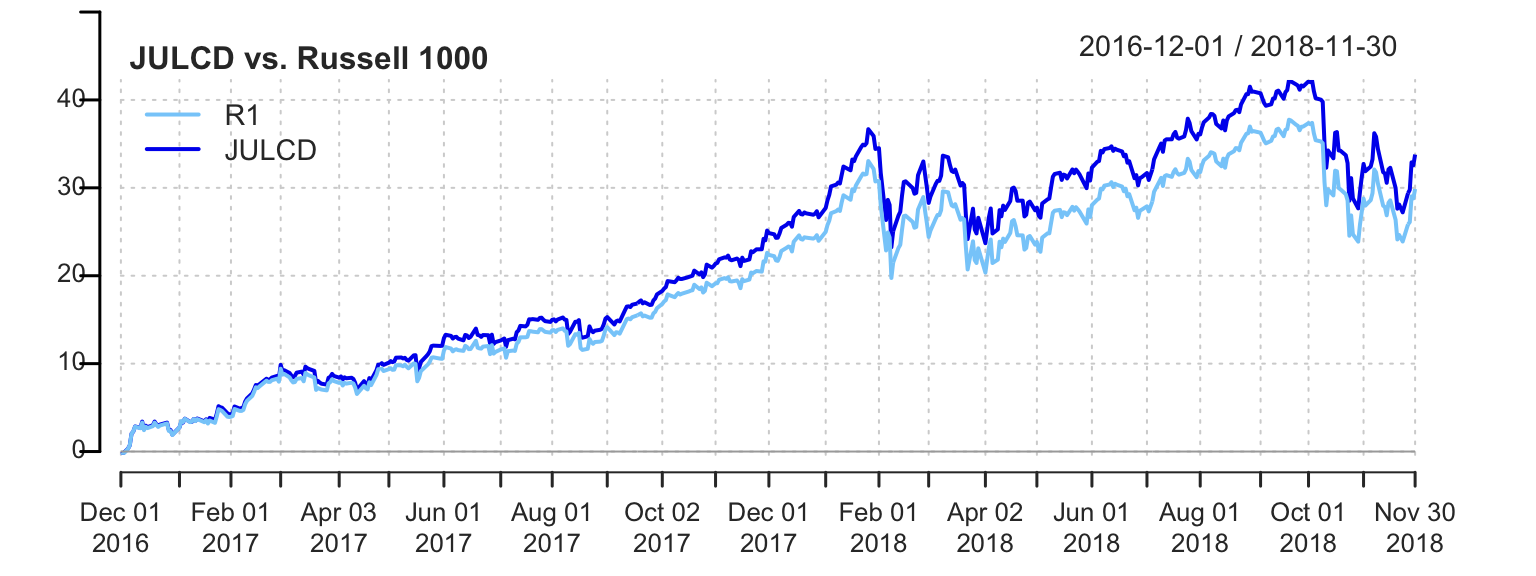
| JULCD | Russell 1000 | Difference | |
| Cumulative Return | 33.8% | 29.9% | 3.9% |
Note: Nov 30, 2016 – Nov 30, 2018 returns.
From a volatility perspective, the JULCD’s annualized standard deviation has been 11.9%, or 0.3% higher than the Russell’s. The resulting Sharpe ratio of 1.32 is higher than the Russell’s over this period.
| JULCD | Russell 1000 | Difference | |
| Annualized Return | 15.7% | 14.0% | 1.7% |
| Annualized Std Dev | 11.9% | 11.6% | 0.3% |
| Annualized Sharpe | 1.32 | 1.2 | 0.12 |
Note: Nov 30, 2016 – Nov 30, 2018 returns.
From a benchmark risk perspective, the JULCD’s beta at 1.02 has been close to the Russell’s, while its tracking error has been a moderate 94 basis points. Overall, its Information Ratio of 1.8 indicates that the Index has produced a proper reward for the risk taken.
| Annualized Tracking Error | 0.94% |
| Information Ratio | 1.81 |
| Beta | 1.02 |
Note: Nov 30, 2016 – Nov 30, 2018 returns.
The appendix to this note decomposes the JULCD’s outperformance by industry, as well as by Fama-French factors. We find that JULCD’s outperformance has been fairly broad based, adding value in seven out of 10 industries and flat in the other three. The factor shows that over two-thirds of the outperformance can be attributed to alpha that can not be explained by size, value, investment, profitability, momentum, or market factors.
We also compare JULCD’s performance with that of the major passive diversified large- and mid-cap U.S. ESG-focused benchmarks as well as the Russell 1000. We examine 2-year, 1-year, and 2018 year-to-date performance. We find that JULCD was first out of twelve over two years, and third place over one year as well as year-to-date.
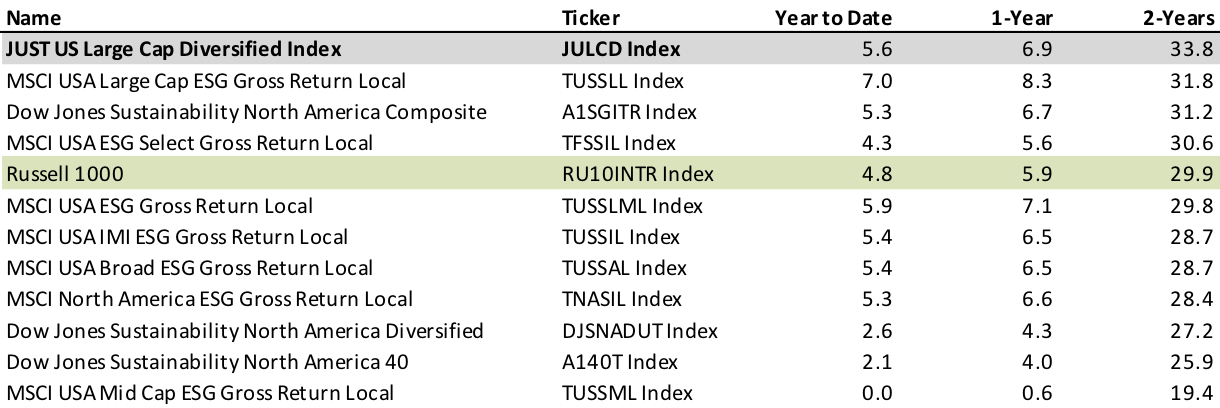
Source: Bloomberg, as of November 30th, 2018. Sorted by descending two-year total return.
Like most passive benchmarks, the JULCD’s methodology does not explicitly incorporate valuation. We construct a weighted valuation comp table vs the Russell 1000 to identify if there are any major discrepancies versus the overall Russell 1000 and by industry based on P/E, P/CF, P/B, and dividend yield. As shown, JULCD’s overall valuation is in-line or slightly below the Russell 1000’s, indicating that at this time the market is not requiring a premium valuation to hold companies in the top 50% of JUST Capital’s rankings.
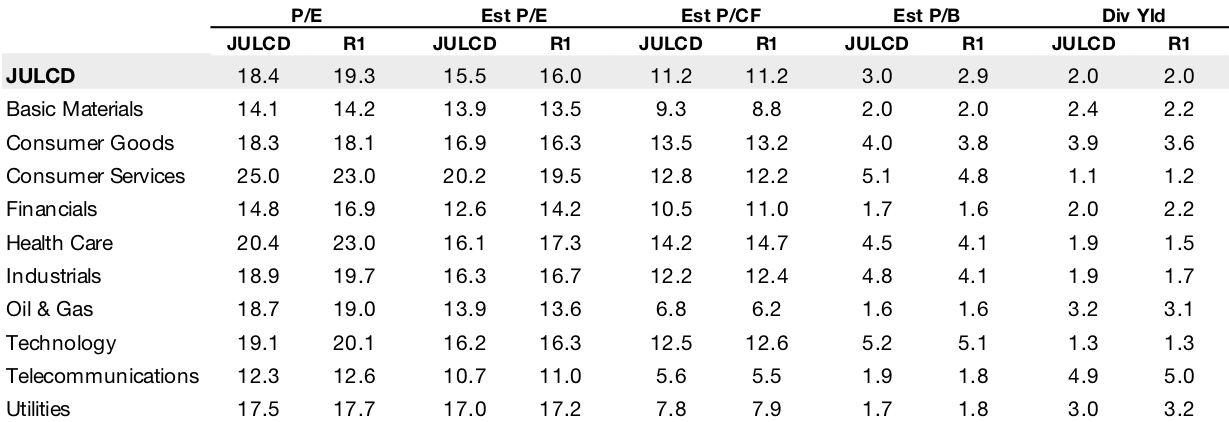
Source: Bloomberg as of 11/30/2018.
Thus far we’ve focused on examining JULCD’s performance along traditional investment metrics, and in what follows we review its performance on a handful of ESG metrics, chosen from each of the three ESG pillars. We believe that this only scratches the surface of JULCD’s performance on the aspects of just business behavior we evaluate.
Starting with environmental performance, we examine JULCD’s footprint on emissions, resource use, and environmental compliance. Compared with Russell 1000 companies excluded from the JULCD index, on average JULCD constituents produce 45% fewer GHG emissions, consume significantly fewer resources, recycle nearly 7x more, and face a fraction of the environmental fines.
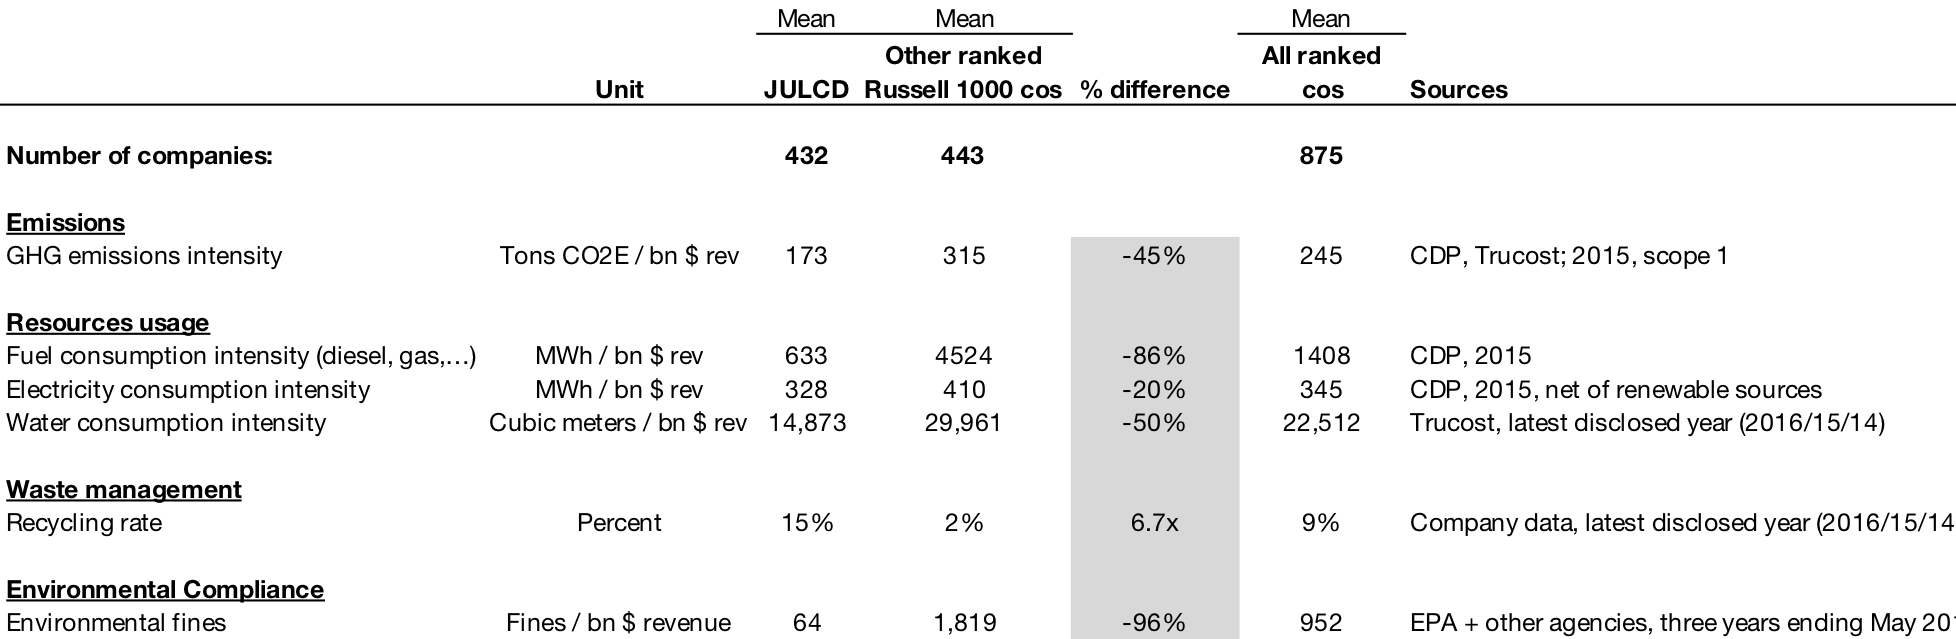
Notes: Based on JUST Capital 2017 rankings data. Companies with missing GHG intensity are imputed by industry mean. Companies with missing fuel or electricity intensity are not included in above means. Companies with missing water intensity are imputed by industry mean. Companies with missing recycling rate are assigned a value of zero. Companies with no environmental fines are assigned a value of zero.
Equal opportunity workplace policies are a critical component in JUST Capital’s framework and incorporate not basing any personnel decisions on race, religion, gender, age, ethnicity, sexual orientation, disability status, or other such characteristics. In this section we focus on a third-party examination of how JULCD performs on gender equality. Based on data from Equileap, As You Sow has produced gender equality scorecards for investors. We show below the scorecard for a fund based on JULCD which shows solid performance compared to the overall market as well as its peers.
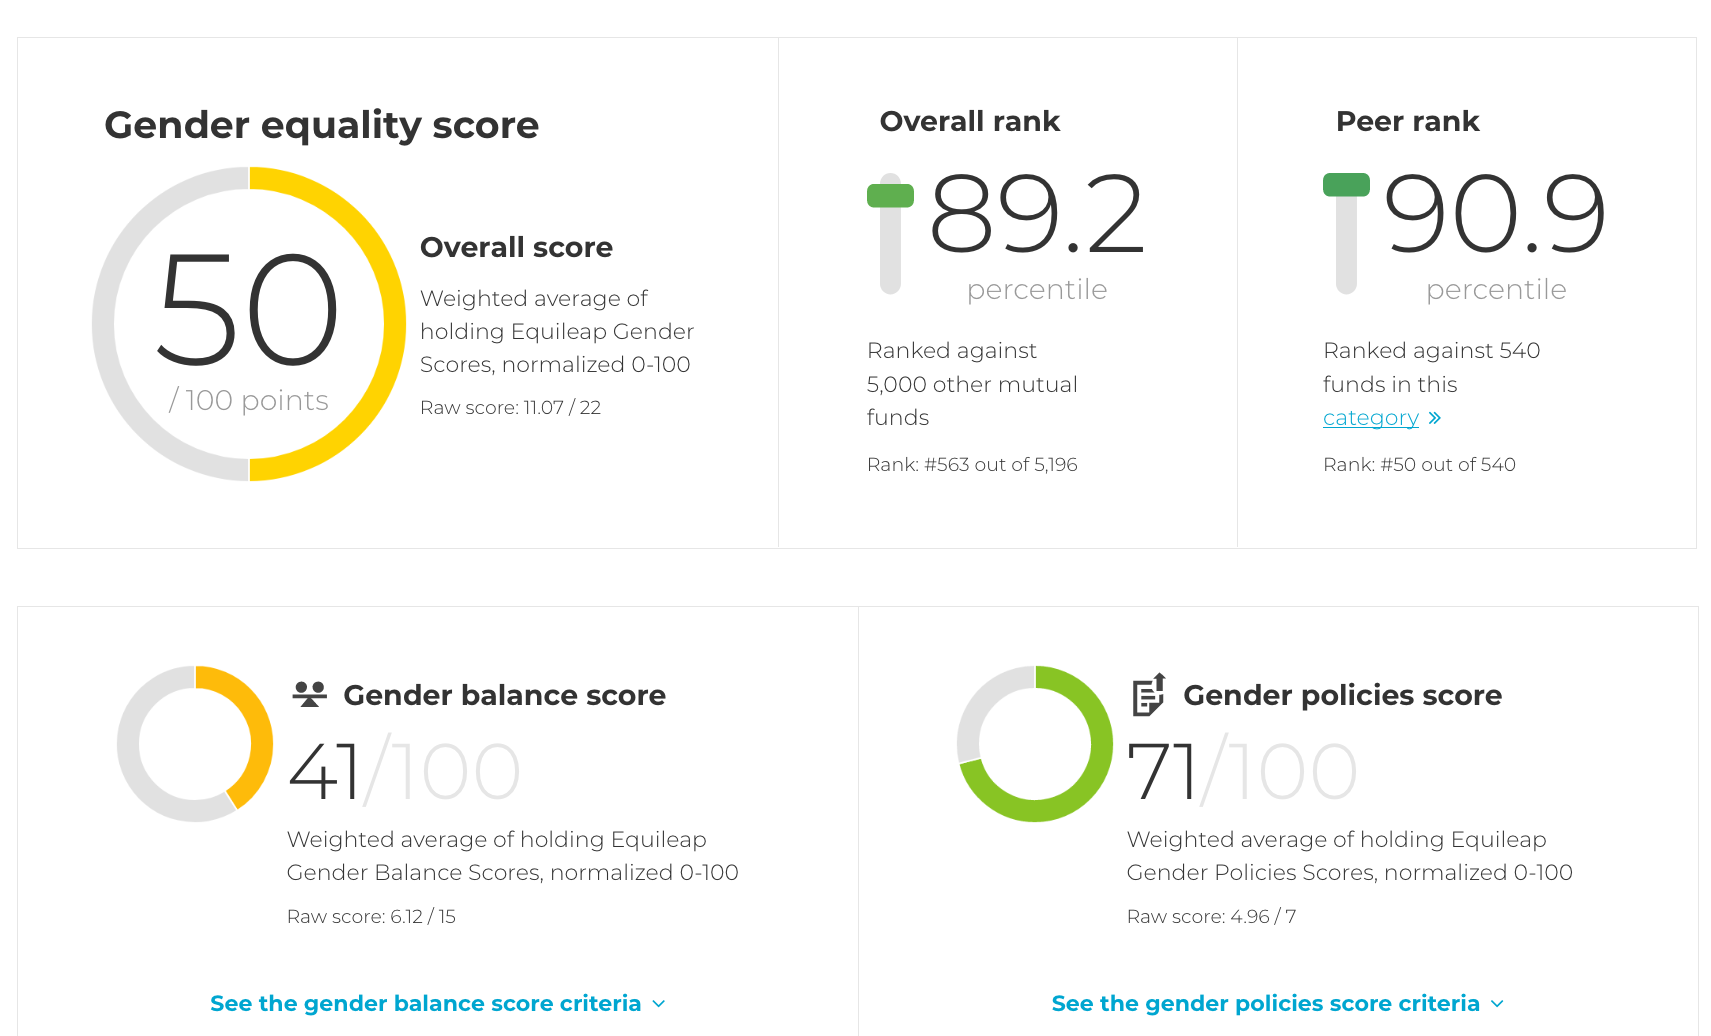
Source: genderequalityfunds.org
Within the governance pillar we examine an oversight metric collected by JUST Capital. The metric examines for every ranked company whether the board has a committee responsible for issues measured by JUST Capital such as environmental, health and safety, and social matters, and whether the committee has a regular, formal, schedule to review such issues. This is a general indication of the priority the company places on such issues. We find that 38% of JULCD constituents have this oversight, while 23% of excluded companies do not. While that 38% is clearly not yet consistent with the priorities of the American public, it is noticeable higher than for the excluded companies.
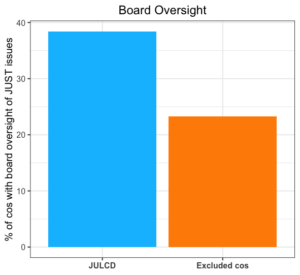
Note: Assessment of whether there is a board committee with responsibility for one or more JUST business behaviors, excluding widespread and routine issues.
We’ve reviewed JULCD’s performance since inception from the perspectives of return, risk, comparables, valuation, attribution, and select ESG metrics. We’ve found evidence of idiosyncratic alpha with moderate tracking risk, peer-leading performance, and strong environmental, social, and governance attributes. Please see our JUST Alpha research for additional analysis. We expect to continue to update this work following the JULCD’s December 21st reconstitution.
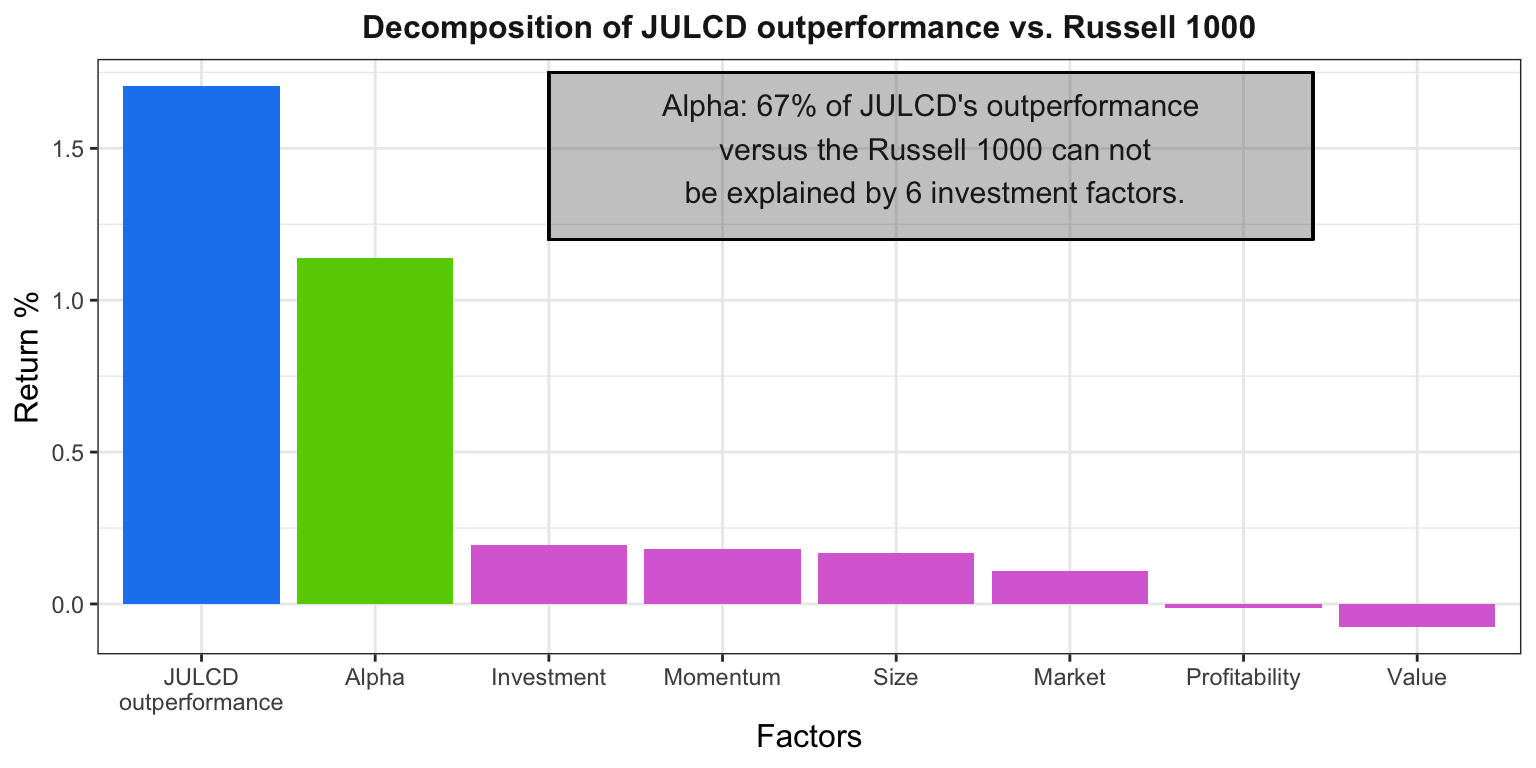
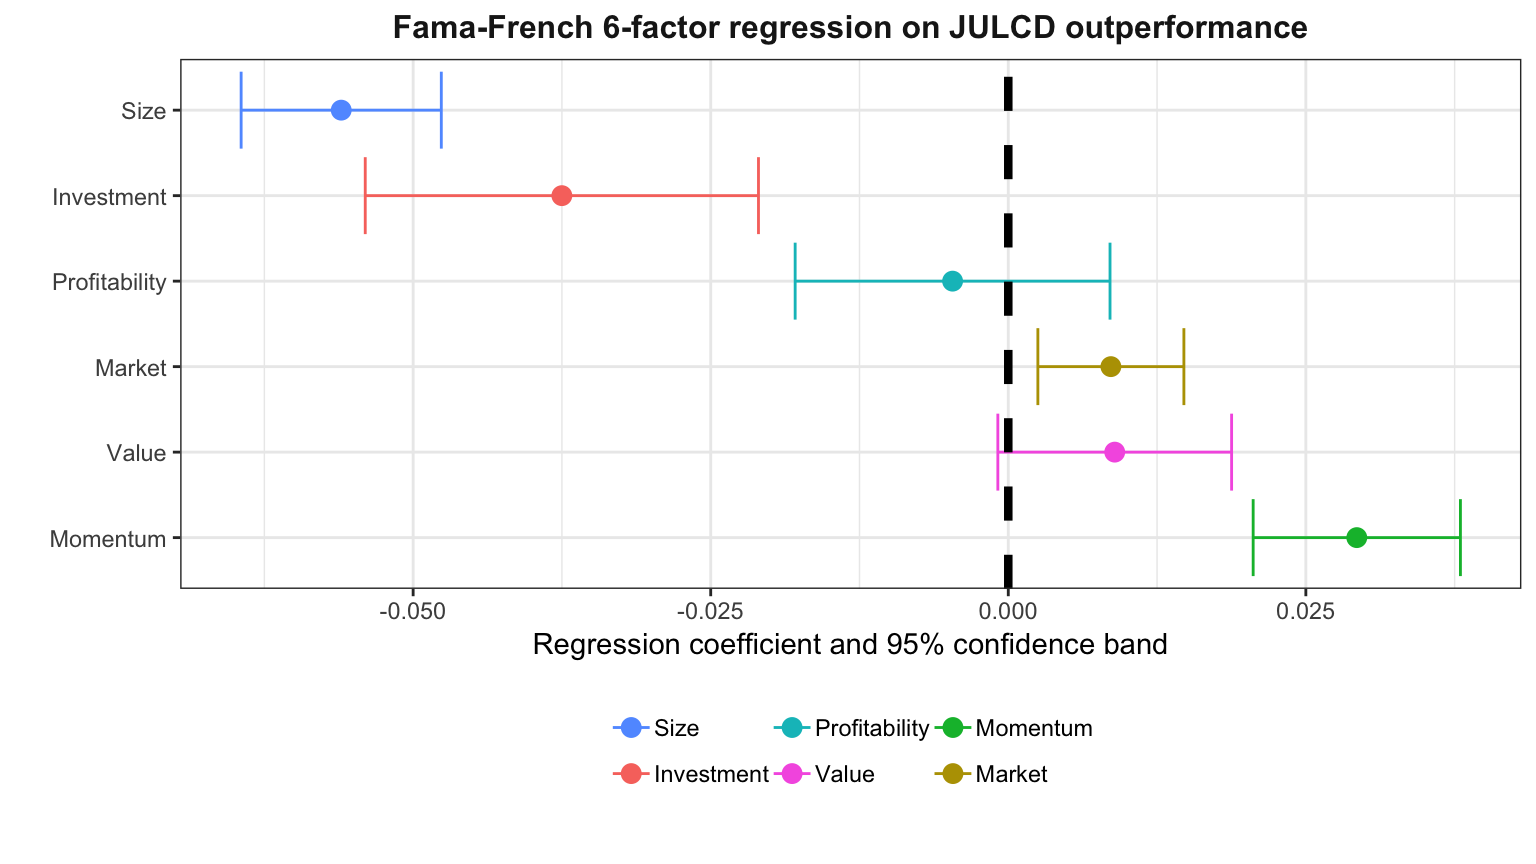
In order to identify the source of the JULCD’s outperformance we conduct both factor and industry attribution analyses. First, we run a momentum-augmented 6-factor Fama-French decomposition through October 2018 (latest available data). We also conduct an industry attribution analysis.
As the charts below show, we find that over two-thirds of JULCD’s outperformance can not be explained by any of the six factors and may be considered alpha. The main factor exposures in the JULCD’s outperformance can be attributed to exposure to larger companies, companies with above-average investment rates, and positive momentum, The outperformance can not be explained by exposure to the value or profitability factors, and very little to market (or beta) exposure.
As expected, the industry attribution analysis shows that all of JULCD’s outperformance is derived from stock selection, not industry allocation, consistent with JULCD’s industry-neutral construction methodology. Furthermore, the source of outperformance is also diverse across industries, with outperformance in 7 out of 10 industries, and in-line performance in 3 out 10. This suggests that JULCD’s outperformance is not overly dependent on stocks selection within any particular industry.
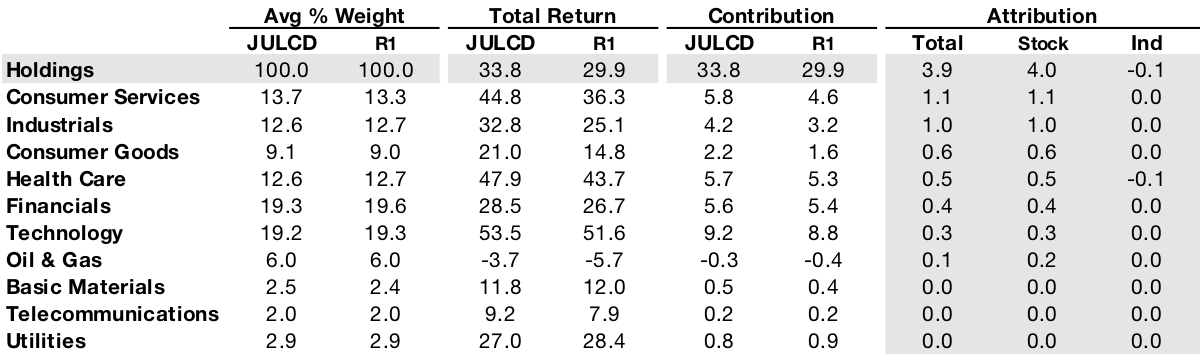
Based on November 30, 2016 – November 30, 2018 returns. Columns may not sum to total due to rounding.