
Human capital management (HCM) is an important consideration for the many institutional investors who believe that analysis reflecting how a company’s workforce is managed can impact long-term value. Institutional investors are increasingly recognizing the potential materiality of workforce-related metrics such as turnover, strong benefits, diversity, health and safety, and pay equity, and many believe these factors provide insights into intangible value, operational stability, talent retention, and innovation capacity. However, institutional investors often struggle to acquire the right data to effectively compare individual firms and industries. Additionally, in the United States, HCM disclosures remain limited and are mostly subject to disclosure only at the company’s discretion. For decades, before expanding principles-based rules several years ago, the Securities and Exchange Commission required only the disclosure of one specific metric – the number of employees – and even that failed to account for gig workers and contractors or to adequately delineate other non-traditional employment models, such part-time or seasonal workers.
This report synthesizes insights from 14 institutional investors – seven asset owners and seven asset managers – who manage and invest assets for funds ranging in size from $50 billion to the trillions. It explores how investors approach HCM data, the challenges posed by limited disclosure, their view on the materiality of HCM data, and how they navigate these barriers in their stewardship and engagement practices.
This report is based on interviews with 14 institutional investors, divided equally between asset owners and asset managers. Participants represented a range of management styles, including passively managed portfolios tied to indices and actively managed funds that consistently incorporate HCM metrics into their strategies.
The seven asset owners participating in the survey included the Office of the New York City Comptroller, the Office of the Illinois State Treasurer, and the California State Teachers’ Retirement System (CalSTRS), while others elected to anonymously respond. Asset owners ranged in the amount of internally managed assets they held, from as little as none to more than 90%. The seven asset managers participating included Schroders PLC, Zevin Asset Management, EOS North America of Federated Hermes Limited, and four anonymous respondents; they tended to manage all of the assets they held internally, and more than one manager provided engagement and stewardship services to other funds for assets that they did not control.
The topics covered in the survey interviews included the investors’ use of HCM data, their views on its materiality, and the challenges they face in accessing actionable information. Investors shared their thoughts candidly, often drawing on specific examples from their work.Since participation was voluntary and the report’s primary stated focus when recruiting participants was HCM metric issues, funds that value HCM and are willing to provide their time and perspectives on the issue are likely overrepresented here. For that reason, the report likely has a bias toward self-selecting the funds most interested in HCM issues. While the respondents may not be representative of the average institutional investor, there is still value in understanding their perspective since several of the HCM topics do receive high levels of support from shareholder proposals. These areas receive tremendous attention and public commitments from companies during engagements, and they highlight central HCM topics that funds with less of a focus on HCM issues do pay attention to (albeit to a lesser extent), as evidenced by shareholder proposal voting and voting policies throughout the investor sphere. Ultimately, the perspectives shared in this report represent the vanguard of investor work on HCM issues while not necessarily representing institutional investors as a whole.
Many investors see HCM as interconnected with other stewardship issues. Each investor was asked to name their fund’s top priorities so we could understand where HCM issues fit in with their broad stewardship goals. Overall, their responses show that HCM’s prominence in investor priorities reflects its far-reaching implications across various dimensions of stewardship and performance.
The key themes highlighted in this section illustrate how the participants prioritize stewardship issues that span governance, environmental challenges, workforce management, and social equity. Together, they reflect a holistic approach to managing risk and creating long-term value across their portfolios.
Governance and Board Oversight
Governance remains a foundational concern, encompassing board diversity, effectiveness, independence, and accountability. Investors prioritize ensuring that boards are equipped to oversee key risks and drive long-term value creation. Several investors emphasized the importance of diversity in leadership, most commonly expressing the need for racial and gender diversity but also naming other categories like diversity of age, perspective, and thought. Most often investors cited:
Climate and Environmental Risks
Several respondents reported prioritizing climate-related risks and opportunities, particularly in industries transitioning to sustainable models. Metrics like carbon accounting, water usage, and biodiversity impact were frequently raised. Just transition issues represent a nexus between climate and HCM because as climate-responsive policies dictate changes in energy sources and use in particular, many companies and investors are also focusing on how to lessen the affected industries’ negative impact on communities and workers, including how to support these groups in transitioning to other jobs and industries. Most often investors cited:
Human Capital Management (HCM)
Investors widely recognize workforce-related issues as central to operational stability and long-term value creation, citing turnover, diversity, health and safety, and freedom of association as critical metrics. Additionally, they connect workforce health and safety to operational integrity and productivity, emphasizing the need for metrics on injury rates, safety policies, and employee well-being. Most often investors cited:
Diversity, Equity, and Inclusion- (DEI-)Related Issues
Although DEI-related issues have become a lightning rod for many companies and investors, the surveyed investors’ interest in workforce culture, engagement, productivity, training, and satisfaction – factors that underpin many serious DEI programs – remains relatively intact. Several participants expressed the belief that racial and gender diversity can drive innovation and talent retention and that the diversity of the board and management ranks are meaningful metrics to assess a company’s efforts on representation and its governance strategies. These participants argued that better data is needed on representation, recruitment, and retention across demographic categories, and they reported discussing these issues during company engagements and in data requests to companies. Most often investors cited:
Corporate Accountability and Human Rights
Corporate accountability, including transparency in lobbying and aligning policies with stakeholder interests, emerged as a common theme. Some investors also tied this to broader human rights concerns. Most often investors cited:
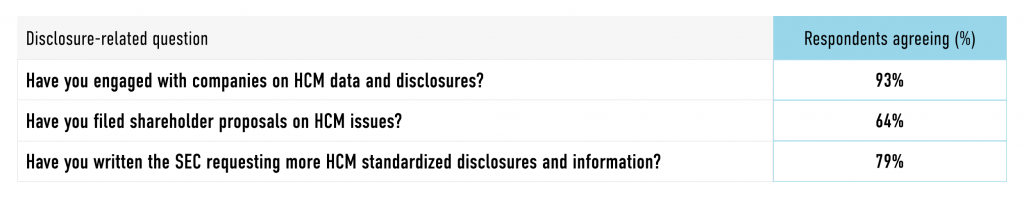
Institutional investors incorporate HCM data into a variety of activities, from proxy voting to engagement and investment analysis. However, the participants expressed that the lack of standardized disclosures limits the effectiveness of these efforts.
Specifically, when respondents were asked to agree or disagree with the following statements:
Investors highlighted several metrics as particularly valuable for understanding workforce dynamics:
Marina Severinovsky of Schroders further explained how HCM ties into financial outcomes that investors can use to outperform other managers:
From our research on HCM, we found three key areas that impacted alpha greatly: employee sentiment and culture, board diversity, and employee compensation and turnover. These metrics link together to form a fuller picture. Compensation fairness, living wages, inclusion, and culture all contribute to employee sentiment, which is linked to turnover and directly impacts P&L.
Emily DeMasi of EOS at Federated Hermes Limited spoke about the intersection of metrics like turnover and demographic information, as well as its usefulness for assessing the quality of workforce management. When their stewardship team has that information, DeMasi said, they take cues from those disclosures and it impacts their votes on board members and shareholder proposals:
Our decisions are more around stewardship and voting decisions, and similarly, it would help us understand where gaps exist in talent. If you would break down a turnover number into more granular demographics, it could get us to whether we should really be pushing for inclusion instead of just diversity from a stewardship standpoint, and as far as voting decisions, we see more and more shareholder proposals related to worker voice, whether that be from a very basic freedom of association, neutrality shareholder proposal, and up to including a worker on the board. There’s a wide spectrum between those two things, but if we understood how well or poorly a workforce was being managed, then it would directly influence whether or not we would end up supporting those types of proposals or not, and whether we’d want to hold a board member [who’s] either part of the committee charged with overseeing these issues, or the chair of the nominating and governance committee. There’s not enough data out there to really inform those decisions the way we’d prefer.
One asset owner spoke about worker safety and its importance in ensuring that the company is managing employees well, keeping litigation costs low, and encouraging employee retention in dangerous fields:
Materiality is obvious in some industry- and company-specific metrics like cell phone towers owned by REITs and fatalities for workers. It is very complicated because contractors versus employees versus temporary workers hired by the property management company for that specific tower area are disclosed differently. Different terminology that companies use differently, but fatality rates are definitely material for companies and industries where injuries are most likely, like mining, construction, etc. We know these are material, but we don’t have the data. OSHA guidelines leave room for variability in what and how companies disclose, and it is resource intensive.
One asset owner noted that the information they look for spans multiple categories and enables them to fully understand how well a company is managing its workforce and policies by looking very broadly at a variety of data points:
We’re always looking for transparency. Every company should publish its EEO-1 report, disclosure of issues that show effectiveness of the company’s efforts to manage things like harassment and discrimination. We want demographic reporting, and information related to efforts in recruitment, promotion and retention by EEO-1 categories. We want to know about inclusive policies and benefits and whether the company collects and protects private information. We are in favor of freedom of association policies and labor and human rights reporting. The issues are different at different companies so we need a wide variety of information to compare.
Will Pomroy of Federated Hermes Limited explained their comprehensive evaluations across several metrics and on both an absolute and relative basis to peers:
There is definitely a lot of case-by-case analysis on what is particular to an individual business or sector. That said, within the ESG tear sheet that our analysts produce, there are common metrics that are looked at for each name to be considered for investment. They include employee turnover rates, employee accident rates. workforce diversity metrics, broken down by workforce as a whole and at management level, and an average pay or median pay metric included. All of those metrics are looked at, both on an absolute basis and on a relative-to-peer basis to help contextualize.
Another asset manager spoke of their detailed analytical process that compares metric performance among sub-industry peers:
We use many metrics, like turnover, professional development measured by training hours, percentage of work represented by collective agreement, health and safety, such as total recordable injury rate (TRIR) and fatalities, health and safety policies. We have our own proprietary models so we are only using the underlying data from the rating agencies providers and we go down to the GICS sub-industry. We have our proprietary materiality map of the material risks and opportunities from across the sub-industries. And we include the actual academic or industry evidence that backs it up so it’s super transparent for our investors. We go metric by metric across each one of the 163 sub-industries to determine if we have statistically significant enough coverage of this metric to include it into our model.
Several investors reported being very responsive to controversies that arise among portfolio companies. One asset manager described their HCM engagements as being led by idiosyncratic company issues or industry-level effects for metrics that don’t necessarily rise to the portfolio level, saying, “We really focus on controversies and issues that are material to the industry or the company in particular. We don’t do thematic engagements on HCM across our portfolios.”
The lack of consistent HCM disclosures imposes significant costs on investors, both direct and indirect. Some firms invest heavily in third-party data providers, while others devote substantial time and staff resources to filling information gaps and evaluating non-standard disclosures. Most investors dedicate significant time and money to collecting and analyzing HCM data but are unable to provide specific costs because they don’t segregate costs from their other stewardship data and engagement activities. However:
One asset owner detailed the inefficiencies created by inconsistent data:
It’s hard to quantify, but in terms of time it requires five to seven hours a week in terms of trying to amass and validate info. EEO-1 report searching is time-consuming because it’s not in a standardized place or location. In terms of opportunity cost, it’s very hard to benchmark companies against each other, to target the worst versus best, which is a good thing to know as a universal owner. Instead, we are left to guess who is a laggard, and ultimately that’s not impactful.
Investors participating in the survey almost uniformly described the state of U.S. HCM disclosures as inadequate, citing a lack of standardization, incomplete data, and companies’ resistance to sharing meaningful metrics. As one asset owner articulated:
The state of disclosure is absurdly deficient. Because it isn’t standardized, you can’t use it for making investment decisions. Even for stewardship and voting decisions, the lack of clarity means sometimes spending weeks drafting proposals and negotiating, only to end up with data that isn’t decision-useful.
Another asset manager summed up the frustration with the current state of HCM data:
It’s inconsistent and sparse, varied by industry and maturity of the company. Most of the data that is available are not the best indicators of performance or risk/opportunity management. It’s hard to gauge what is good performance versus bad, which metrics are comparable versus those that vary due to industry or business model considerations.
Emily DeMasi of EOS at Federated Hermes Limited highlighted the deficiencies in the way data is disclosed:
It’s just fragmented and uncomparable. We see more data being disclosed, but not in a way that allows us to make the decisions that I think investors want to make on that data. If I could only have one data point, what would it be? It would be turnover, and it is shocking how few companies actually disclose a turnover number, voluntary or involuntary. When you see that number over time, it gives you a lot of insight into how well the human capital is being managed in any company and then you would be able to see it across peers.
Will Pomroy of Federated Hermes Limited spoke about the large differences he sees in the U.S. versus U.K. markets:
I see, sitting here in the UK, the basic lines in a financial statement such as personnel expenses are easily identifiable and straightforward to get a sense of, actually, what is the cost of labor for that business and how productive is that time and how does that then interrelate with employee turnover rates and accident rates and the like. You can begin to get a reasonable first impression of the company’s human capital management practices, whereas in the US, I think one struggles to begin to piece together that initial picture to then be able to dig deeper to form a more detailed view.
Another asset manager noted that it seems like progress has been slow for certain movements:
It’s very weak. The HCM required disclosures in the proxy statement from the SEC is not uniform, so it makes it difficult to use as a point of comparison and we don’t have a lot of other information. We have spent a lot of time trying to get companies to disclose racial and ethnic composition of the board and that seems like it should have been solved many years ago. We’d like to be talking to companies in depth about their workforce issues but there’s just very little information out there.
Karen Kerschke of the Office of the Illinois State Treasurer added that the lack of data creates challenges in engaging with companies:
During engagements, companies will often assure us that they are performing better on HCM than other companies, but there is no way to verify such claims without public disclosure that is comparable between the company and its peers.
One asset manager stated:
Within human capital, there are questions like, are there safe and lawful working conditions, are there whistleblower mechanisms, protection of freedom of association? That’s baseline. How are they from an industry standard perspective, looking at their compensation and benefits, what is their strategy around that in terms of board governance, and then in best practice, what are their talent pipeline initiatives? So we’re looking at it a couple of different ways because you just can’t quantify it with one.
Another asset manager spoke about some positive changes in disclosures over time:
We have been pleased to see an increase in qualitative disclosures on HCM and DEI, and appreciate that many of the largest employers in our portfolio disclose in alignment with our guidance. We find Ethan Rouen’s research on the relative lack of HCM disclosures across the market useful.
Several investors cited the work of the Human Capital Management Coalition (HCMC), a network of over 30 institutional investors that advocate for four foundational HCM disclosures. One respondent from an HCMC member, Marina Severinovsky of Schroders, noted:
U.S. companies disclose HCM information in their 10-K forms, however the narrative presentation of this information and the breadth of topics included make it difficult to compare companies. More standardized disclosure would enable investors to make more informed assessments of companies’ human capital management performance, including:
1. how many workers, including employees and independent contractors (disaggregated) the company uses within its direct operations;
2. total cost of the workforce, including wages, bonuses and other benefits, presented in a way that evidences a discernible through-line from the company’s audited financial reports to issuer disclosures;
3. turnover, disclosed in a disaggregated manner to separate voluntary and involuntary turnover, accompanied by a description of management’s actions to attract and retain workers, and build an inclusive culture; and
4. diversity data, including diversity by seniority (such as required through annual EEO-1 reporting and gender pay gap data), sufficient to understand the company’s efforts to access and develop new sources of human capital and any strengths or weaknesses in its ability to do so, particularly as it relates to work to foster an inclusive culture. These disclosures are important to inform the investor view of how a company is building a diverse and inclusive culture and exposure to litigation risk.
What Metrics Investors Would Like to See Companies Report
There is substantial support from the surveyed investors for enhancing required disclosures to make HCM data more available, clear, and comparable. We asked which of these metrics and data points participants would like to see disclosed under rules that would make them clear and comparable among companies, and as the following table shows, investors were highly supportive for most disclosures of pay and benefits.
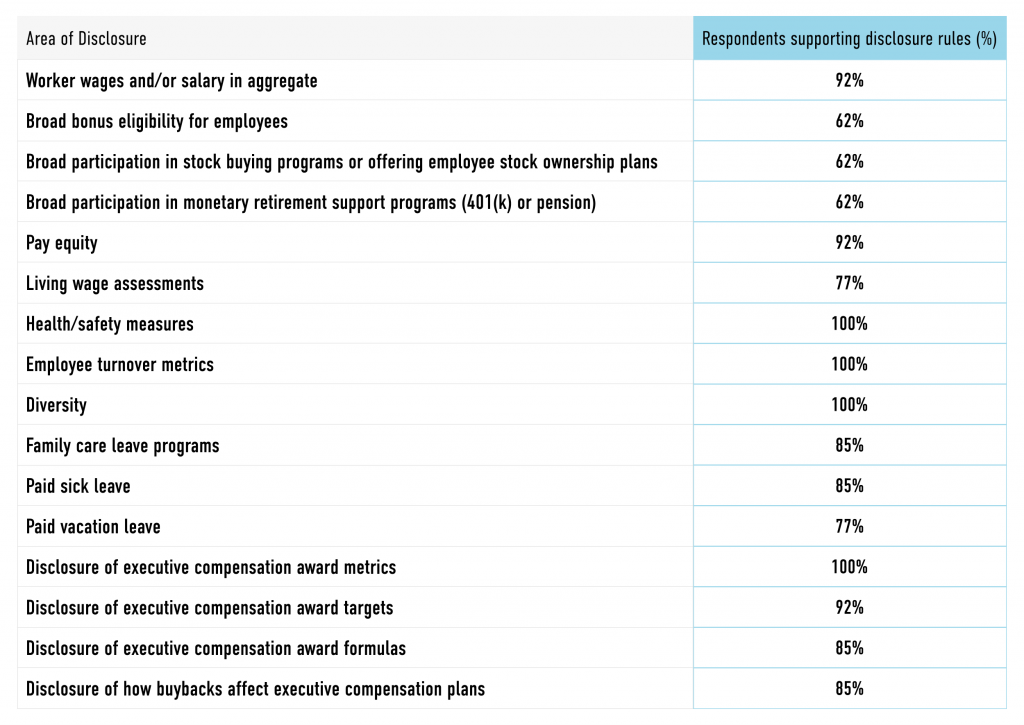
Investors view HCM data as material across industries, though the relevance of individual metrics varies by sector. For example, workforce safety is critical in manufacturing, while diversity and inclusion are prioritized in technology.
Rekha Vaitla of CalSTRS tied HCM data to risk mitigation:
Turnover, pay equity, benefits information, and training and development are critical for understanding a company’s stability. These metrics directly inform our view of long-term risk and opportunity. For us, it’s a calculation of risk; we see that there is risk here that we need to mitigate for beneficiaries. We need to understand what is the stability of the companies that we’re invested in and what is their ability to retain workers and to grow and retain value in the long term.
One asset owner emphasized the importance of comparability:
Materiality comes from being able to benchmark. Without standardized data, we’re left guessing. Comparisons between companies are essential for identifying risks, but we can’t do that without comparable information from all companies.
Marcela Pinilla of Zevin Asset Management said:
Rate of turnover, and rate of retention and promotion of diverse talent (broken out by gender, race/ethnicity) tells a workforce story. Do associates or executives of color who join the company stay in their job? Do they get promoted? We also want to get insight into the bigger picture of job quality. This includes wages and benefits like paid sick leave, reproductive care access, pay equity, and anti-competitive practices like noncompetes in employee contracts that hinder wage growth and job mobility. Disclosure is the baseline request so that investors and stakeholders have decision-useful information to analyze and evaluate progress, and it’s also important to factor in qualitative information such as stakeholder input and employee feedback.
Marina Severinovsky of Schroders noted several metrics that her organization believes give companies a competitive edge in workforce management:
We identify human capital management as a priority issue for engagement, noting that people in an organization are a significant source of competitive advantage…Several metrics we consider material [are]: Paid time off and wider benefits including sick pay, company culture/sentiment, number of employees, total cost of workforce, voluntary and involuntary turnover, and workforce diversity data. We see these metrics having a direct impact on company performance, and companies can create a key competitive advantage by treating them as material.
Karen Kerschke of the Office of the Illinois State Treasurer noted the risk to investors from poor management of HCM issues:
Workers are the most important asset for any company. When companies recognize this and treat their employees well, they are better positioned for long-term success and to unlock sustainable value creation for their investors. Unfortunately, there have been alarming trends among some of the largest companies in the United States and elsewhere to treat workers more as disposable commodities than as vital assets. This includes tolerating high employee injury rates, turnover rates, subverting labor standards, or hiring contract workers with limited protections. Trends such as these represent poor human capital management practices that can create material operational, legal, regulatory, and reputational risks that can lead to depressed financial performance.
Multiple participants brought up the difficulty of defining what is material in terms of HCM metrics before having access to the data. Emily DeMasi of EOS at Federated Hermes Limited stated:
So, we would like to look at the total cost of the workforce, look at workforce demographics and then, the two most basic things that you think every company would report consistently, and comparably, is number of employees, including part time, contract, gig or consulting workers, however that is defined. And lastly the really key metric of turnover. But until we have those reported on a regular basis and people are making decisions on that, it’s honestly really hard to say which are the most material. It’s almost like the chicken and the egg. So those are the issues that have consistently come up as to what asset owners believe to be the most material for making decisions, but until we are enabled to see it and start making decisions on it, that’s the only way to sort of prove the case and prove that they are the most material.
Another asset manager worried about the data not being available to be rigorously tested in academic study, as well as being known to some in the market (such as employees) but not being actionable and known to investors:
I think there is an assumption of materiality because for a lot of companies knowledge is stored with the staff, but we don’t have access to study that because the data is not public. So I can’t point to academic studies, but if we had the data out there, the academic studies would follow and then we would be able to show materiality. Anecdotally, one of my relatives left a job because she felt like she hit a glass ceiling, and when she looked internally at promotions and retentions, she realized every senior-level woman had quit within the last three years. And so while she didn’t have any personal experience with gender discrimination, she inferred that the lack of females in leadership meant that she wouldn’t be able to advance at the company. So that kind of information is helpful for analyzing recruitment and retention. The employees know, and look at it often. And they are using it for decisions. As an investor on the outside, we don’t have that information.
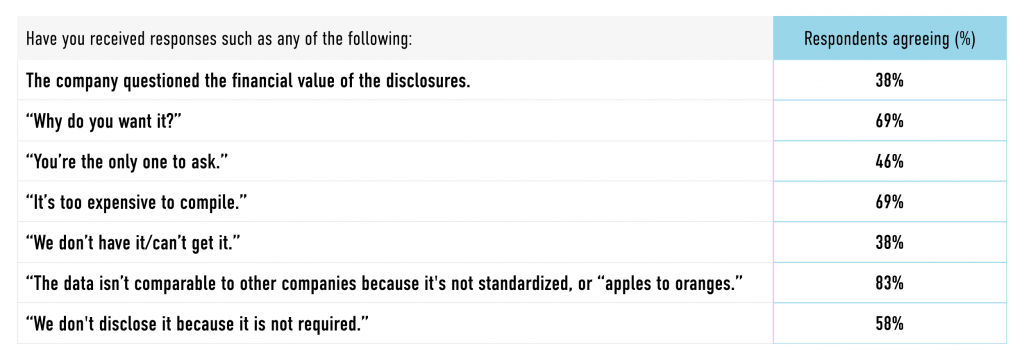
Investors frequently engage with companies to advocate for improved HCM disclosures, but they often encounter resistance. Common pushbacks include claims that data collection is too expensive or that metrics lack comparability.
Several investors said “it’s not required” is the most-heard rationale from companies for not disclosing HCM data. Some participants said companies question the value of certain disclosures, like metrics on the board and workforce representation along racial and gender lines.
As one asset owner remarked:
Engagement responses from companies are enormously variable. Companies with strong HCM stories are more willing to disclose, but others are resistant, especially in the U.S., where disclosure requirements are weaker.
Investors often hear similar responses from companies. When we asked if they’d heard any of the following responses to their requests for disclosure, participants most often said they heard that the company didn’t want to release information because it wasn’t “standardized” or “apples to apples.”
HCM data is critical for improving investors’ understanding of corporate value, returns, and risk mitigation, yet the current state of U.S. disclosures limits investors’ ability to benchmark companies. The asset owners and asset managers participating in this study believe that standardized reporting frameworks that include metrics like turnover, diversity, pay equity, and safety data are essential to closing these gaps.
Many investors believe that workers are the most important asset for any company, which is borne out in part by the rise of intangible asset value at companies over time. When companies treat their employees well, they’re more competitive with peers and better positioned for long-term success. Standardized disclosures would allow investors to identify leaders, hold laggards accountable, and drive sustainable value creation. By improving transparency, U.S. companies allow investors to make more informed decisions and foster a stronger, more sustainable economy.
Investors in our survey are eagerly waiting for companies and regulators to step up to improve the quality and quantity of HCM data so that they can make investing and stewardship decisions with deeper knowledge and greater accuracy. In the meantime, they are expending considerable money and effort to glean what they can from non-standardized reporting, external data providers, and their own analysis and direct conversations with corporate leaders.
Ultimately, these investors are seeking clear and comparable metric disclosures by all companies on key metrics. By addressing these gaps, the U.S. can align its practices with global standards, enabling more effective stewardship and fostering a more sustainable and equitable economy.
In the third quarter of 2024, the S&P 500 posted a gain of 5.9%, reflecting the resilience of equity markets as they overcame initial volatility, including a sharp 12% correction in the technology sector. This recovery was driven by a significant shift in Federal Reserve policy, with the Fed implementing a 0.50% rate cut in September, the first such reduction since March 2020.
Sector performance underscored a rotation from growth-oriented areas of the market to more stable, income-generating value sectors. Value stocks out-performed growth stocks, with value sectors like utilities, financials, and consumer staples gaining traction amid market uncertainty. Value stocks returned a robust 9% for the quarter, significantly outperforming growth stocks, which posted a more modest 3.6% gain. Utilities led the way with an impressive 19.4% return, followed by real estate investment trusts (REITs), which gained 17.2%, and financials, which rose 10.7%. These sectors benefited from their defensive characteristics and income-generating potential, which became more attractive as interest rate expectations shifted. Energy, however, was the sole sector in negative territory due to weaker demand and lower oil prices, although it remains up 8.4% year-to-date.
The Federal Reserve’s rate cut also supported a notable rally in small-cap stocks, which outperformed their large-cap counterparts. The Russell 2000 small-cap index gained 9.3% during the quarter, benefitting from the Fed’s dovish stance, as lower rates tend to favor smaller companies that are more sensitive to borrowing costs. This marked a reversal from earlier in the year, when large-cap growth stocks dominated due to their perceived stability in a volatile economic environment.
As of September 30, 2024, our flagship index – the Just U.S. Large Cap Diversified Index (JULCD) has out-performed the Russell 1000 (Cap-Weighted) benchmark by 0.46% year-to-date and by 11.97% since its inception. Additionally, the Just 100 (equally weighted index) has outperformed the Russell 1000 (Equally-Weighted) index by 7.38% year-to-date and by 51.1% since its inception.
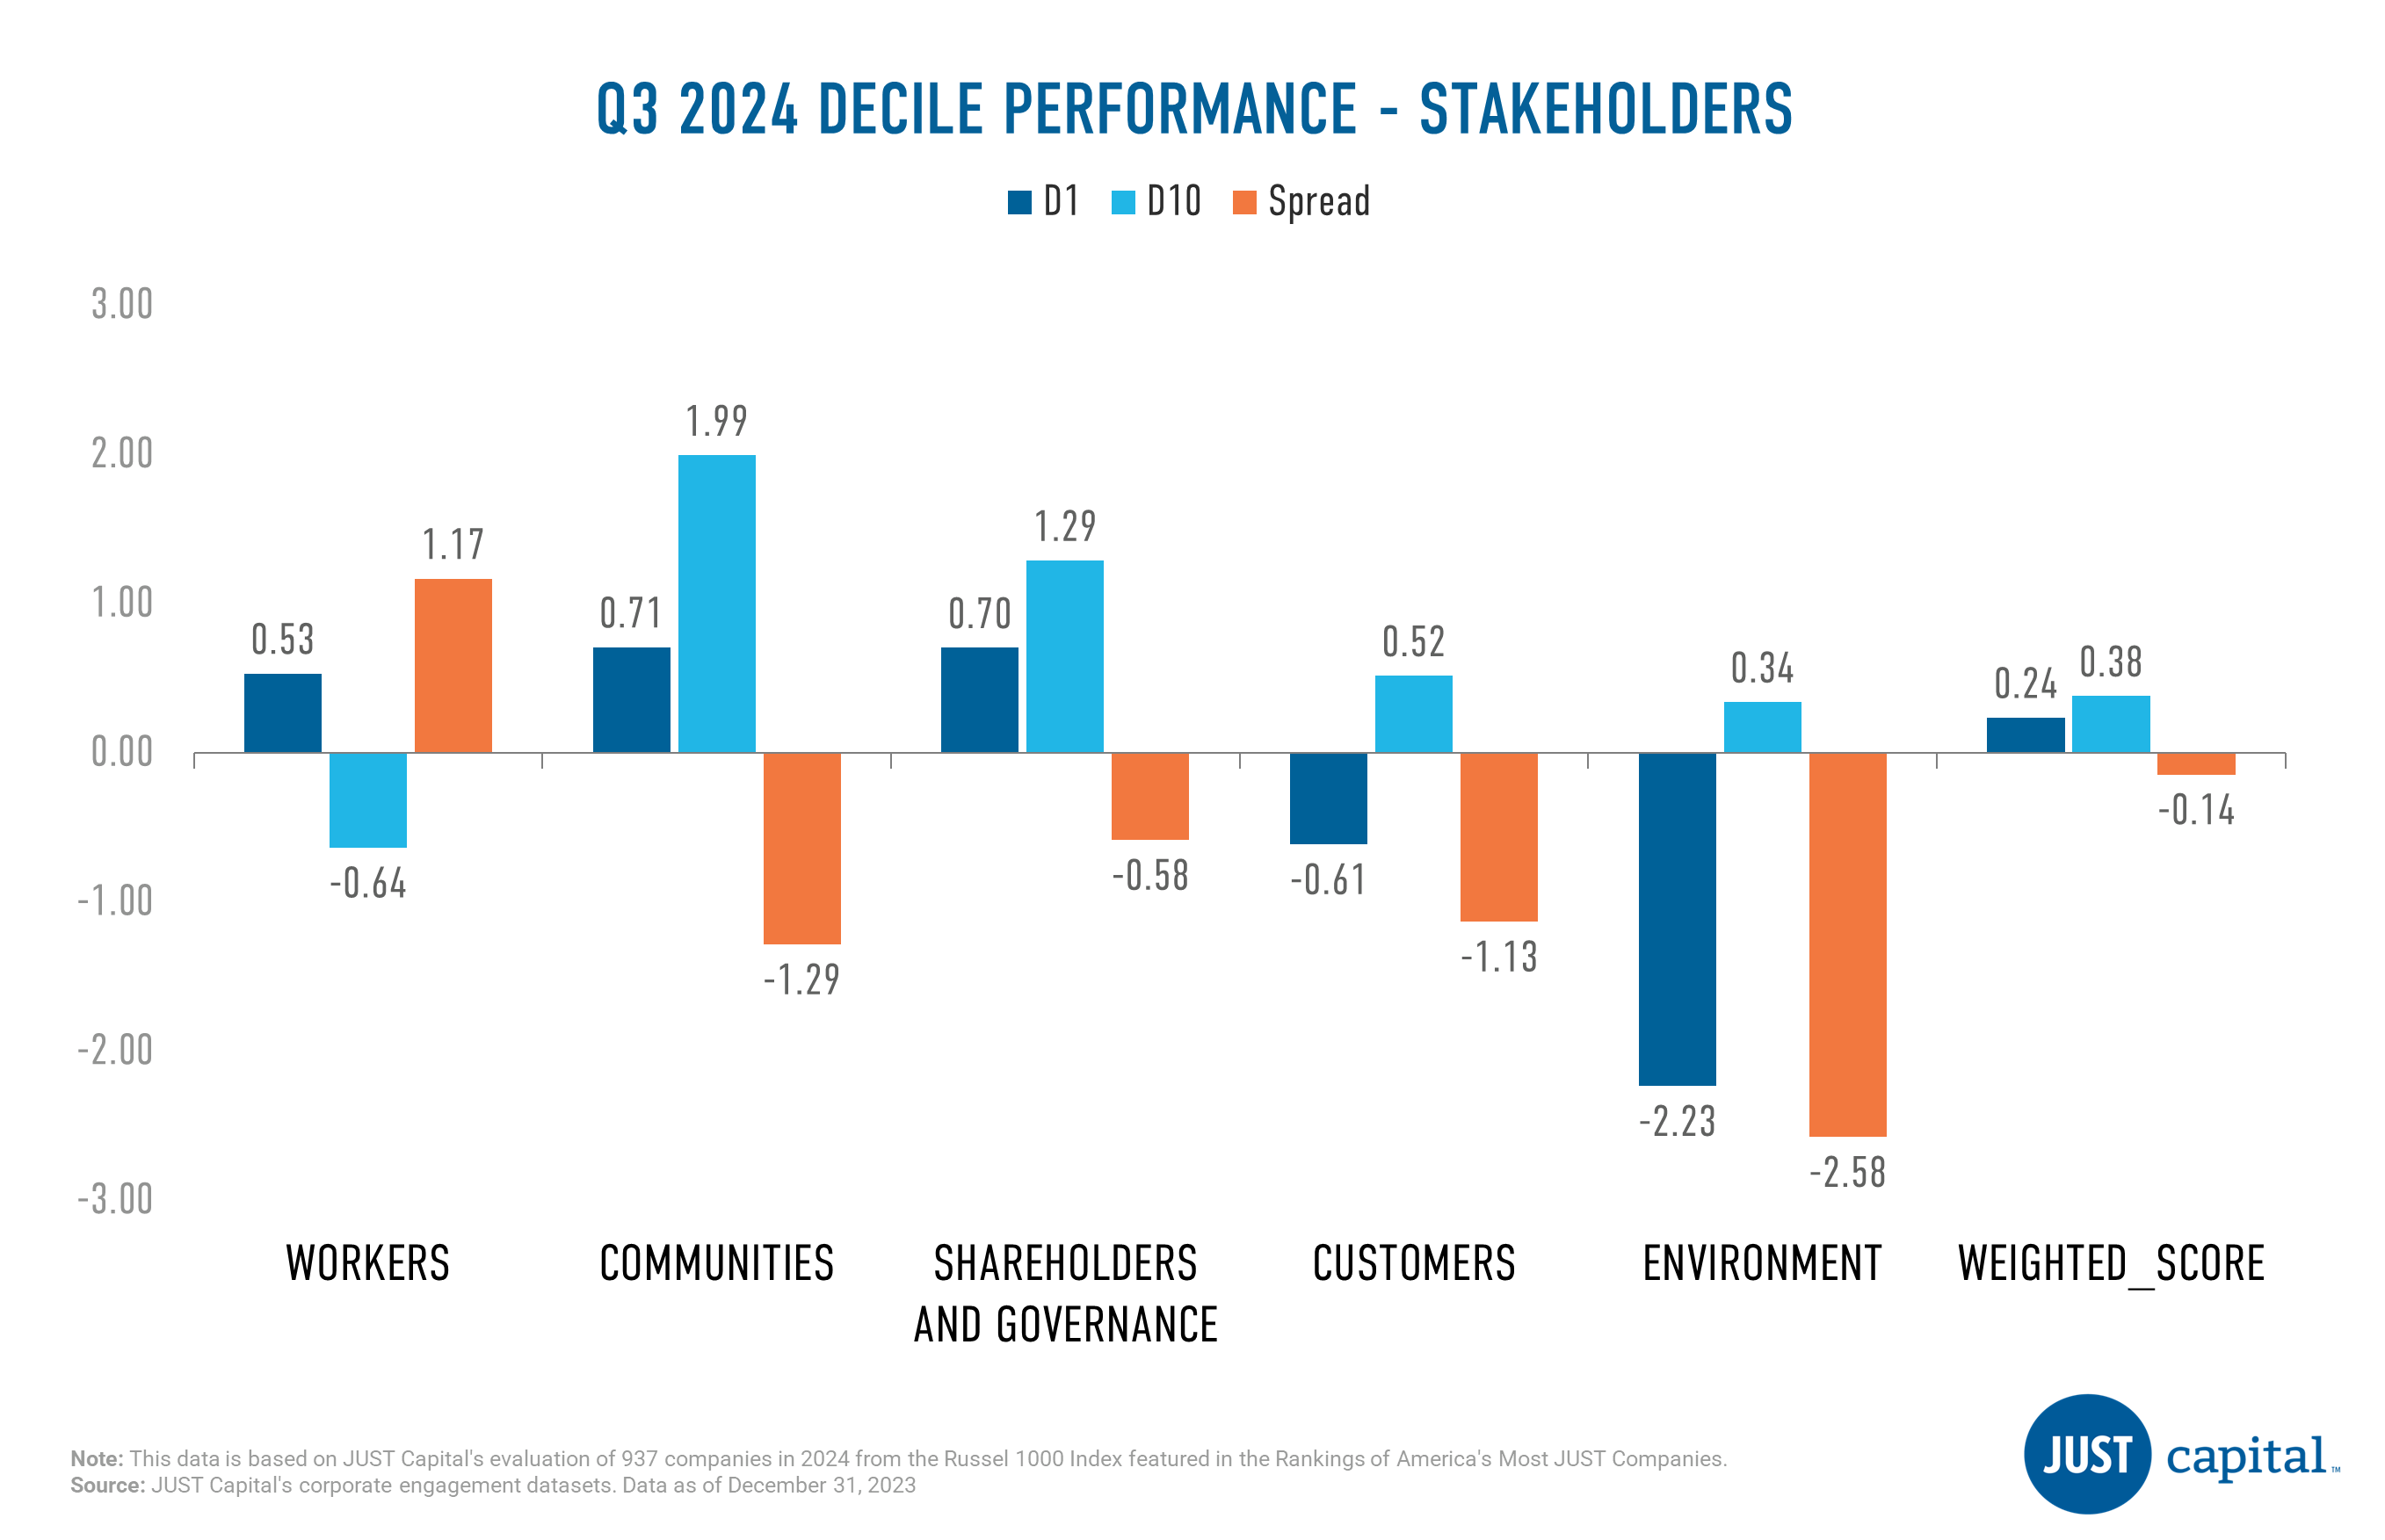
Just Capital found that four out of the five stakeholder categories it tracks delivered negative performance in Q3 2024, with the “Workers” stakeholder being the sole positive performer. The Workers stakeholder delivered the strongest performance over this period with a long-short spread of 1.17%. Notably, within the Workers stakeholder, outperformance was driven by both the top and bottom deciles.
Just Capital’s Overall Weighted Score takes into account the 20 core Issues determined through our annual survey research – including paying a living wage, creating a diverse, inclusive workplace, and helping combat climate change – across key business stakeholders: Workers, Communities, Shareholders & Governance, Customers, and Environment. The Overall Weighted Score delivered an almost neutral long-short spread of -0.14%, with the bottom decile serving as the primary negative contributor for the period ending September 30, 2024. Year-to-date the performance spread between top and bottom decile for Overall Score is at 9.11%
Workers
The Workers stakeholder measures a company across five Issues:
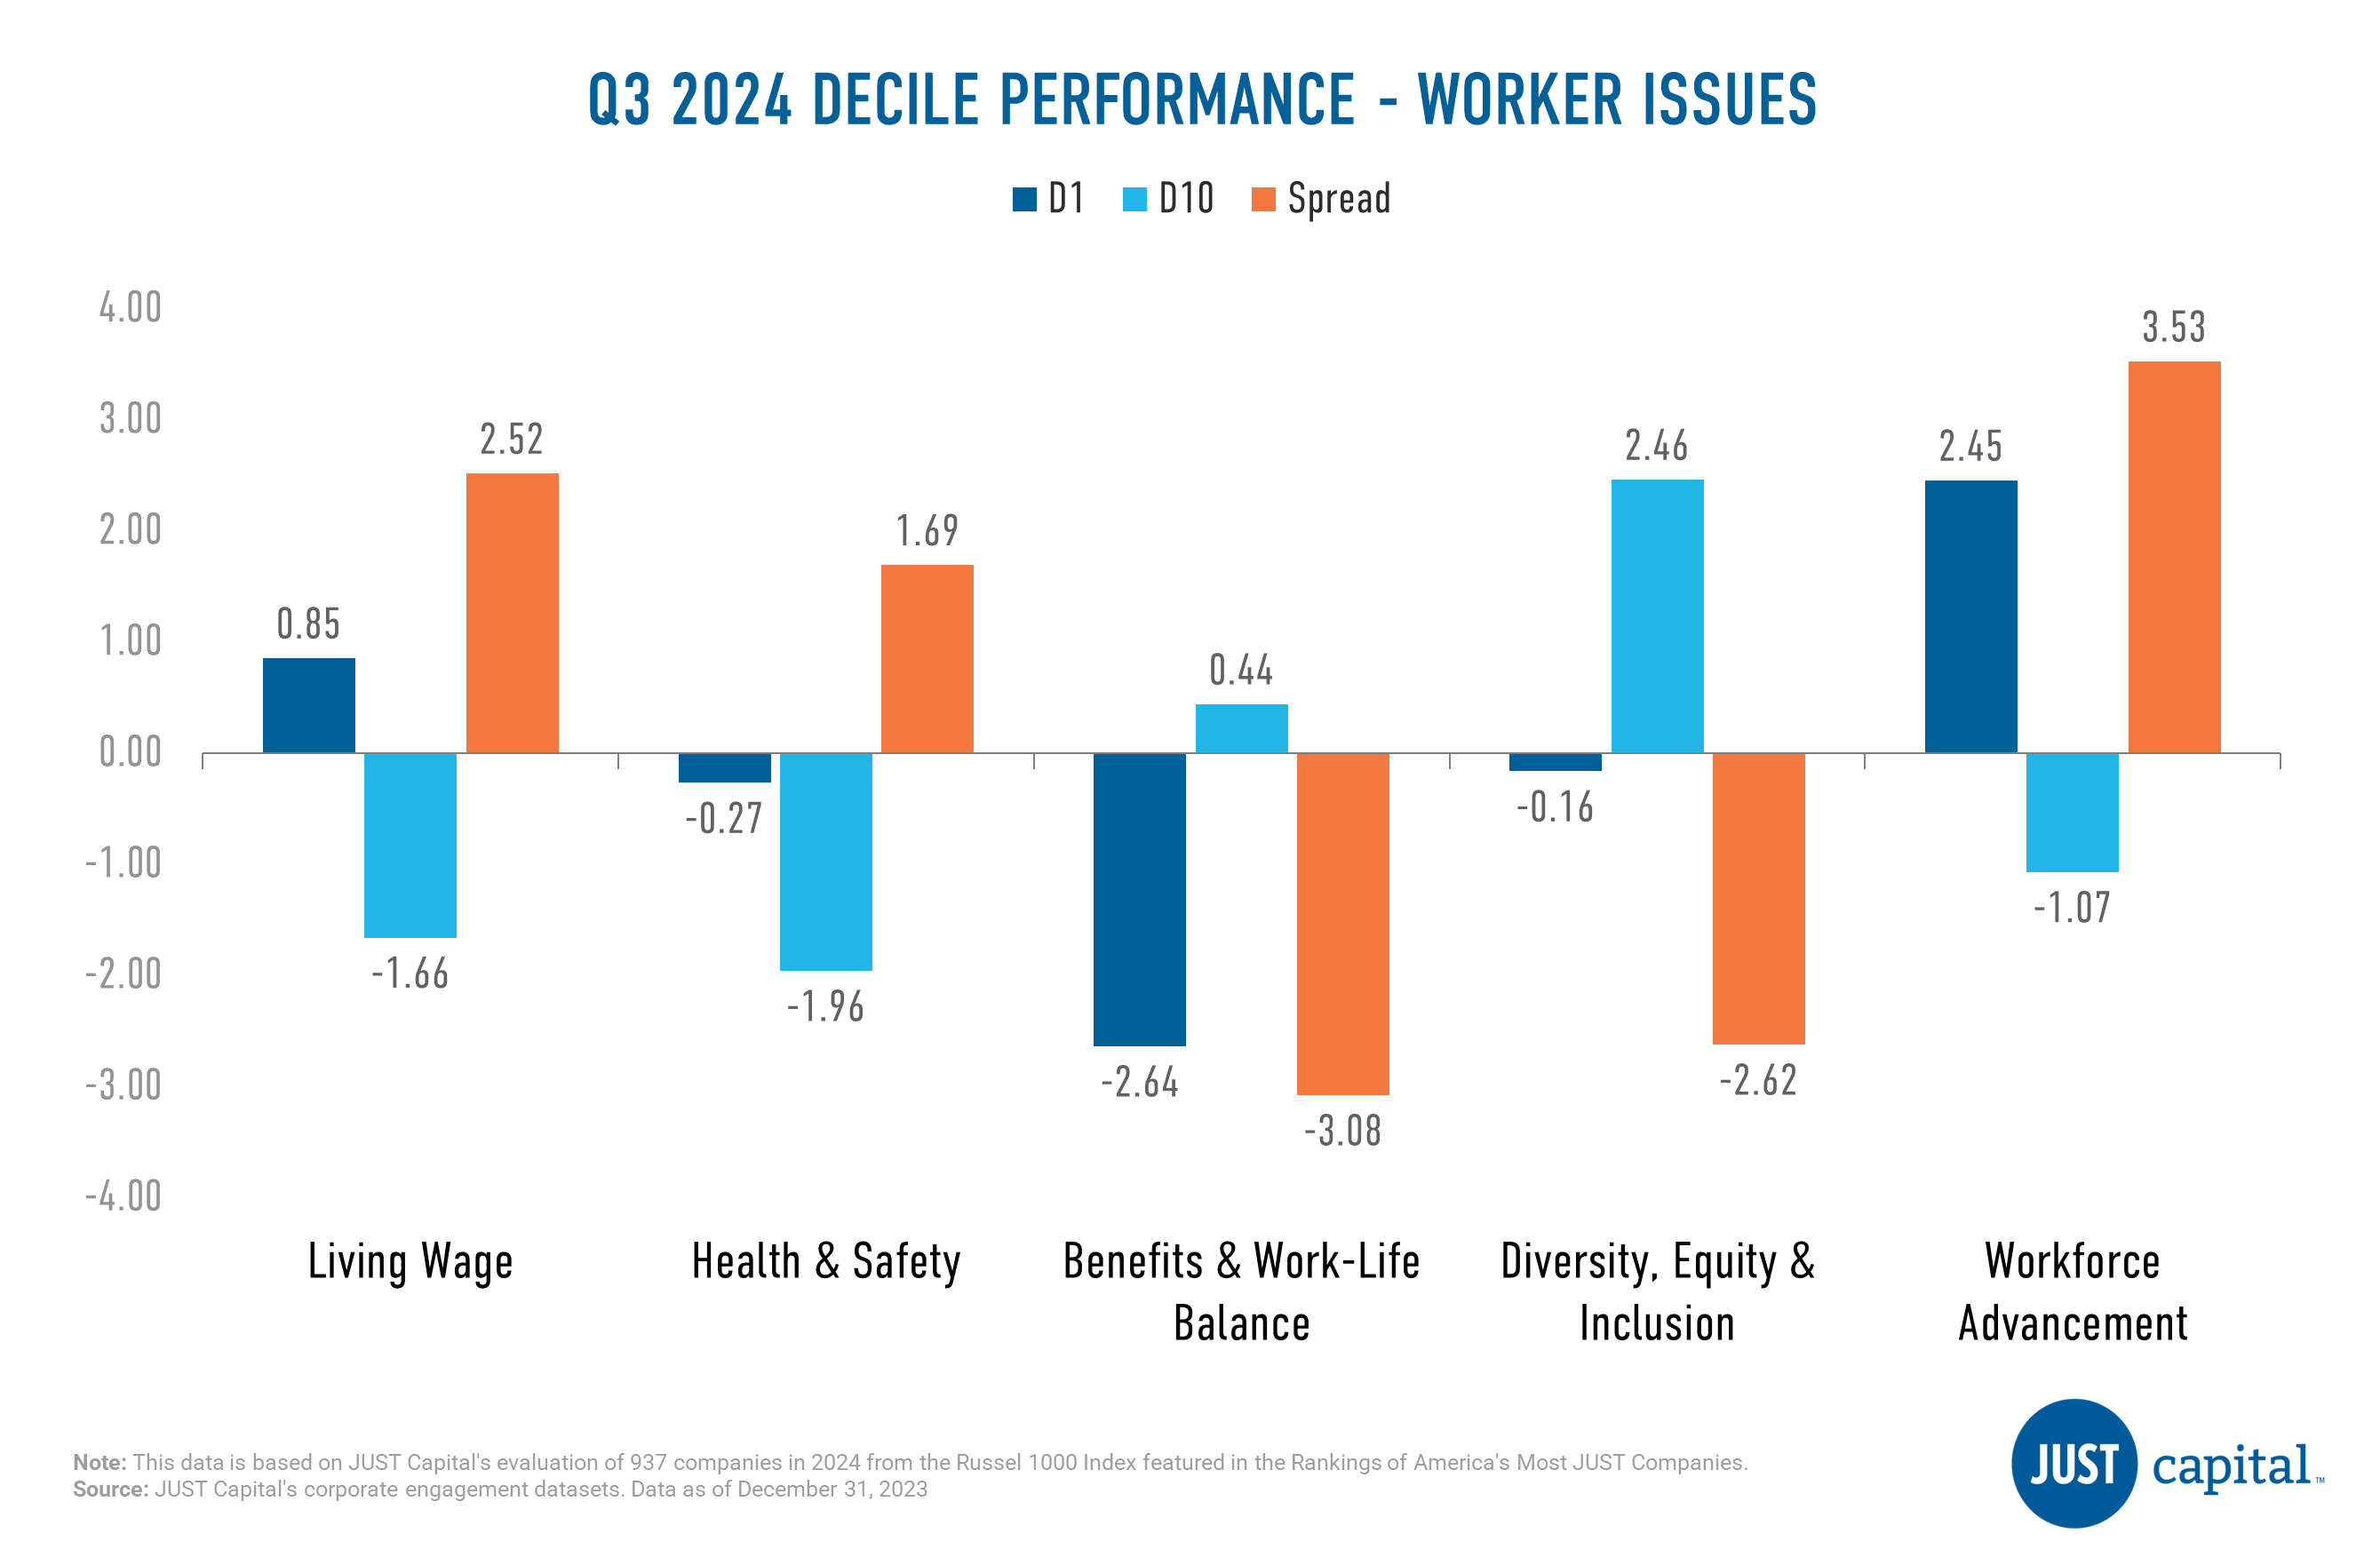
In Q3 2024, we saw three out of five issues deliver positive performance, with the Workforce Advancement Issue faring the best. Benefits & Work-Life Balance was the weakest performer amongst the Worker issues.
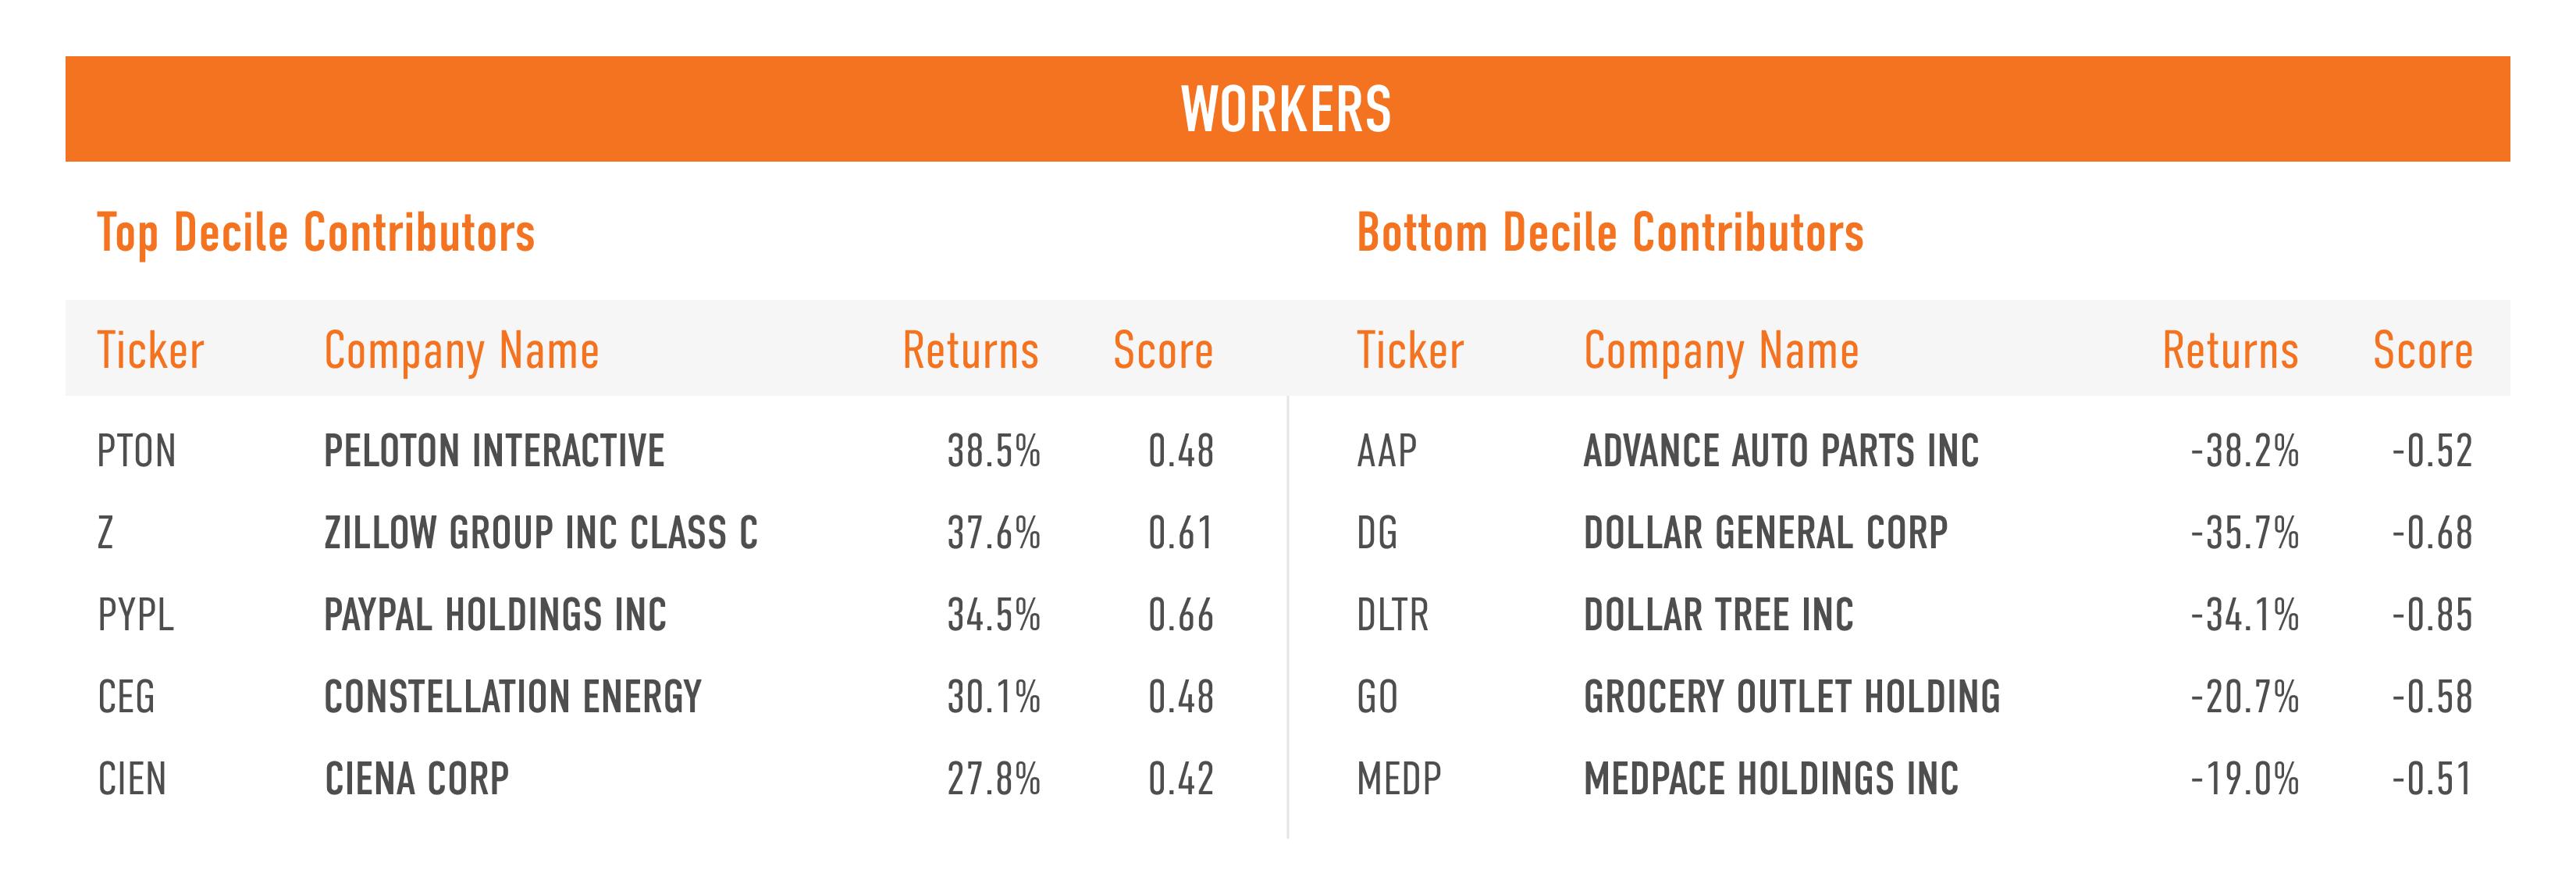
Shown below are the top and bottom five contributors to the top decile (D1), the top-ranked companies as measured by their Workers score, and the bottom decile (D10), the lowest-ranked companies as measured by their Workers score.
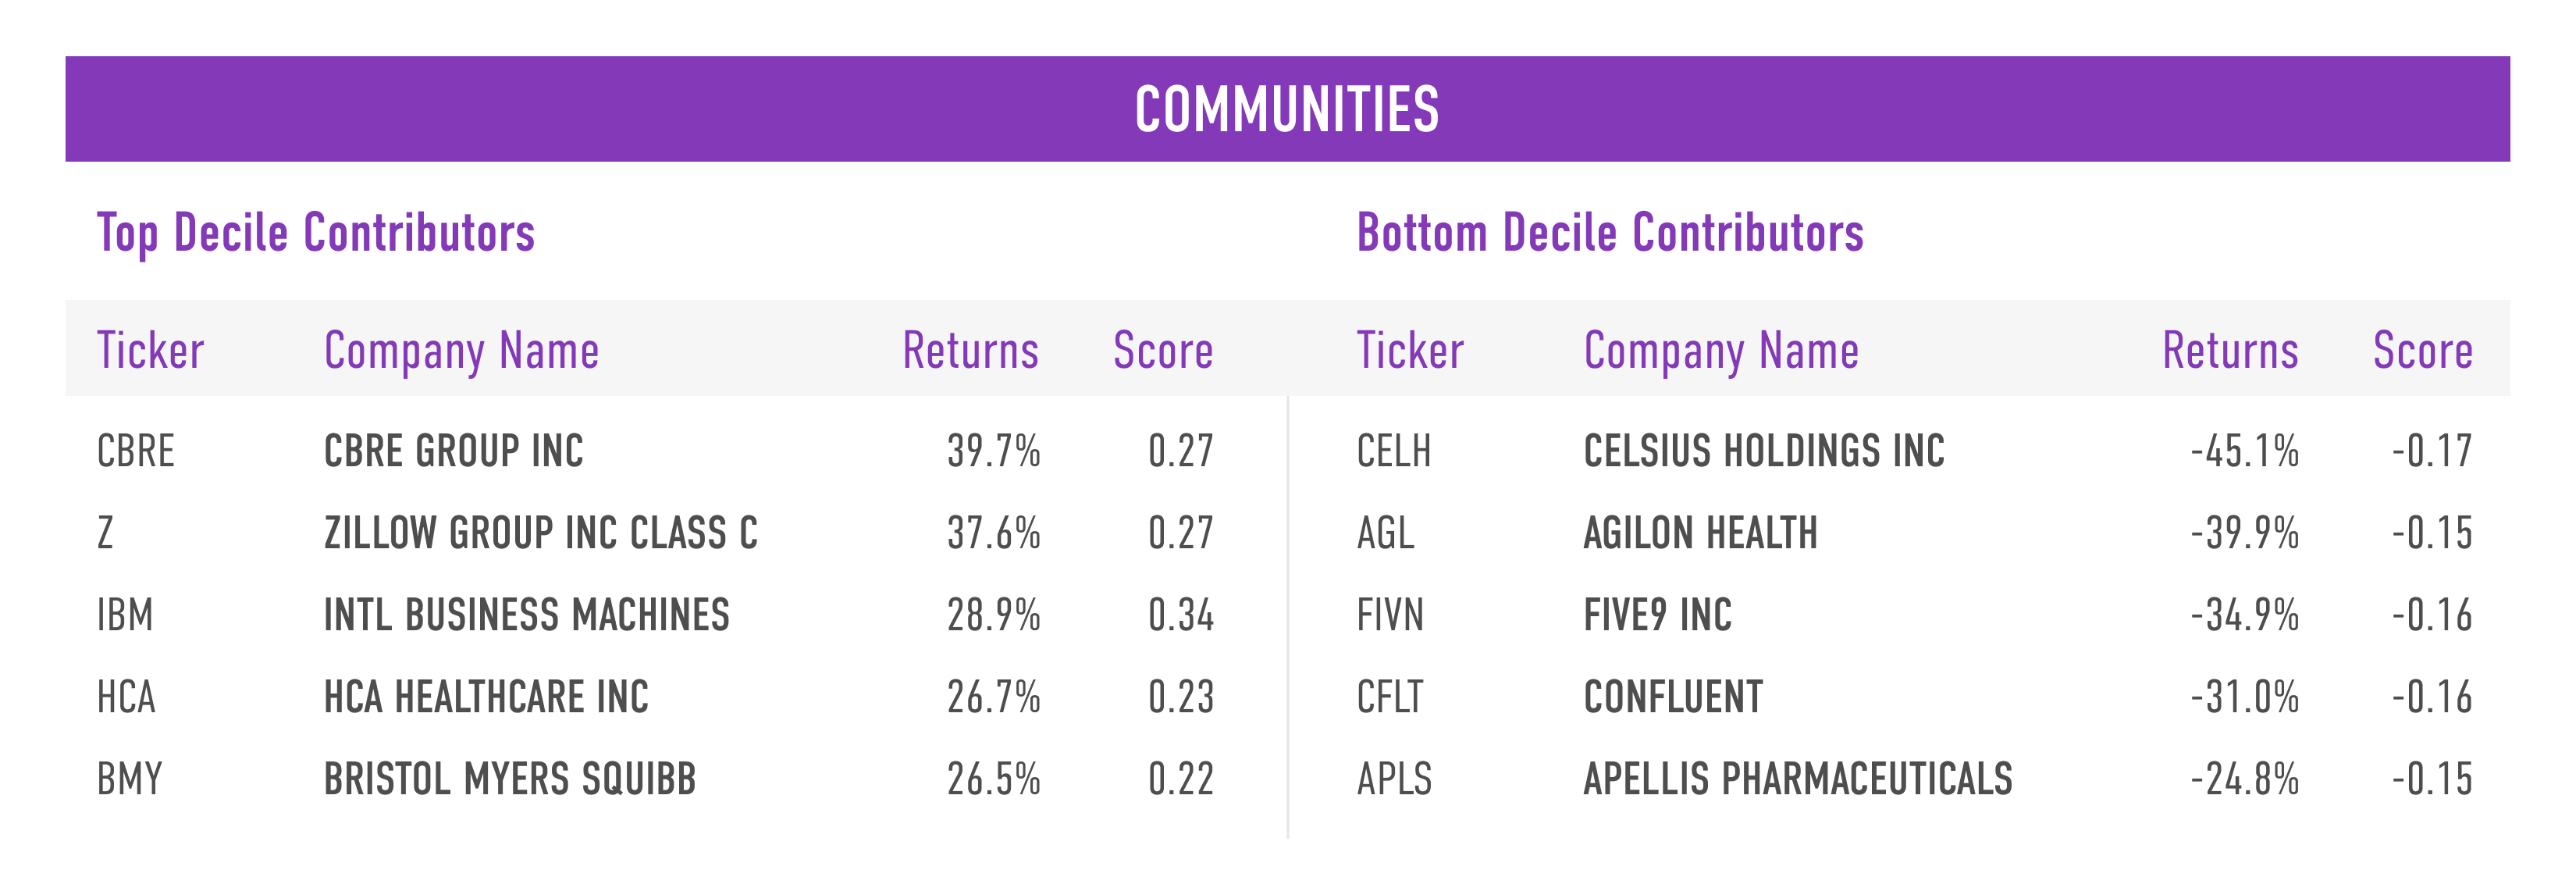
The Communities stakeholder measures a company across four Issues:
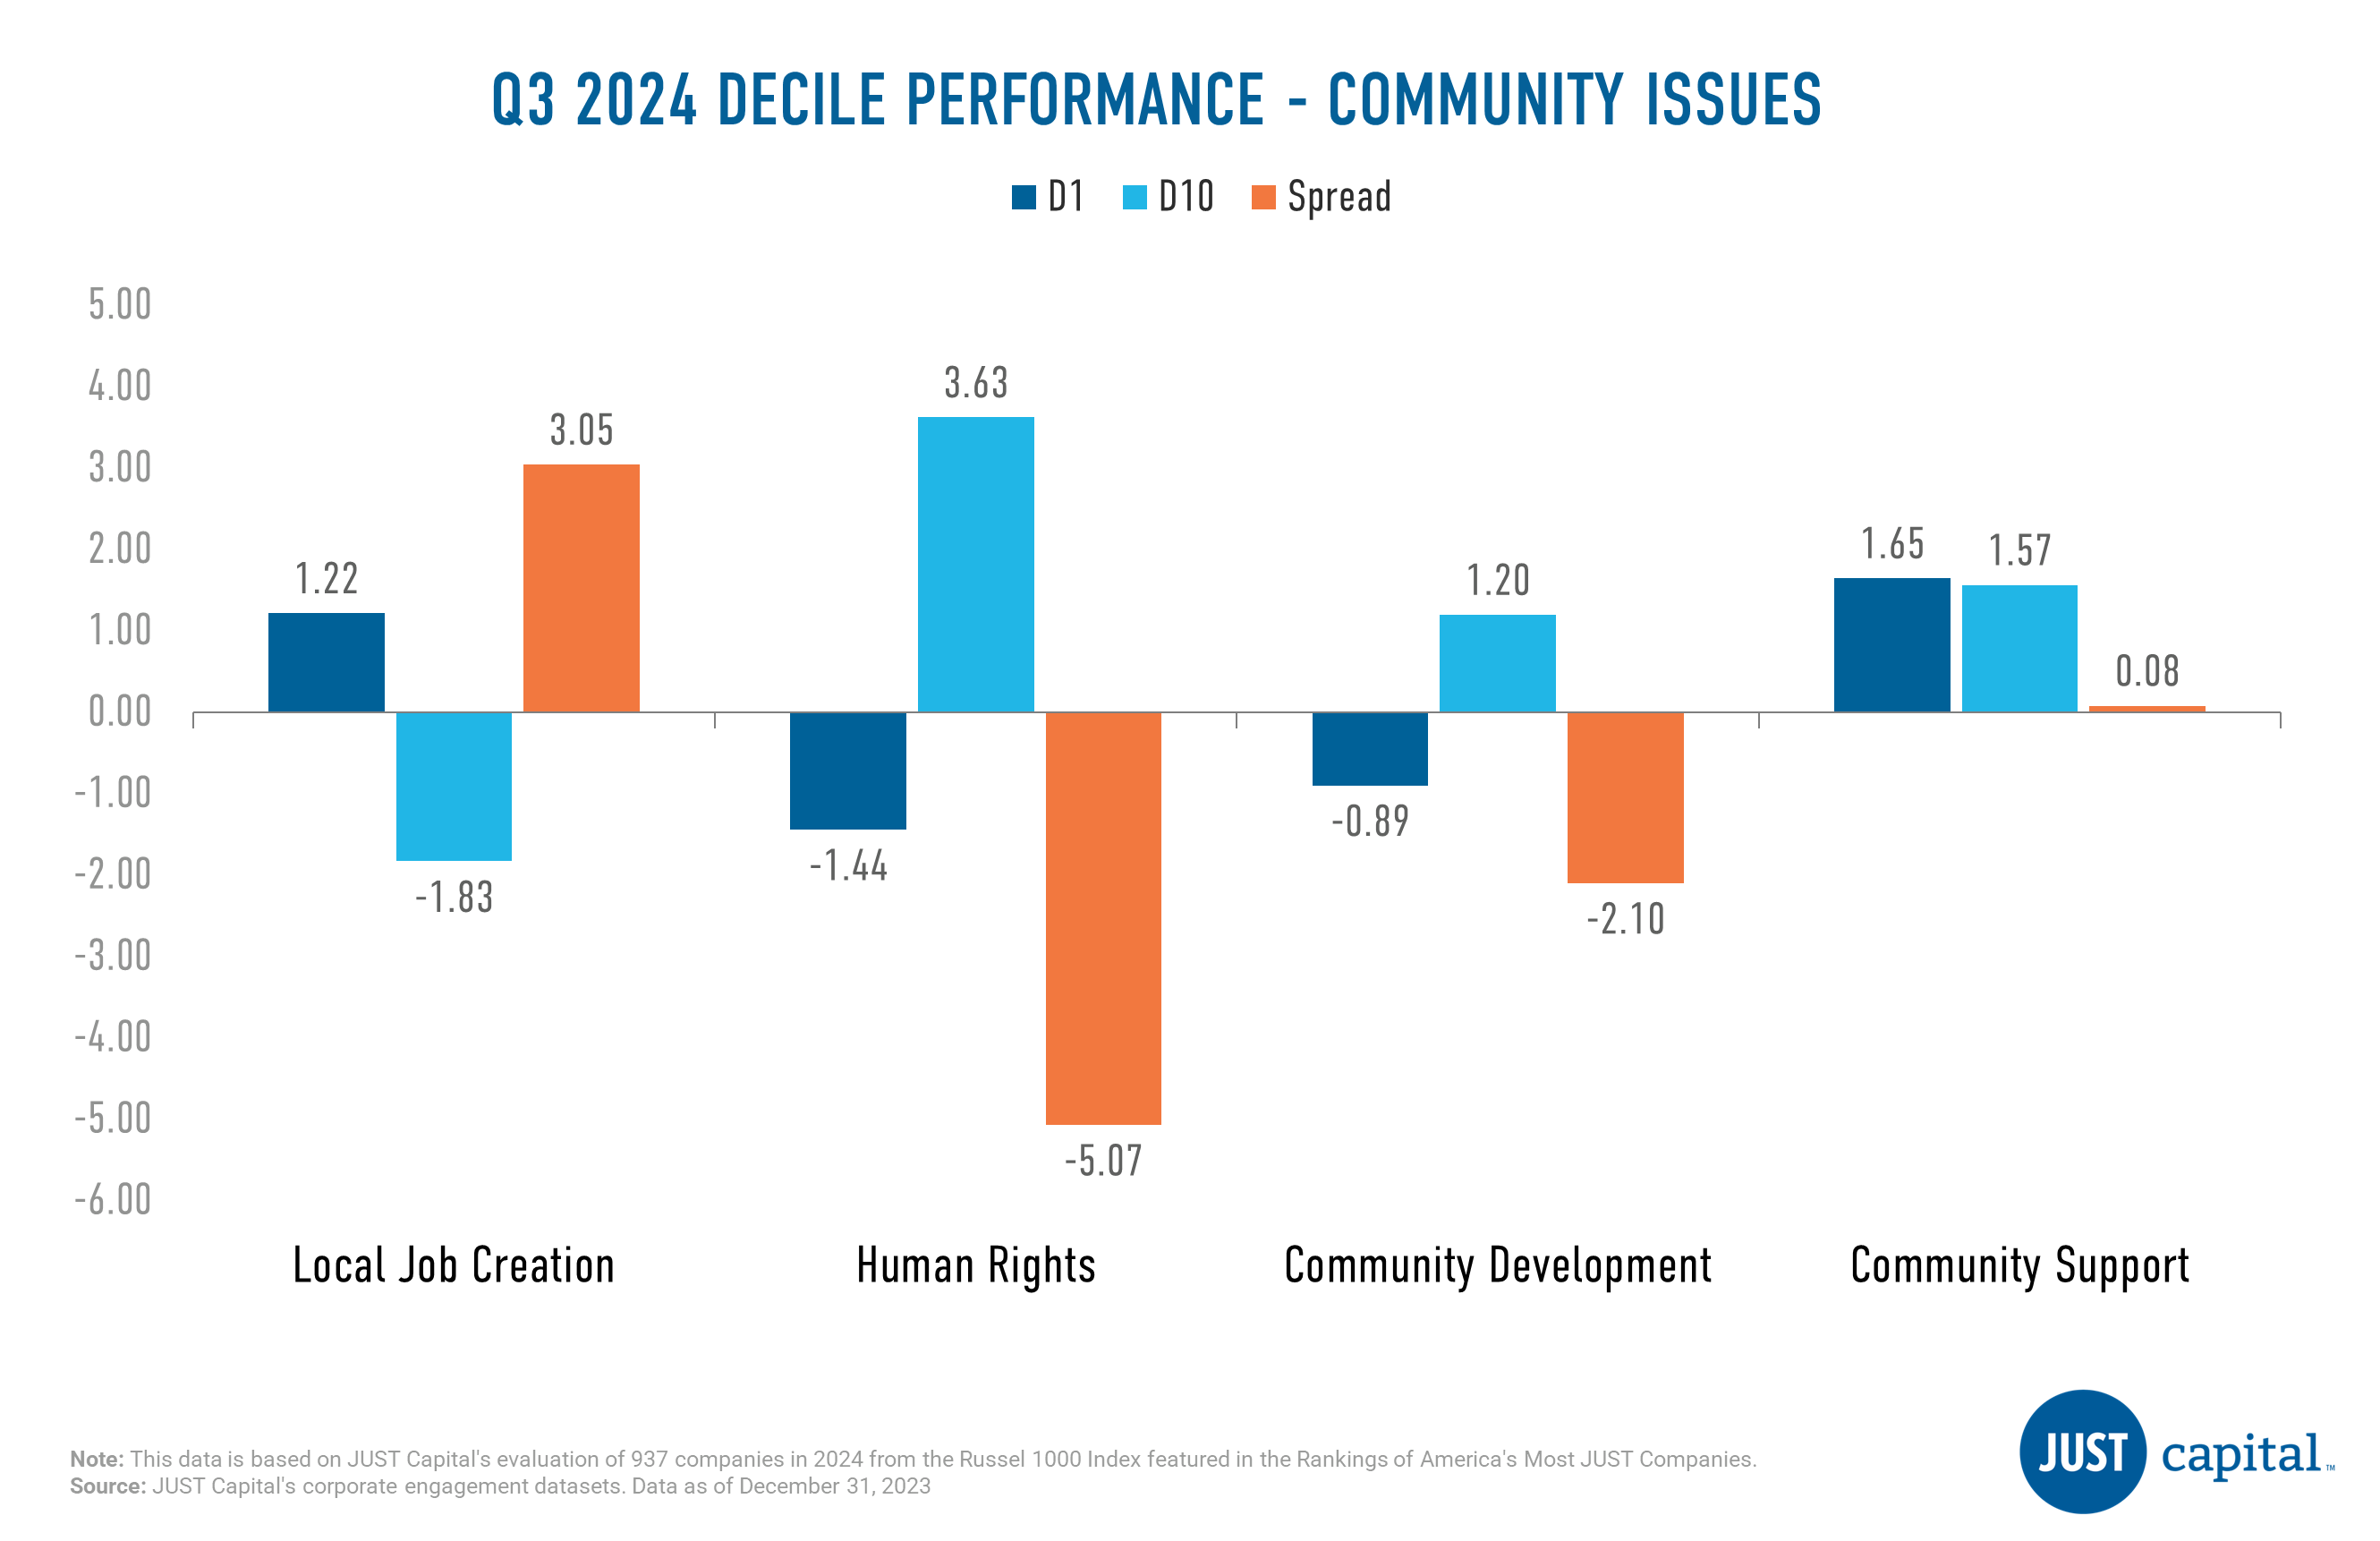
Local Job Creation was the strongest performer followed by Community Support. Human Rights and Community Development were negative contributors this quarter.
Shown below are the top and bottom five contributors to the top decile (D1), the best-ranked companies as measured by their Communities score, and the bottom decile (D10), the lowest-ranked companies as measured by their Communities score.
Shareholders and Governance
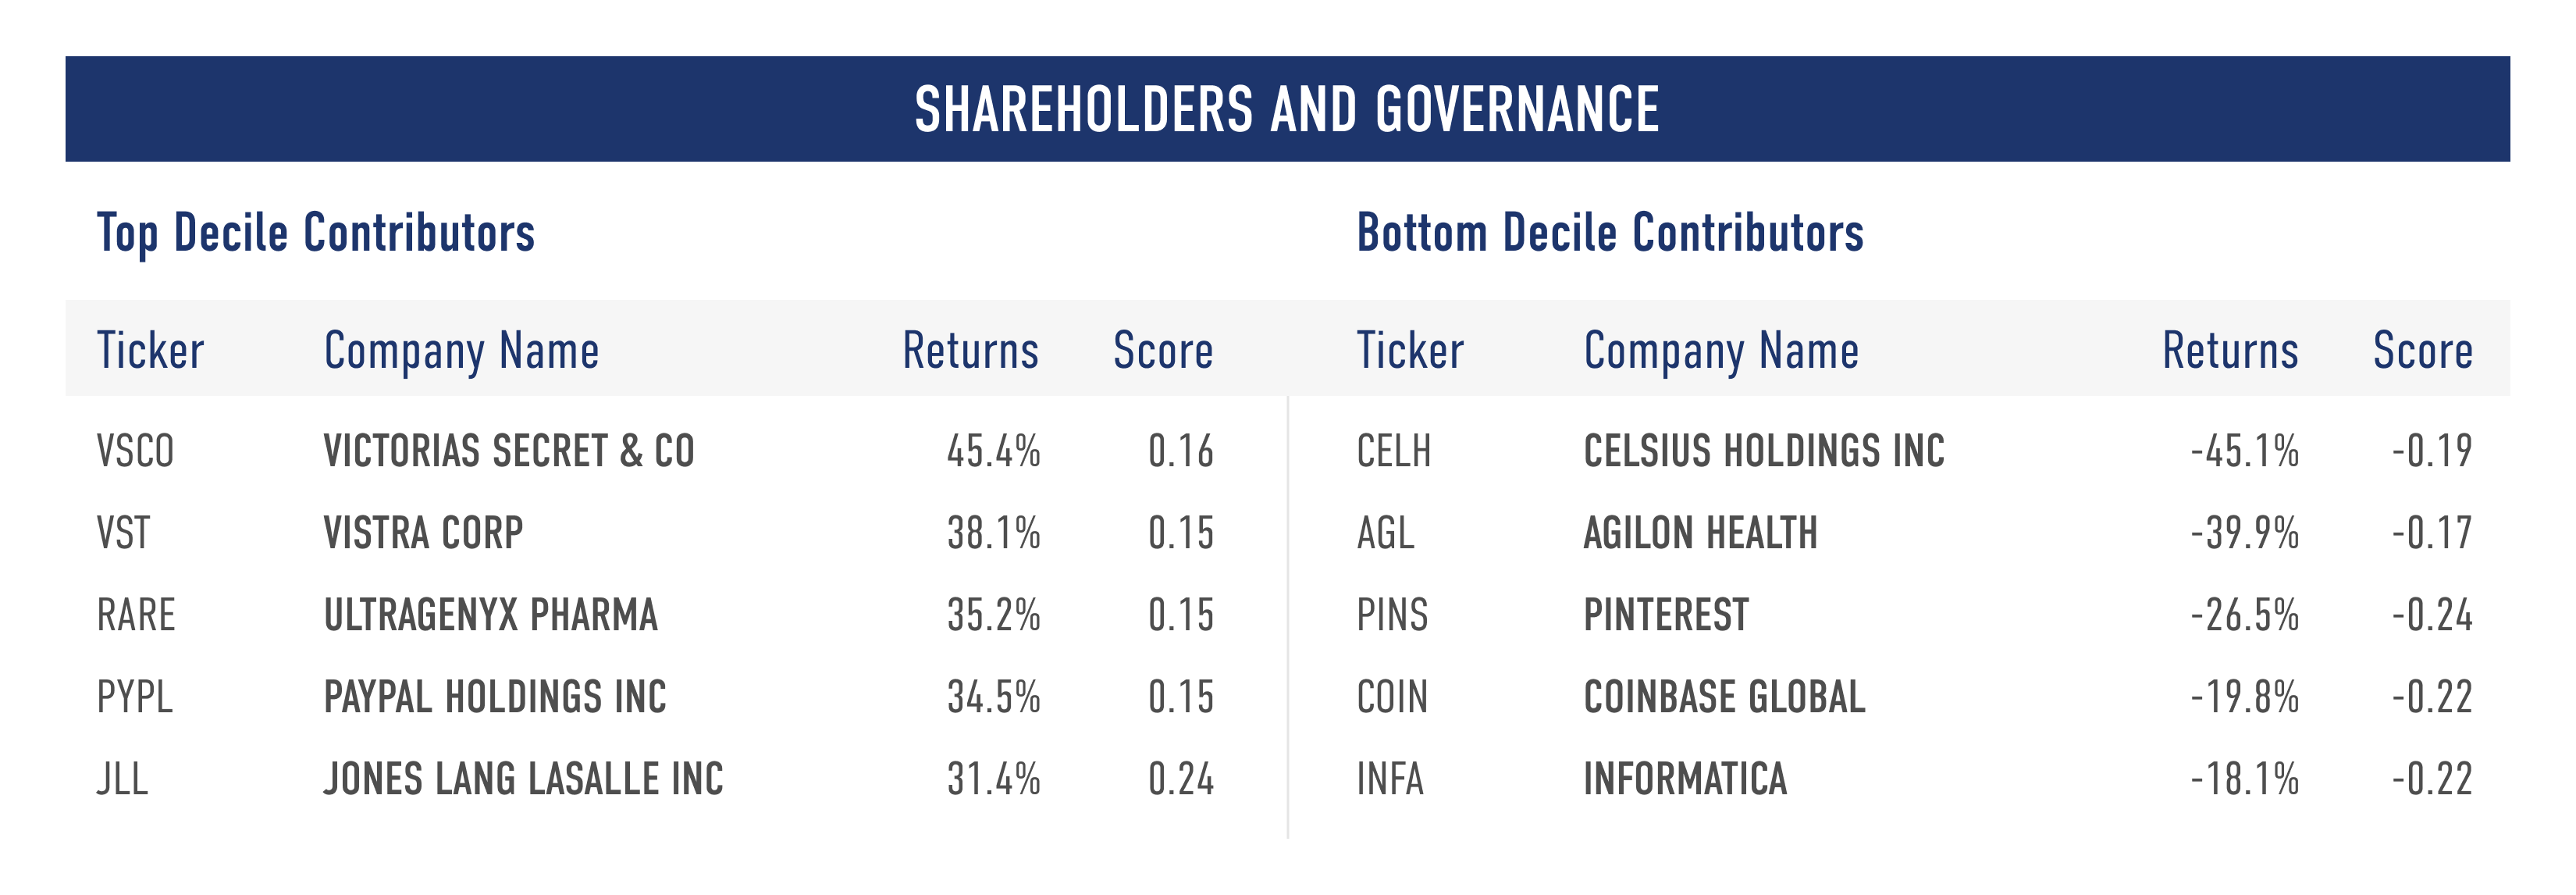
The Shareholders and Governance stakeholder measures a company across three Issues:
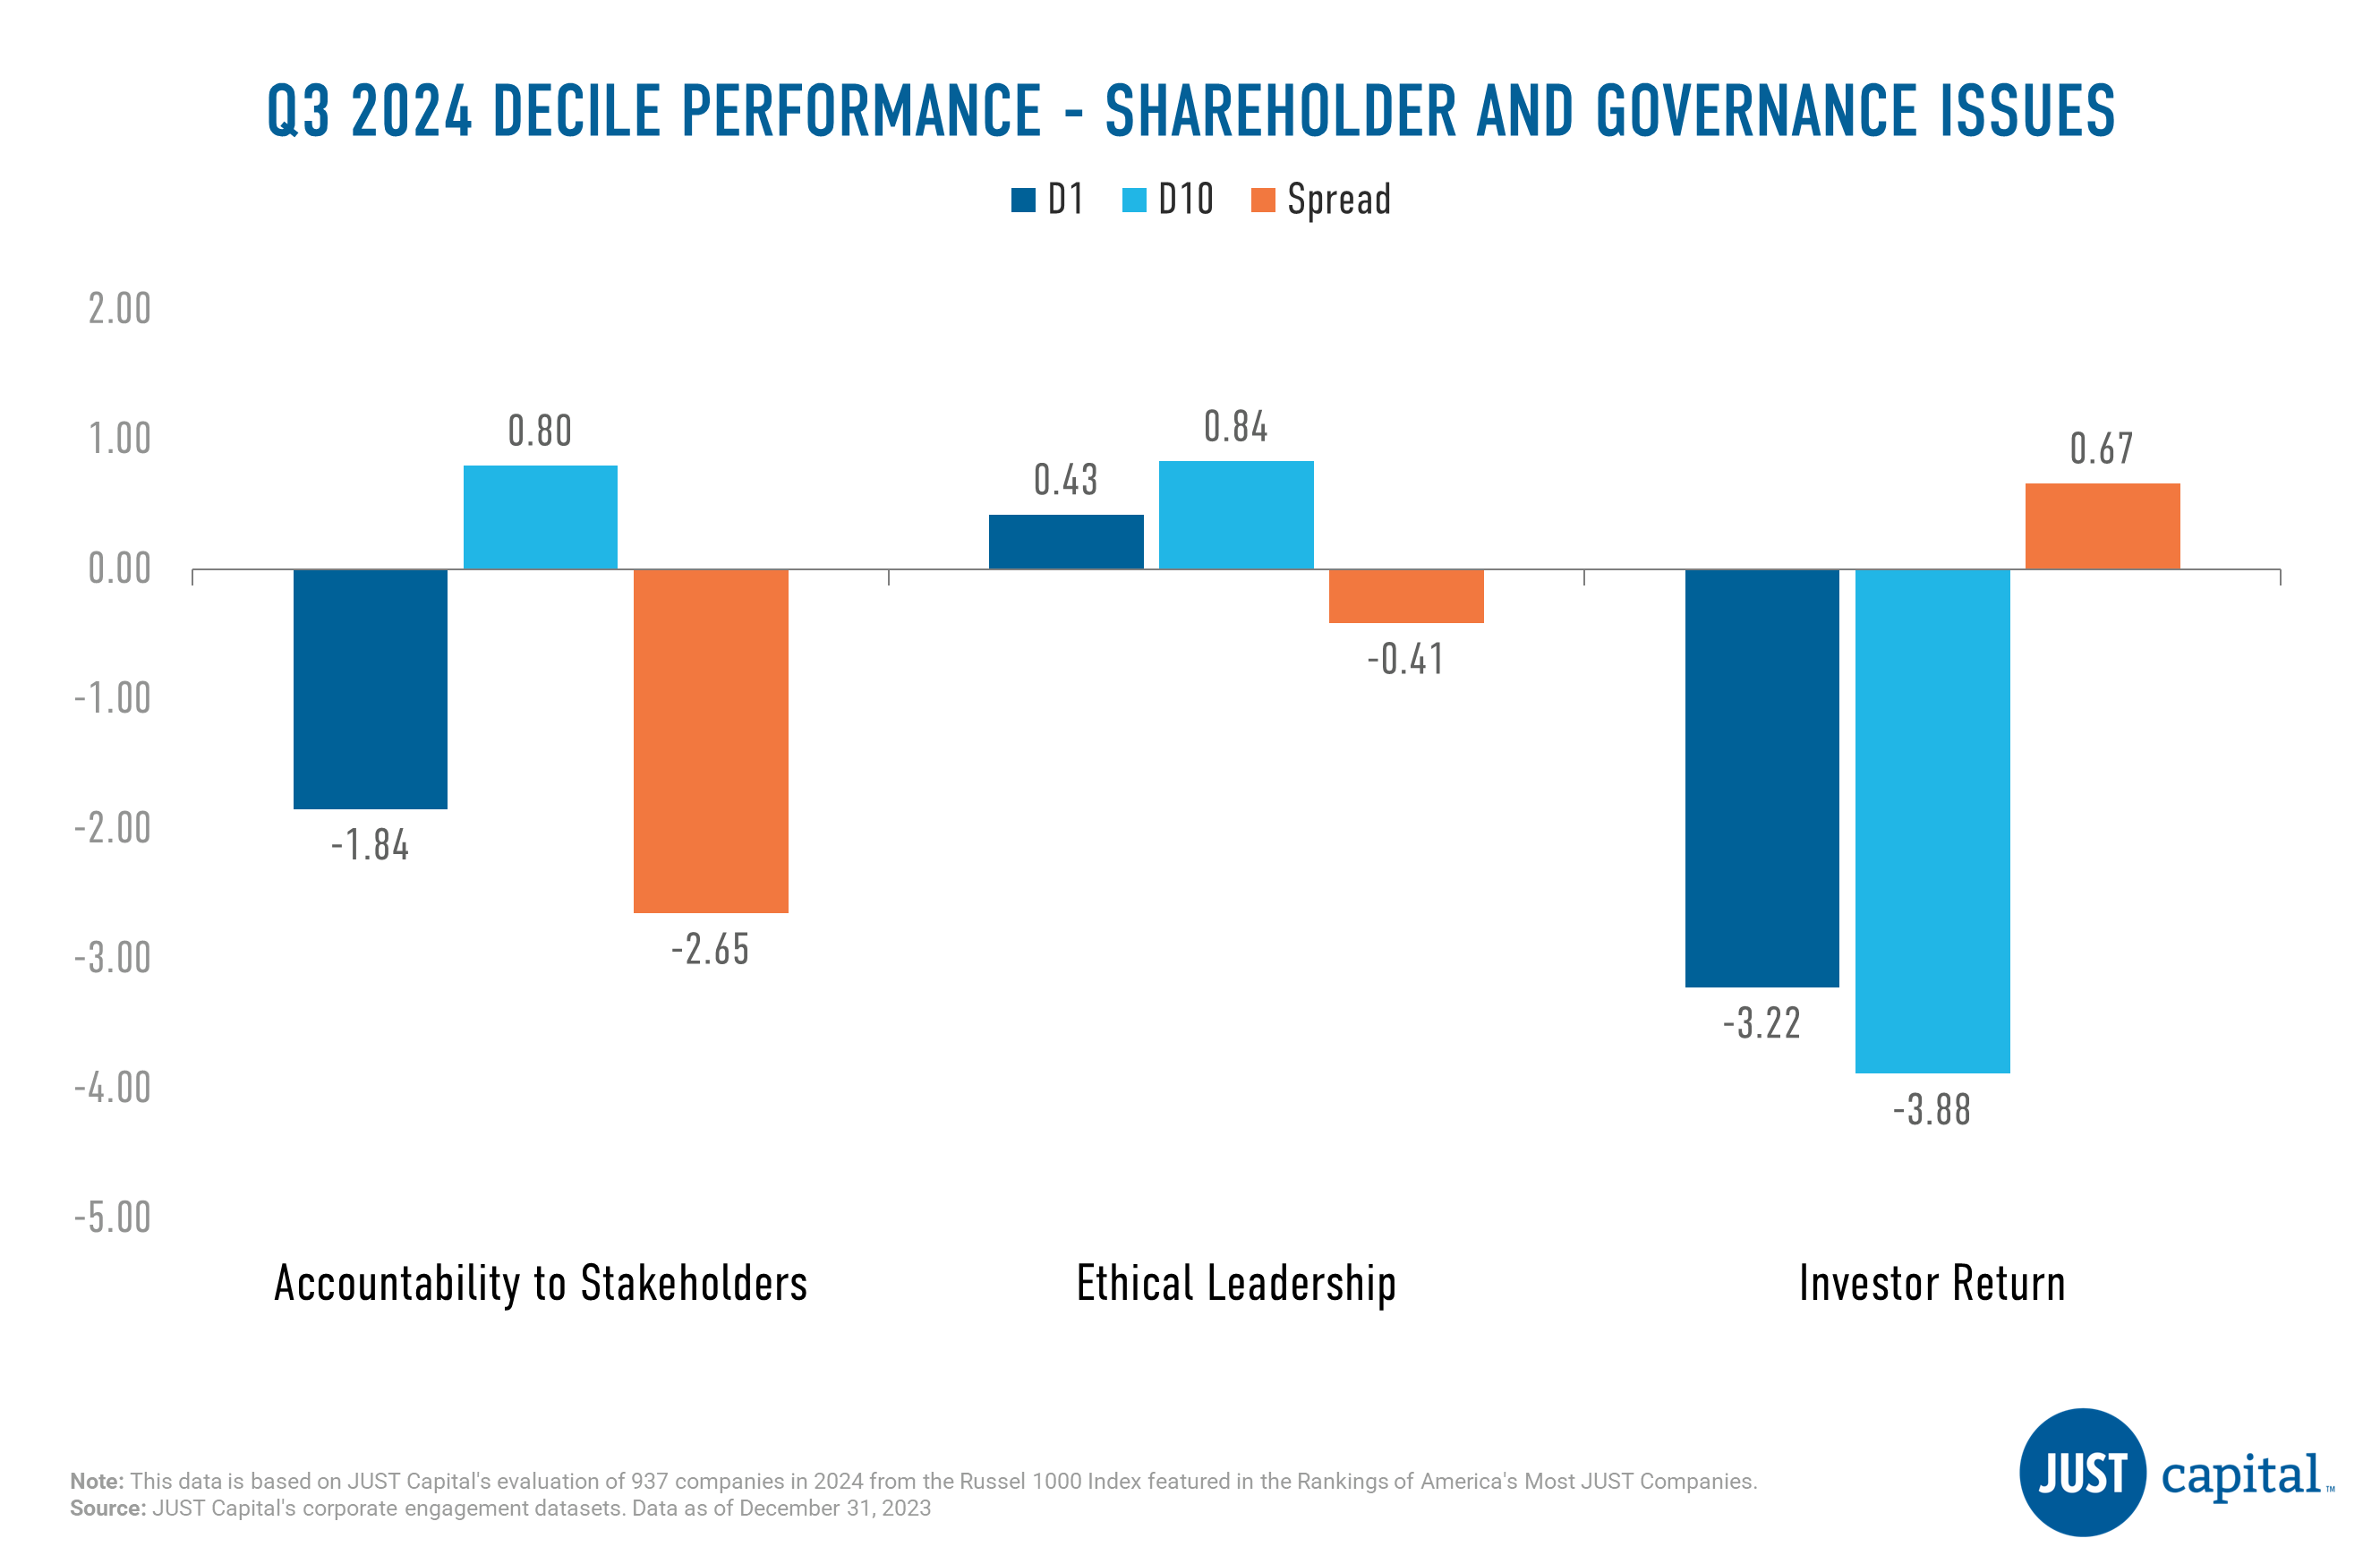
Investor Return Issue was the only positive performer in Q3 with a long-short spread of 0.67%. Remaining issues within the Shareholder stakeholder were negative this quarter.
Shown below are the top and bottom five contributors to the top decile (D1), the best-ranked companies as measured by their Shareholders and Governance score, and the bottom decile (D10), the lowest-ranked companies as measured by their Shareholders and Governance score.
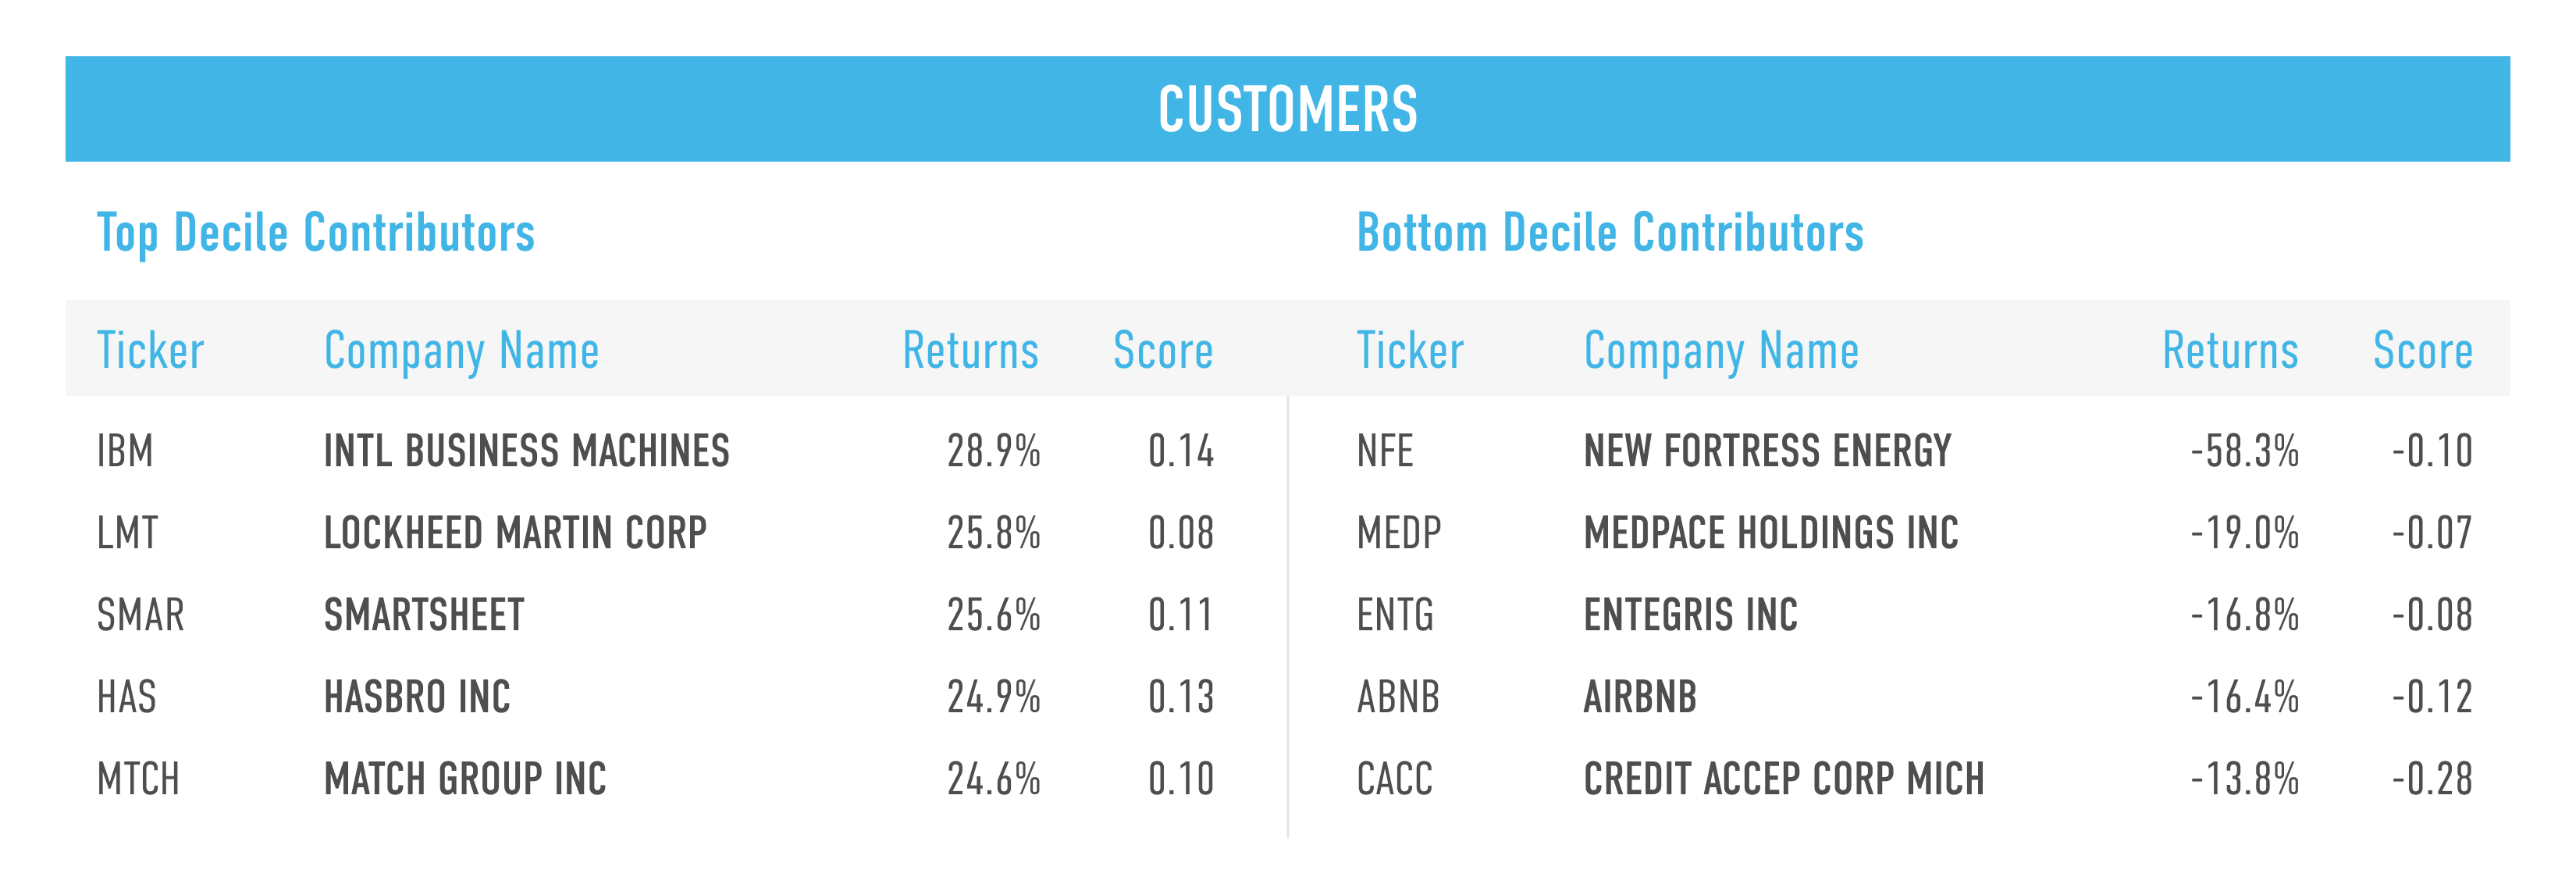
Customers
The Customers stakeholder measures a company across four Issues:

In Q3 2024, all four Customer Issues delivered negative performance. Customer Treatment was the weakest performer followed by Beneficial Products.
Shown below are the top and bottom five contributors to the top decile (D1), the best-ranked companies as measured by their Customers score, and the bottom decile (D10), the lowest-ranked names as measured by their Customers score.
Environment
The Environment stakeholder measures a company across four Issues:
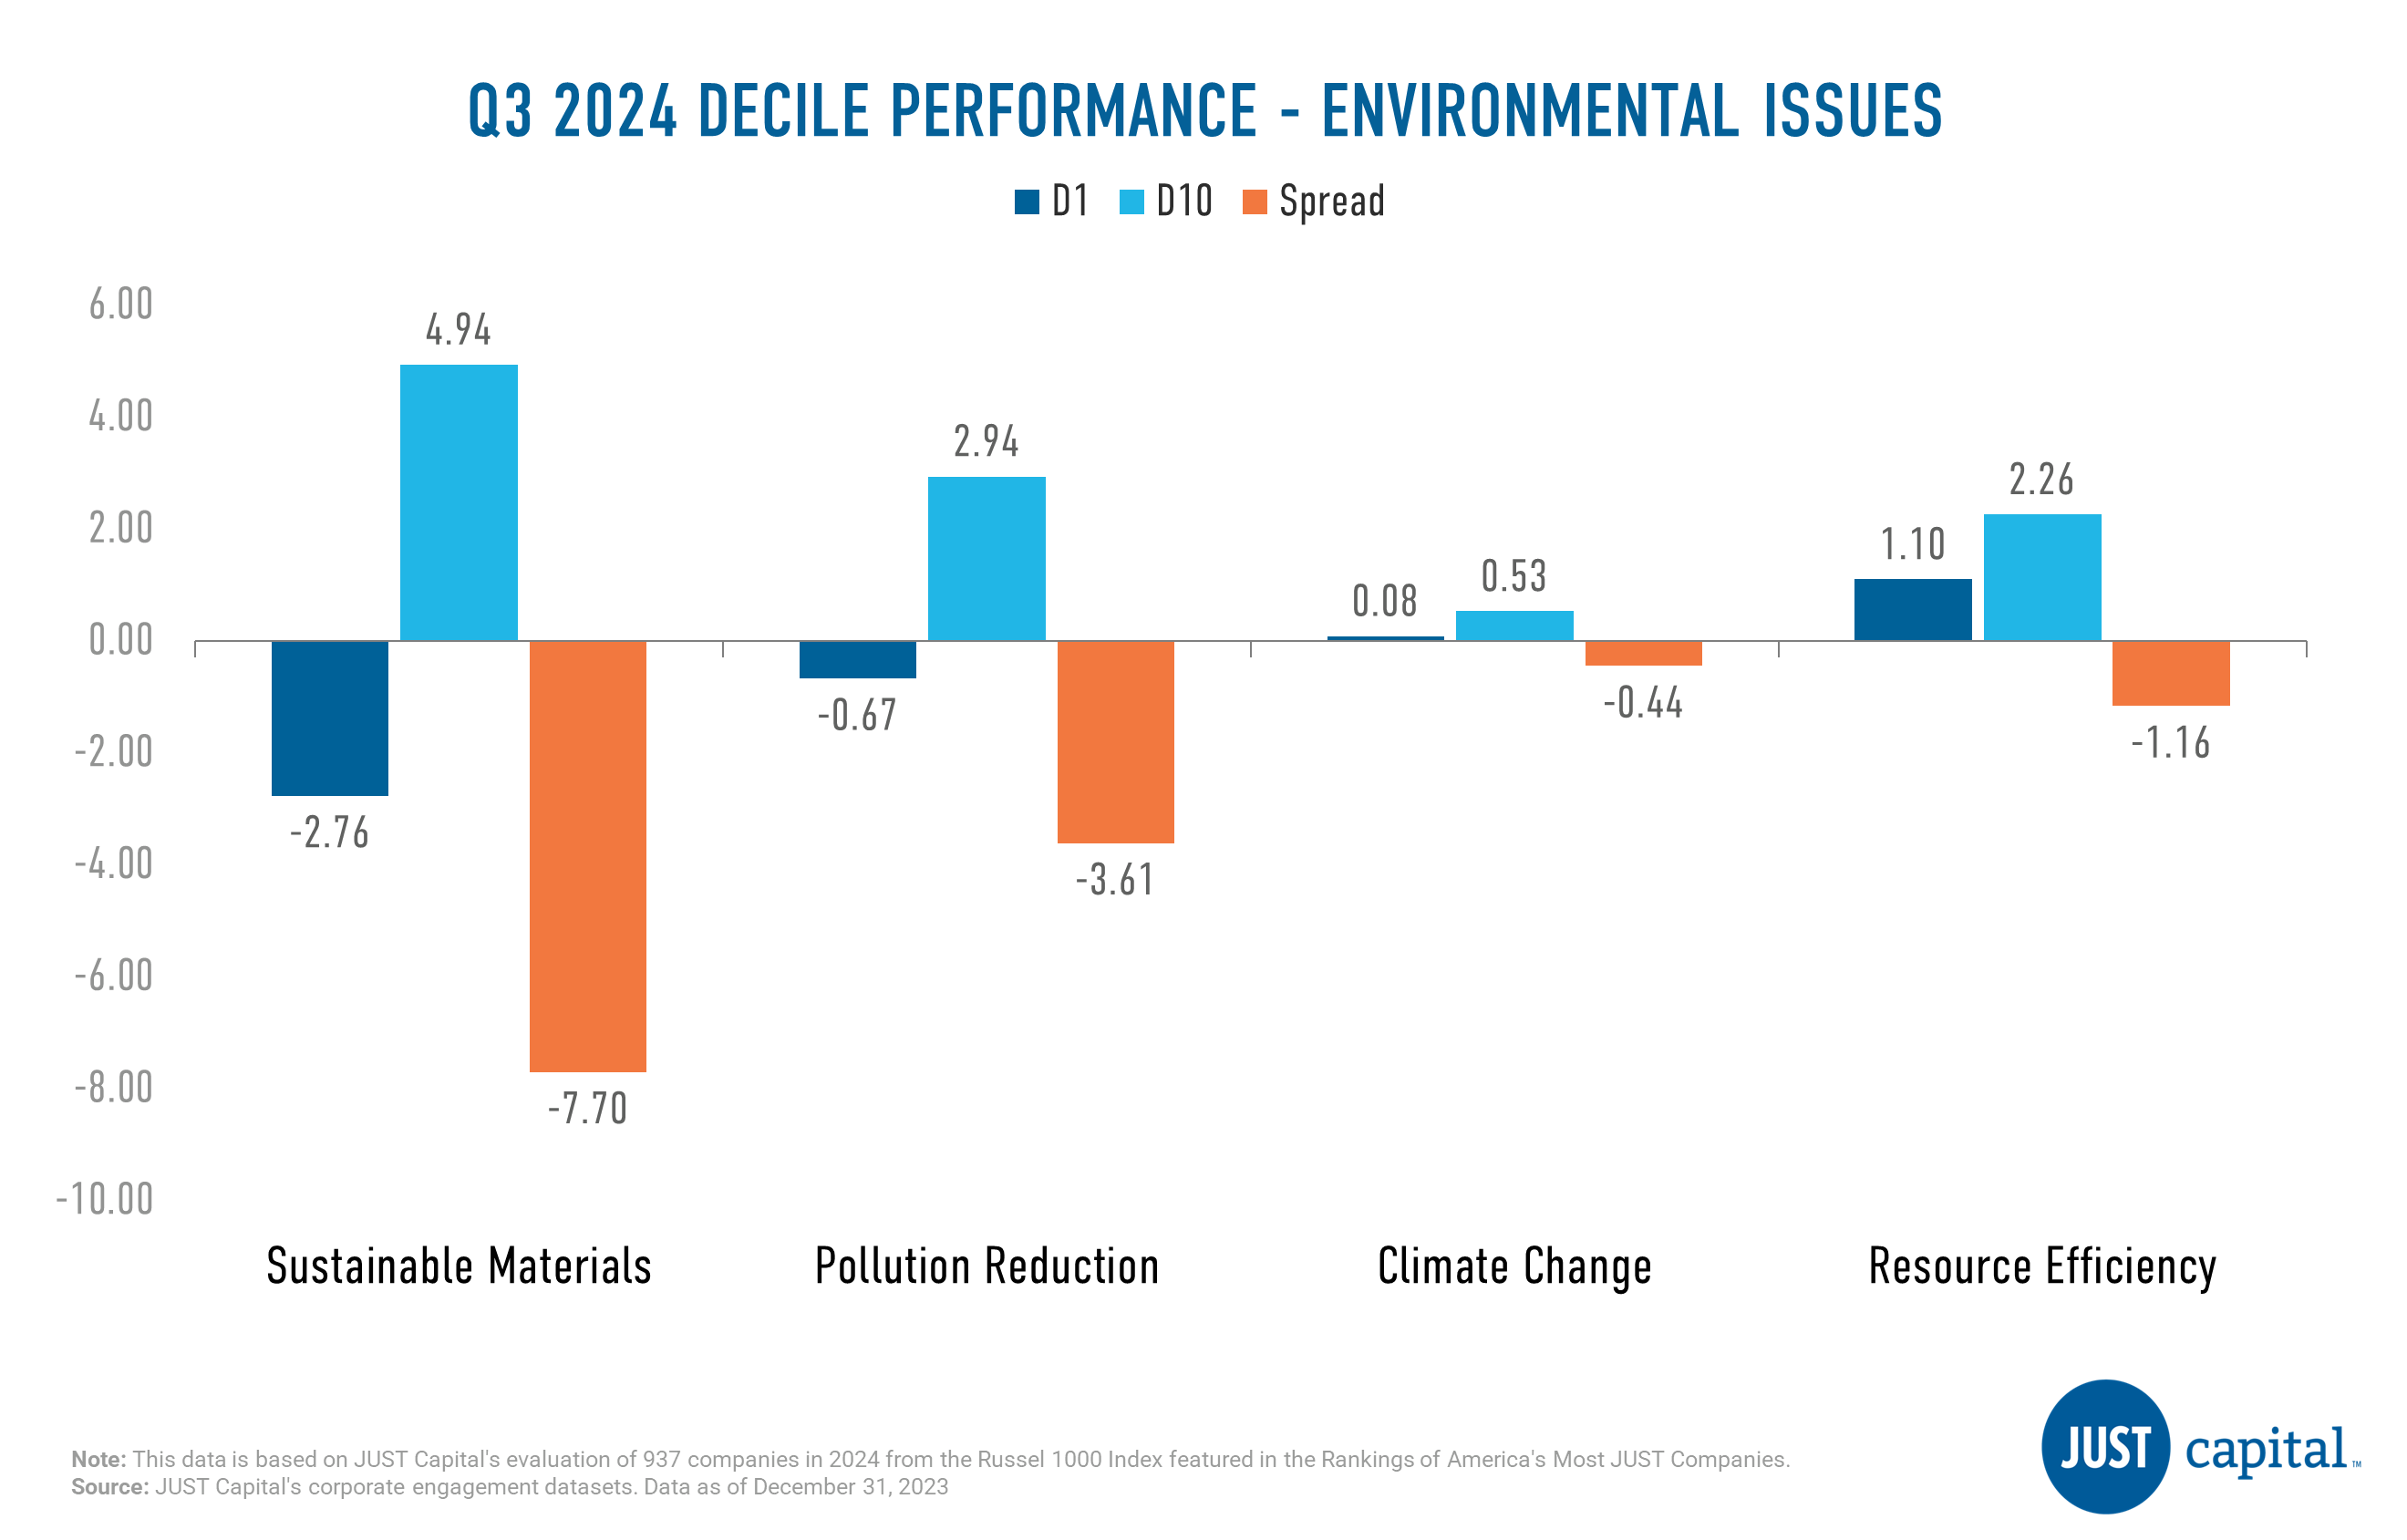
In Q3 2024, we saw all four Environmental issues deliver negative performance. Sustainable Materials was the worst performing issue within Environment stakeholder this quarter.
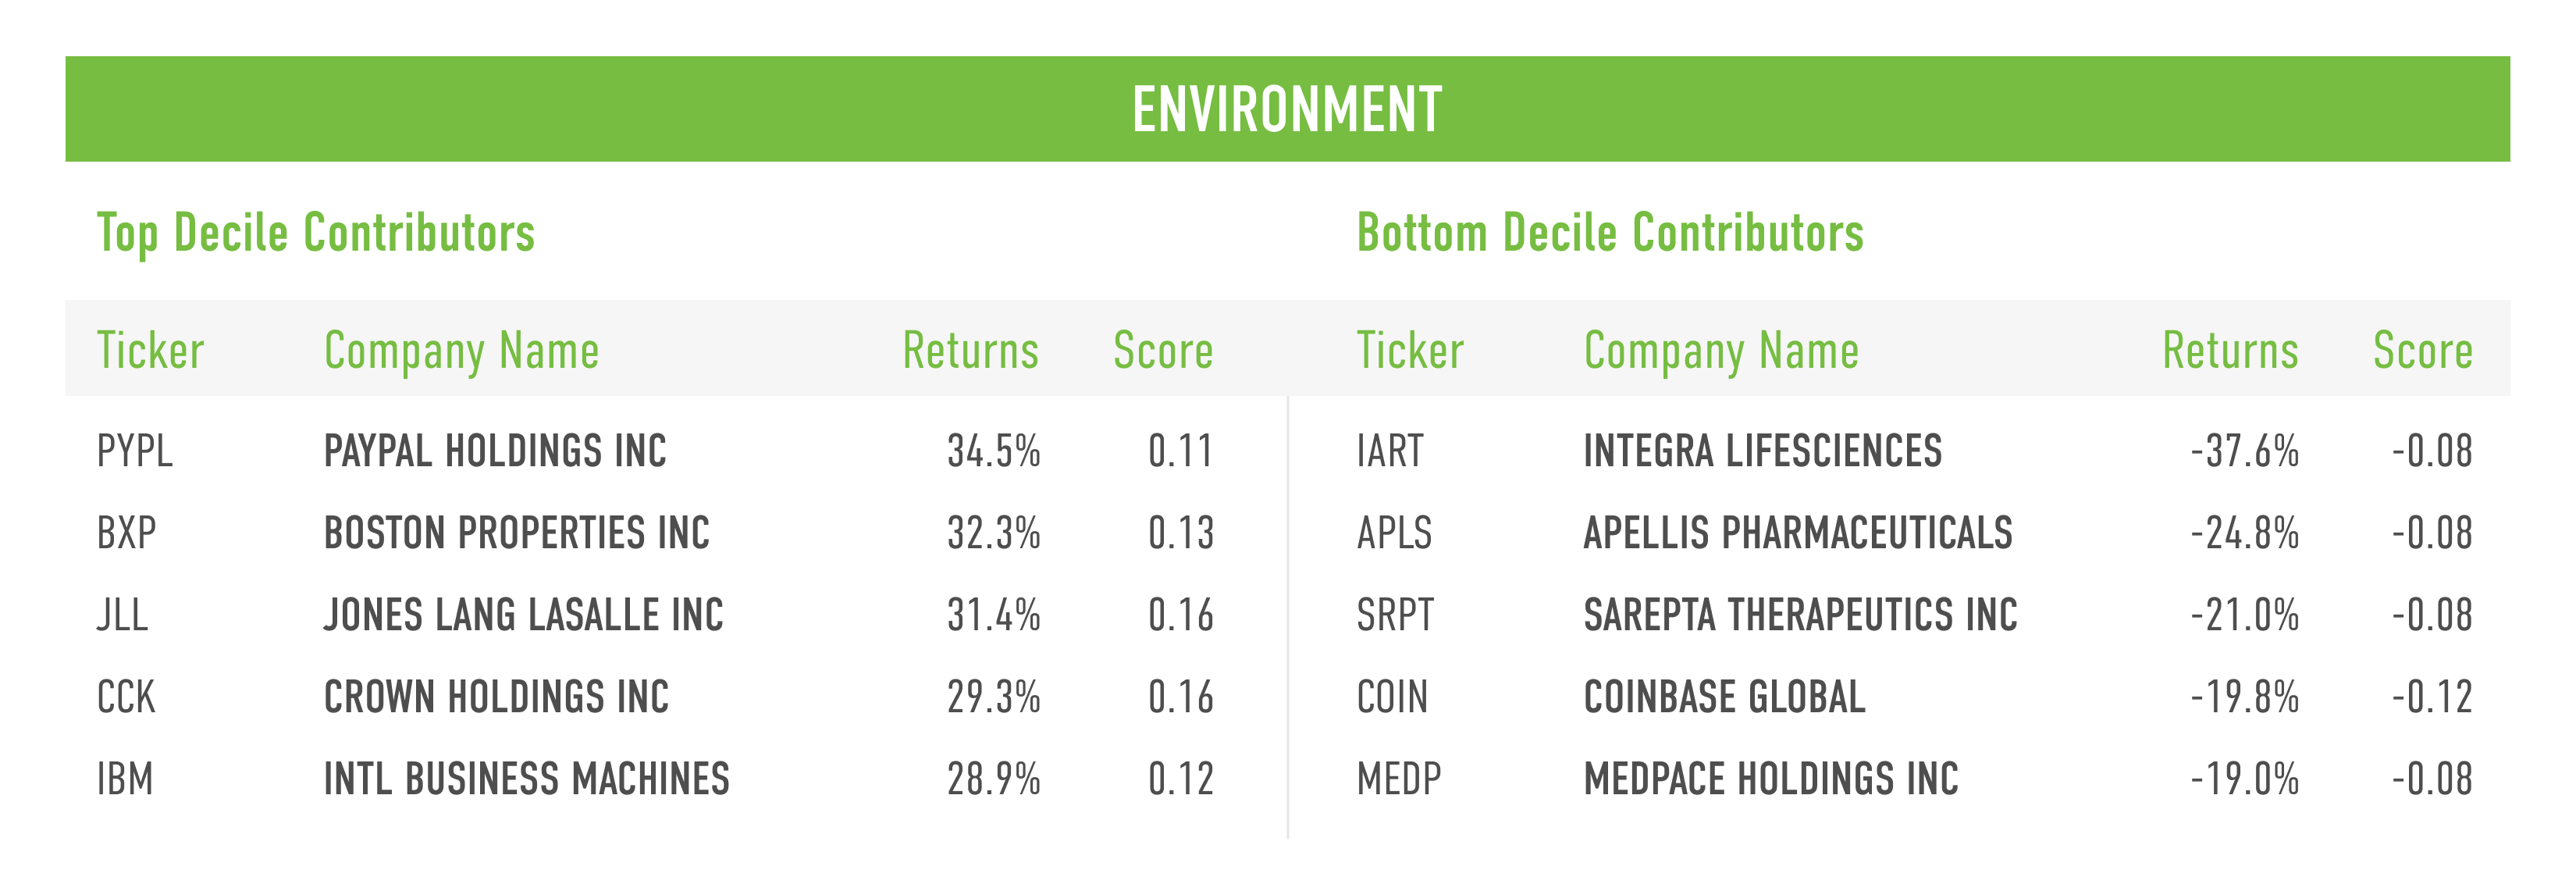
Shown below are the top and bottom five contributors to the top decile (D1), the best-ranked companies as measured by their Environment score, and the bottom decile (D10), the lowest-ranked companies as measured by their Environment score.
Computation Methodology
We monitor the performance of these stakeholders and Issues on a long-short basis. The long and short portfolios are selected based on the factor scores as the top and bottom deciles within the universe of companies we track in the Russell 1000. Top decile (D1) companies are those that rank highest based on the factor score, and bottom decile (D10) companies are those that rank lowest based on the factor score.
D1 Performance is computed as
(Equally weighted average of returns of stocks in D1 bucket) – (Equally weighted average of returns of all stocks within the Universe)
D10 Performance is computed as
(Equally weighted average of returns of stocks in D10 bucket) – (Equally weighted average of returns of all stocks within the Universe)
Spread is computed as
D1 Performance – D10 Performance
Can JUSTness be used to identify performance leaders within negative earning companies? We think so. In fact, according to our recent analysis, among the negative earners in the Russell 1000 (our coverage universe), JUST leaders have outperformed laggards by almost 40% since January 2020.
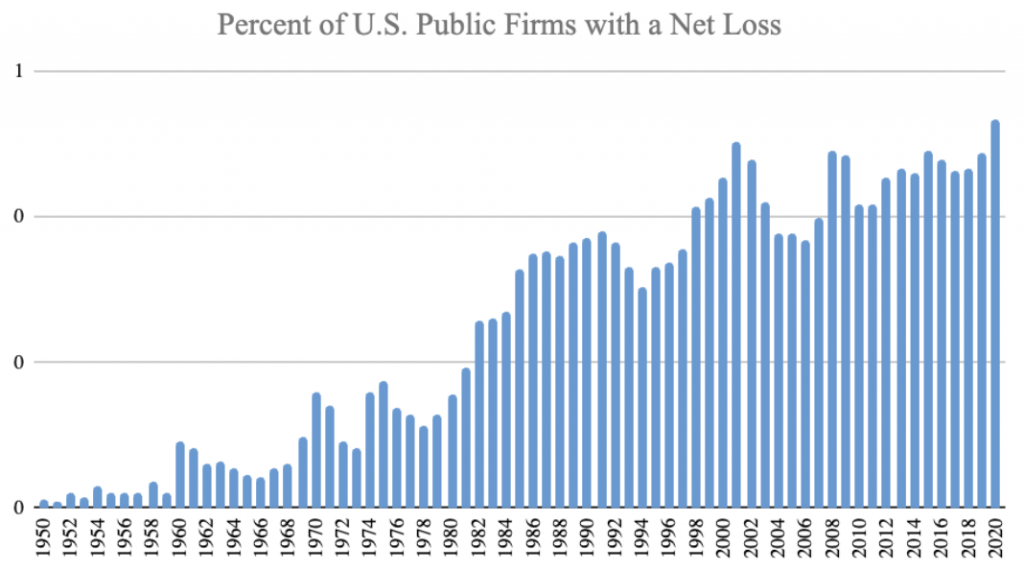
One of the rulemaking petitions from the SEC’s Human Capital Accounting Working group highlighted the fact that in 2020, more than half of U.S public companies reported negative earnings. Many of them are relatively young, technology-heavy firms, where investors are betting on future profitability. Traditional valuation techniques, like PE multiples, are less effective in valuing these firms; rather, investors rely on alternative approaches to form a view, things like investments in management quality, intellectual property and other forms of intangible value. In truth, major value-creating exercises of any modern firm – including research and development, and human capital – appear solely as expenses on the balance sheet – as if they provide no future value.
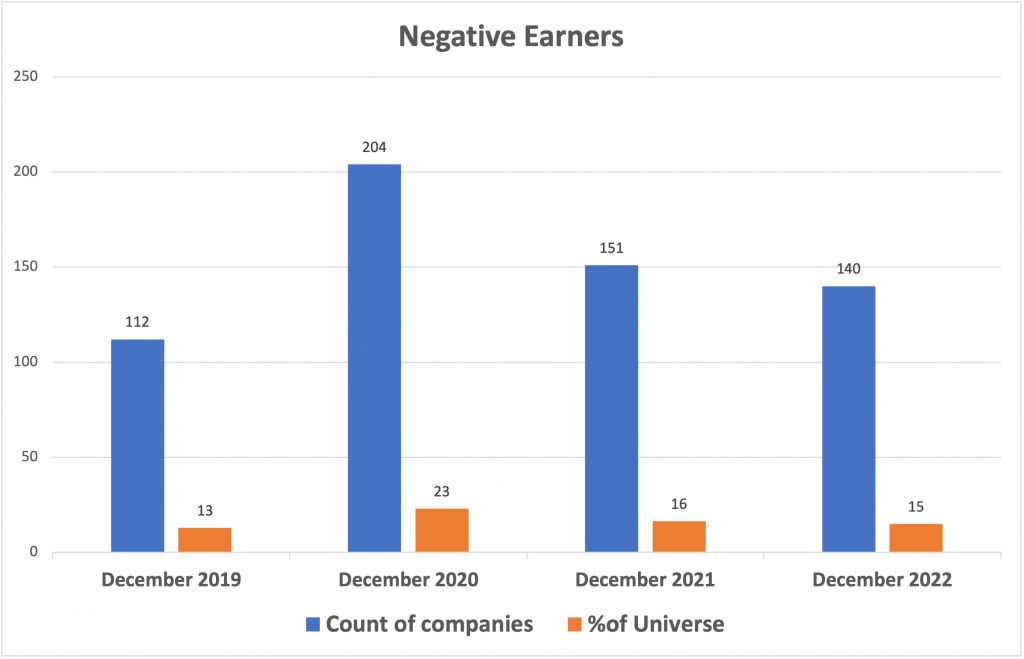
We looked at the number of negative earners within the Russell 1000 every year over a four year period using as a metric Net Income as of year-end, which is when our rankings are typically updated. The total number of companies on the list ranged from a low of 112 in December 2019 (13% of our universe) to 204 (23%) in December 2020.
This overall list was then split into two halves using Overall JUST score as the sole sorting variable, and the aggregate stock market performance of each half determined.
What we found was that the basket of negative-earning companies comprising those ranked in the top half outperformed those in the bottom half by a massive 39.84% between January 2020 and September 2023.
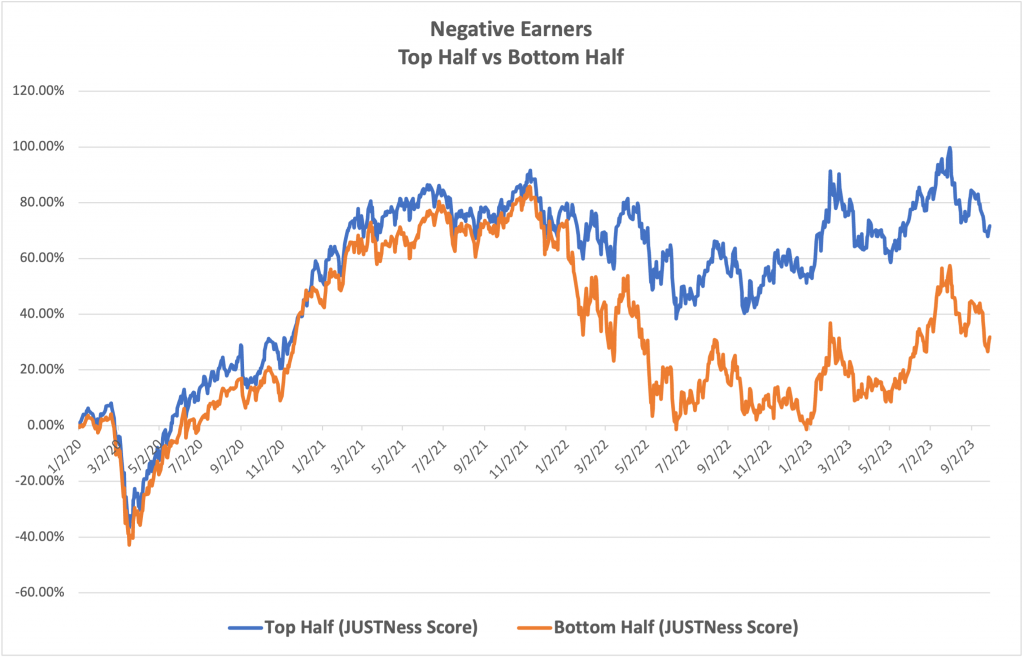
Why might this be? We think the best way to think about it is that negative earning companies with high overall JUST scores can be real diamonds in the rough. Put another way, high JUST scores can signal hidden opportunities. While their financial statements might currently be in the red, their commitment to their workers, to the communities where they operate, to becoming more environmentally sustainable and better governed all stand the companies in good stead for future growth and recovery. Investors can use JUST Overall scores to distinguish between performance leaders and laggards within this challenging segment.
As the investment landscape continues to evolve, integrating stakeholder alignment considerations into decision-making processes becomes not just a choice, but a strategic imperative for savvy investors aiming for sustainable and profitable portfolios.
As companies navigate their commitments to stakeholder capitalism as strategy beyond shareholder primacy faces a resurgence of political blowback, it’s worth considering how the corporations we’ve found to be “just” are actually performing.
To do that, we’re taking a look at how the JUST U.S. Large Cap Diversified Index (JULCD) and JUST 100 Total Returns Index (JUONETR) have been performing against their Russell 1000 benchmark, as well as how leading companies perform against their less just peers at the bottom of JUST Capital’s Rankings of America’s Most JUST Companies. What we’ve found is that companies that prioritize all their stakeholders – we measure performance for Workers, Customers, Communities, Shareholders, and the Environment – not only don’t suffer consequences for investments beyond short-term profit maximization, they even tend to outperform their peers.
Below, we show the performance of the top (D1) and bottom (D10) deciles of JUST’s Rankings using our Overall Weighted Score and the Russell 1000 Equal Weighted Index from Jan 2018 to June 2022. D1 is composed of the top 10% of the companies we rank whereas D10 consists of the bottom 10%.
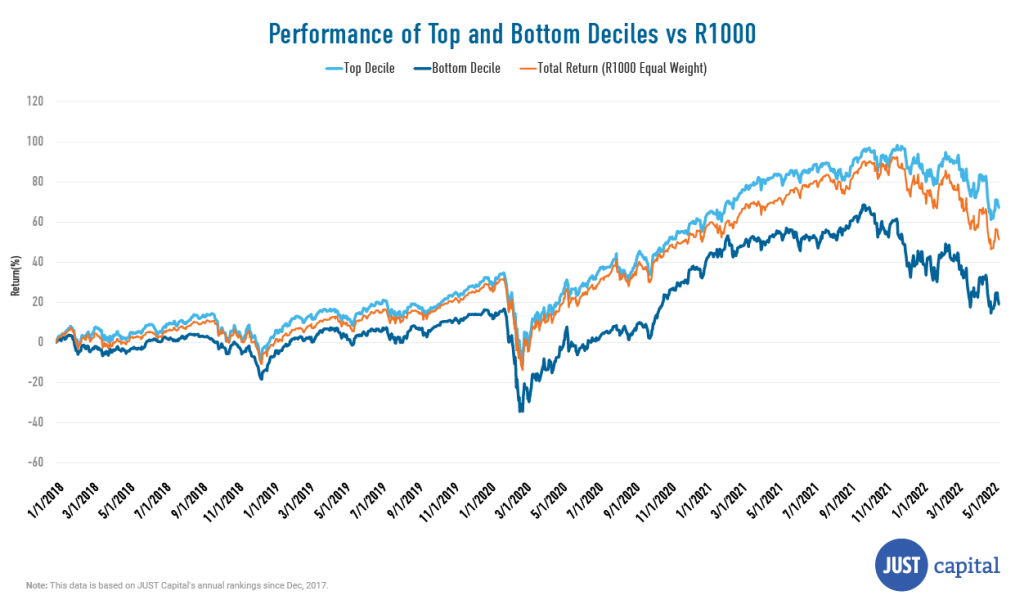
The JUST Overall Weighted Score takes into account the 20 core Issues identified through our survey research as top priorities for just business – including paying a living wage, creating a diverse, inclusive workplace, and helping combat climate change – across key business stakeholders. This score delivered a spread of 48.09% between D1 and D10 over the period ending June 30, 2022.
D1, with returns of 67.12%, has outperformed the R1000 Equal Weighted Index (returns of 51.26%) by 15.86%. D10, which has returns of 19.02%, has underperformed the Russell 1000 Equal Weighted Index (returns of 51.26%) by 32.24%.
Using the Rankings and the Overall Score we have created JUST Capital’s investable indexes and financial products, which enable investors to implement our research and methodology and drive dollars toward just companies. These indices have demonstrated the investor case for just business behavior, showing that the companies prioritizing these core Issues can be more resilient over the long term.
Our flagship index, the JULCD, began live trading in November 2016 and tracks the top 50% of Russell 1000 companies ranked by JUST Capital by industry, and is constructed to match its industry weights. It has outperformed the benchmark since inception by 7.53% as of June 30, 2022.
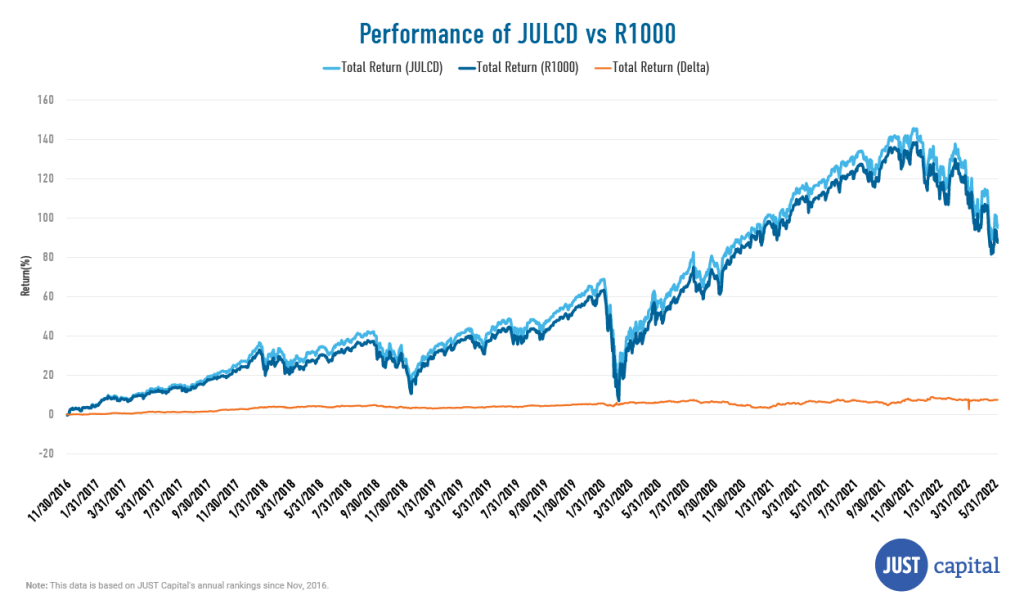
The JULCD Index also provides the basis for the Goldman Sachs JUST U.S. Large Cap ETF (JUST ETF), which seeks to provide investment results that closely correspond, before fees and expenses, to the performance of the JULCD.
The second live index that we have created is the JUONETR, which was constructed to track JUST Capital’s top-performing companies. It is an equal weighted index that launched in March 2019 and includes the top 100 Russell 1000 companies ranked by JUST Capital in its annual Rankings.
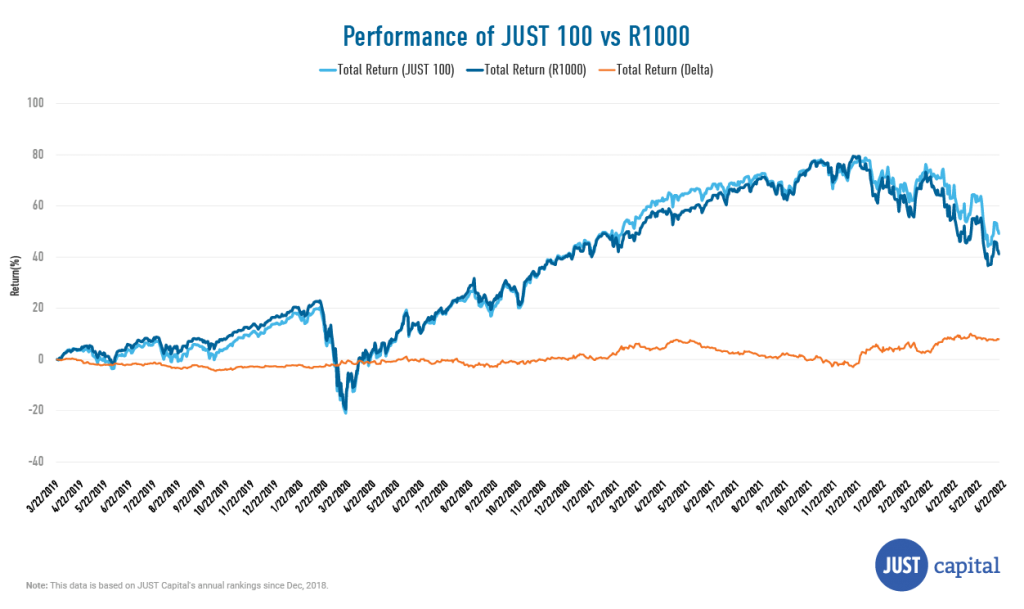
The JUST 100 Index has outperformed the benchmark since inception by 8.01% as of June 30, 2022.
The Investor Solutions team at JUST Capital continues to expand the suite of products tracking our in-depth company research and polling of the American public. We firmly believe that together we can create a more just and equitable marketplace that works for all Americans. Please reach out using this request form below if you have an interest in partnering with us to launch the next stakeholder-driven strategy.

(Brandon Bell – Getty Images)
We’re closely tracking how inflation is affecting company performance on key stakeholder categories, and I want to highlight two specific areas this week.
The first relates to workers. A soon to be published JUST Capital survey shows that 87% of Americans say large U.S. companies have a responsibility to regularly increase wages to keep up with the rapidly rising cost of living.
While this may be hard to do in the current economic environment, it is happening. And as we note in an article with more inflation-related polling this week, it can be smart business. As CBS News reported, over the past few months several companies have lifted wages and provided other financial incentives to alleviate employees’ angst.
ExxonMobil (a JUST 100 company), for example, has used windfall profits to expand a program that gives stock to high-performing employees and handed U.S. workers a one-time cash payment equal to 3% of their salaries; T. Rowe Price offered most of its global staff 4% salary increases by July 1 “to reward their commitment and ensure that we remain an employer of choice.” And in mid-June, Walmart announced a raise in average hourly wages for more than 36,000 pharmacy technicians to more than $20 an hour.
Even where layoffs are necessary – as has happened recently with Meta, Shopify, Uber, Oracle, and others – they can be handled in a just way. Airbnb showed how best to do that in 2020. In some cases, companies are both downsizing and investing in workers. Microsoft, for example, has taken down job listings but also raised its budget for merit-based salary increases.
The other stakeholder deeply affected by inflation is obviously the consumer. Here, we see large retailers, including Walmart, Best Buy, Gap, and Target, announce promotions and lower product pricing on high-inventory goods. This should help strapped shoppers somewhat. But some interesting shifts in consumer attitudes towards buying U.S. made goods also caught our eye.
This week, our survey partner The Harris Poll partnered with Retail Brew and reported that while 64% of Americans who shop for U.S.-made goods say that inflation has a negative impact on them doing so, 72% of respondents say they seek out American-made products very often or somewhat often even in the face of inflation challenges. This should provide some comfort for companies who source products locally, which is a facet of our stakeholder model.
The pressures inflation heaps on business does not mean stakeholder value creation needs to take a back seat. On the contrary, it can be a time for just companies to shine.
Be well,
Martin Whittaker

Amazon reveals that its carbon emissions increased 18% last year thanks to a COVID-related surge in online shopping.
Amgen is fighting the IRS over a potential $10.8 billion owed in back taxes.
Ford CEO signals it will reduce headcount in its legacy combustion engine business to fund the transition to EVs, and is preparing to cut up to 8,000 workers.
Nike – responding to pressure from activist investors – will release data on the hiring and promotion rates for women and minorities in its workforce.
Oracle begins thousands of planned layoffs across its global workforce, after discussing cutting $1 billion in expenses.
Robinhood lays off 23% of its workforce after a downturn in crypto trading, its second round of layoffs this year.
We broke down the Q2 performance of the companies in our Rankings, discovering that those at the top outperformed the rest across four of the five stakeholders we measure.
If you haven’t taken our Annual JUST Report Reader survey, please do! It helps us in shaping our coverage to include the content that’s most important to you.
Board Member Peter Georgescu speaks with Krista Bourne, COO of Verizon, on how her company is investing in its workers and succeeding in making all of its stakeholders happy.

(CNBC)
“This is good for the markets, it’s good for the country, it’s good for investors. It is possible to do an investment that provides a financial AND a social return. I fear…this backlash [against ESG] is ideological and not based on facts. This is market driven: every firm on Wall Street is creating ESG funds because consumers, investors are asking for these products to invest in, not because they are being browbeaten by activists.”
“It’s part of the cycle. When we think about what’s happened in the last 60 days, in terms of the uber aggressive hiring that has gone on, what you’re seeing is a natural reaction. The math is pretty straightforward: inflation + a retreat from hiring + a heightened focus on retention = more perks à la raises.”
“Our employees are the face of the brand. They are the factor that helps differentiate what we offer over what competitors offer…we get hundreds of job applications daily, but we compete in a tough job market. We just recently raised the minimum wage for starting positions. And we have a rich set of benefits. Incentive bonuses and profit-sharing. Employee stock ownership.”
In the midst of the debate around ESG, Barron’s invites commentary from Environmental Defense Fund’s Fred Krupp who urges readers to tune out partisan point-scoring and work through legitimate critiques and Ford Foundation’s Roy Swan who invites readers to consider pivoting toward more impact investment strategies. The Ford Foundation President Darren Walker went on CNBC to report the success of the foundation’s impact investing program, which has provided greater financial and social returns. On the other side of the conversation, Harvard Business Review publishes a new editorial on how ESG “won’t save the planet,” because it’s not actually designed to do that – it’s designed to drive returns.
The Wall Street Journal features a new comprehensive McKinsey study on the frontline experience for workers of color that suggests companies’ diversity efforts have largely missed the employees that stand to reap the biggest socioeconomic gains from them.
Fortune CHRO Daily unpacks the perplexing dynamics of the current labor market. WSJ reports U.S. job openings fell in June. Quartz reports that wages are holding strong, signaling that many sectors are still struggling to hire at capacity, but Yahoo Finance focuses on the fact that, though wages are up, inflation is eating at those gains. Despite the tight labor market and high attrition risk, a Gartner study shows CEOs and CFOs are attempting to limit expectations for across-the-board pay hikes and that employees expecting pay adjustments that fully compensate for cost-of-living increase may be disappointed.
The New York Times investigates how companies are reassessing and reimagining workplace flexibility to attract Gen Z employees.
NBC looks at the record-high profits shared by energy companies as gas prices at the pump remain steep.

This graph comes from our Q2 2022 Stakeholder Performance Analysis, which shows that companies in the top of JUST’s Rankings outperformed those at the bottom across four out of five stakeholders. The Environment delivered the best performance with a long-short spread of 10.5%. Explore additional insights here.
Corporations play a significant and influential role in our economy and society, and a wide range of stakeholders want corporate leaders to use that influence to positively impact the communities they engage with.
Against this backdrop, Don Katz—founder and executive chair of the online podcast and storytelling platform Audible—took action. He launched Newark Venture Partners (NVP) to invest in high-growth startups and generate jobs and opportunity for residents in Newark, NJ, where Audible is based.
Crunchbase’s “Diversity Spotlight 2020” report names NVP as one of the nation’s top 10 micro venture capital investors in Black- and Latinx-founded companies. NVP has invested more than $40 million in 93 portfolio companies, more than half of which were founded by women or people of color.
Join us on December 9th at 10AM ET as we host an expert panel who’ll share real-world examples of how corporate leaders can advance racial equity through investing locally.
Kendra Berenson, Associate Director at FSG, will also offer opening remarks highlighting the 2021 CEO Blueprint for Racial Equity, a report by FSG, PolicyLink, and JUST Capital that provides practical guidance on how companies can advance racial equity within their companies, communities, and society.