
For the third consecutive year, paying a fair and living wage ranks as the top priority for the American public when it comes to just business behaviors. JUST Capital’s 2022 Issues Survey – The People’s Priorities found that paying a fair, living wage was the most important business Issue this year, doubling in importance over the last two years, and will comprise 21% of our Annual Rankings of America’s Most JUST Companies model in 2023. To put this into context, the next highest priority – creating jobs in the U.S. – was the second most important issue at 11%. What’s even more compelling is that despite increasing rhetoric that the country is incredibly polarized, across every demographic group we surveyed – political affiliation, race, gender, age, or income group – Americans are united in wanting companies to prioritize paying a fair, living wage as the most important business Issue today.
Despite the overwhelming consensus that companies have a responsibility to pay workers enough to make ends meet and be transparent with job seekers about pay, there is remarkably little public data available to track explicit performance on wages by even the largest companies, like the Russell 1000 corporations JUST ranks. That’s why we are proud to announce our new partnership with Revelio Labs, a leading labor market data provider that is working to create the first universal HR database, to fill the measurement gap on corporate wages.
The current state of corporate wage disclosures is poor, non-standardized, and mostly voluntary
There are many reasons why publicly available wage data in the U.S. is sparse. They include concerns over privacy, perceived litigation risk, and exposure of corporate trade secrets. Some concerns are more real than imagined, and some are even shared by those tasked with oversight. Federal agencies, for instance, do not currently disaggregate results from tax records or employer surveys by companies in a nod towards worker and employer privacy. In an ideal world, companies would provide equitable access to such data. But as it stands, the vast majority of disclosure on human capital metrics is voluntary, and thus public companies seldom have the incentive to release information about wages in their corporate social responsibility or diversity, equity, and inclusion reporting.
In 2017, the Securities and Exchange Commission adopted the Dodd-Frank mandate requiring public companies to disclose the pay ratio between the CEO’s and median employee’s compensation in annual proxy statements, offering a rare window into the state of pay at public companies. The rule, however, provided companies with significant flexibility in identifying who the median worker is and how to calculate the median, with the ability to change this definition every three years. As a consequence, the publicly reported median worker pay data is incomparable and inconsistent.
The odds of finding standardized, non-mandatory disclosure on wage data are also low. If shared at all, companies voluntarily disclose three wage-related metrics: (1) the cost of salaries, benefits, and pensions; (2) pay equity analyses by gender or race and ethnicity; and (3) minimum wage rates for hourly employees. Even though we’re in an economic climate characterized by fierce competition for talent among employers and rising inflation, under 10% of Russell 1000 companies disclose their minimum wage rates for hourly employees, the only disclosure among the three that can actually tell us anything about the bottom end of the wage distribution.
Modeling estimates are required without comprehensive, standardized disclosure of data
While we wait for better company-specific wage data from government agencies and continue to push for increased voluntary disclosure among companies on key job quality issues like wages, we have to get creative by knitting together whatever wage data is available. That is a big reason why JUST’s annual Rankings has relied on models to help us estimate metrics on the state of wages among Russell 1000 companies. But not all models are created equal.
Historically, these models used a combination of crowdsourced data reported by current and former employees and data from federal agencies like the Bureau of Labor Statistics to construct a wage distribution for each company. But even this approach was a blunt instrument for assessing corporate wages: Without sufficient company-specific data, the results suffered from clustering and data bias.
JUST Capital and Revelio Labs have partnered to bring out the best and mitigate the worst of available wage and employment data
To develop a model that more accurately measures the state of corporate wages for JUST’s annual Rankings and beyond, JUST has partnered with Revelio Labs to leverage its unique workforce datasets and modeling capabilities. Together, we have radically improved our visibility into the wage and salary distribution for each Russell 1000 company, adopting Revelio’s innovative machine learning model to predict salaries. This new wage and salary distribution enables us to produce estimates for three data points within the “Pays a fair, living wage” Issue: (1) the median U.S. worker pay (to compare to CEO compensation), (2) the share of U.S. workers earning a living wage to support a family of two full-time workers and two children, and (3) a score that evaluates how fairly a company pays for similar occupations compared to its industry peers.
Read an overview of how it works in our methodology summary or dig into the full methodology for a deeper explanation.
What have we learned so far?
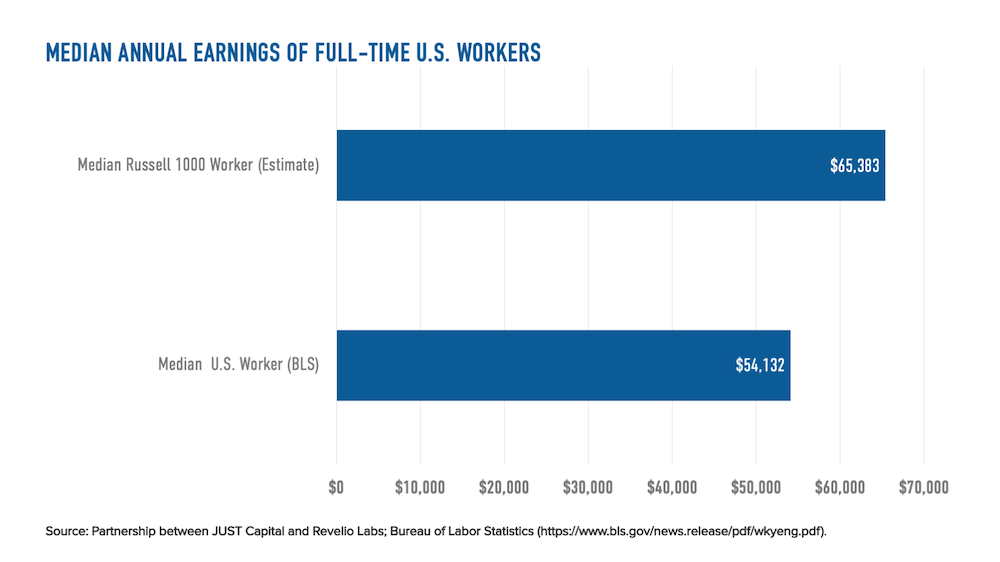
The results from our joint modeling work give us several new insights about the state of wages among Russell 1000 companies. Most notably, we’ve learned that while estimates show that these companies pay better on net than the typical American employer, a slim majority of their workers still may not be earning enough to make ends meet.
At the typical – or median – Russell 1000 company, for instance, 50% of full-time workers earn above roughly $65,000 annually, which is over $10,000 per year more than the median earnings of full-time workers nationwide.
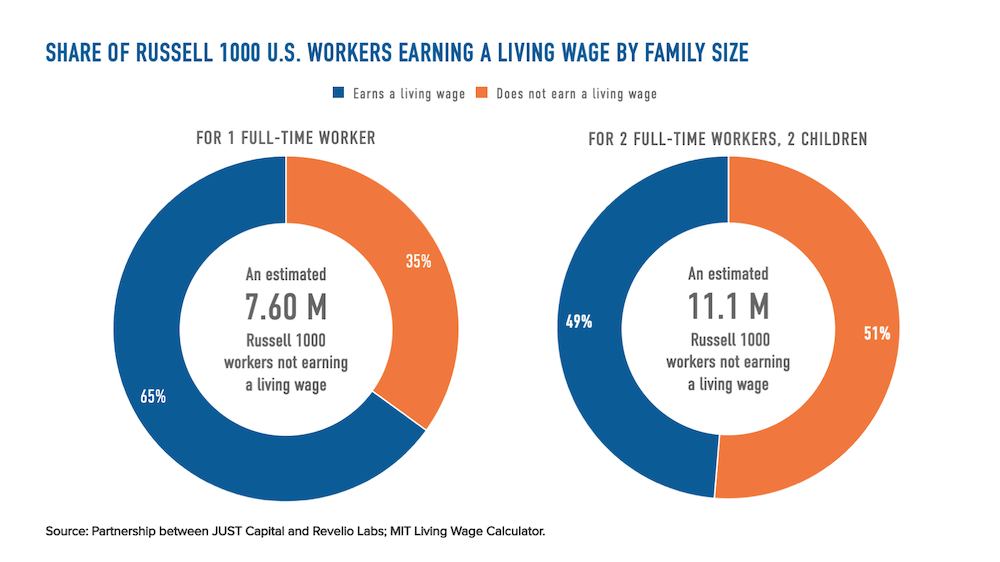
These higher salaries and wages at Russell 1000 employers overall, however, do not translate to greater economic security for all Russell 1000 workers. In fact, our estimates show that 51% of all the workers at Russell 1000 companies, who in total made up about 15% of the employed population in the U.S. in 2021, are not earning a family sustaining living wage, a national population-weighted average of $24.16 per hour in 2022 according to our partners behind the MIT Living Wage Calculator. That’s about 11.1 million workers who are not making enough working full-time to support a family that has another full-time working adult and two children. We further estimate that about 35% of Russell 1000 workers do not earn enough to meet their own basic needs – or a living wage for one full-time employee without dependents, a national population-weighted average of $17.46 per hour in 2022.
These findings underscore the reality that some of the largest U.S. employers among the Russell 1000 have a disproportionate share of low-wage jobs and still have a long way to go when it comes to meeting the expectation of the American public to pay a fair, living wage.
In the coming weeks, we’ll be exploring more insights from these wage models. While these modeled estimates are just that, estimates, they nevertheless provide an insightful starting point from which we will iterate and improve. We will use these findings to better understand how America’s largest companies are performing on what Americans are prioritizing more than ever – creating JUST jobs.
Lisa Simon is a Senior Economist and Daniel Firester is a Lead Data Scientist at Revelio Labs.
This article was originally published on December 17, 2020 and updated on January 19, 2021, and features research assistance contributions from Kim Ira and Aleksandra Radeva, Junior Research Analysts, and data visualization contributions from Sara Horowitz, Director of Web Development.
Last December, asset manager BlackRock became the latest player in the push to get companies to disclose data on the gender, racial, and ethnic composition of their workforces in response to the racial reckoning that rippled across the country this past summer. BlackRock’s announcement comes on the heels of efforts by others in the investor community, who have called on America’s largest corporations to publicly release the “gold standard” of gender, race, and ethnicity data disclosures, The EEO-1 Report. A notable example came from New York City Comptroller Scott Stringer, representing two of the country’s largest pension funds, asking S&P 100 companies to release this data. We’ve been proud to support his office’s work directly, and it has started to move the needle.
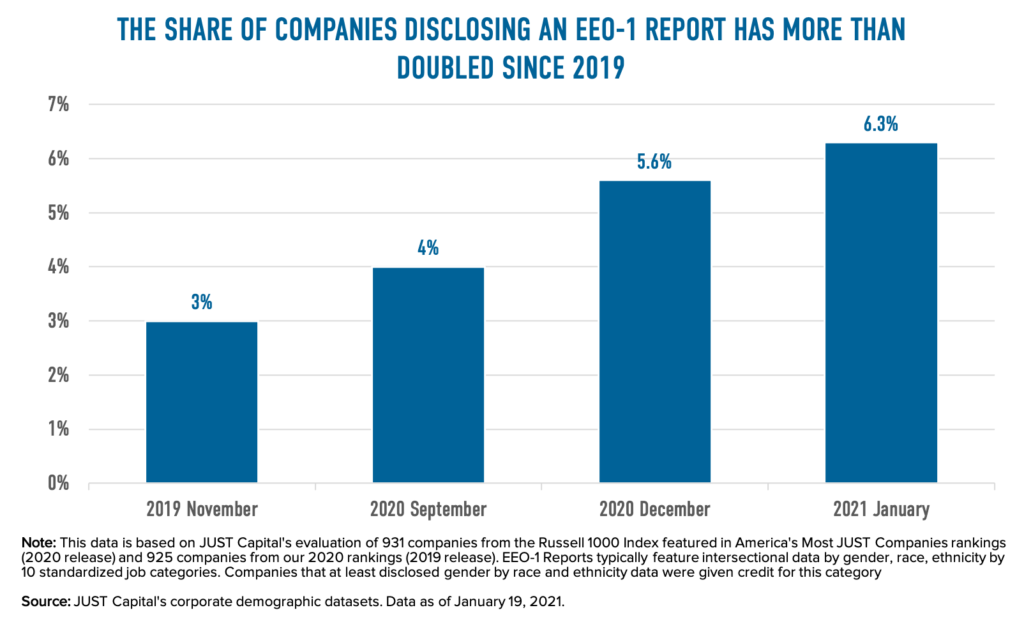
As of January 2021, only 6.3% of America’s largest corporations disclosed the type of intersectional data that could be derived from an EEO-1 Report. That is just 59 companies out of the 931 companies we studied in our 2021 Rankings of America’s Most JUST Companies, but it is up by 27 from December 2019. We expect to see more movement in 2021 as more pressure comes from investors, standard-setters, and advocates alike.
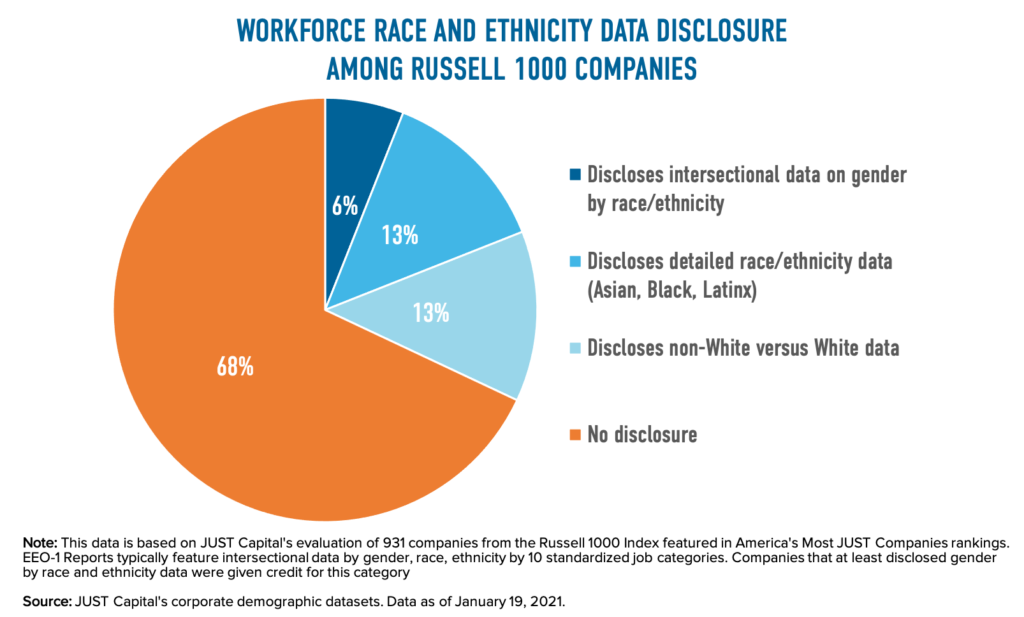
EEO-1 Reports, formally known as Employer Information Report EEO-1, are required to be filed with the Equal Employment Opportunity Commission (EEOC) each year by employers that have at least 100 employees. Component 1 of the EEO-1 Report specifically asks companies for the raw number of employees by their gender, racial, and ethnic identity by 10 standardized job categories. While the EEO-1 Report could be more inclusive in its categorizations, the demographic data reported is highly disaggregated, making it useful in evaluating the state of diversity in intersectional ways. The EEO-1 Report has become a key proxy for investors, as well, in assessing how far along companies are on their racial equity journey.
Despite the fact that EEO-1 Reports are compiled and submitted to the federal government annually, just a handful of companies actually share them publicly as a means of accountability for increasing representation. JUST Capital has actually been tracking the state of EEO-1 Report and other demographic data disclosures among Russell 1000 companies since 2019, such as an analysis that looked at what percent of companies that made a statement of support for Black Lives Matter also disclosed the racial and ethnic compositions of their workforce.
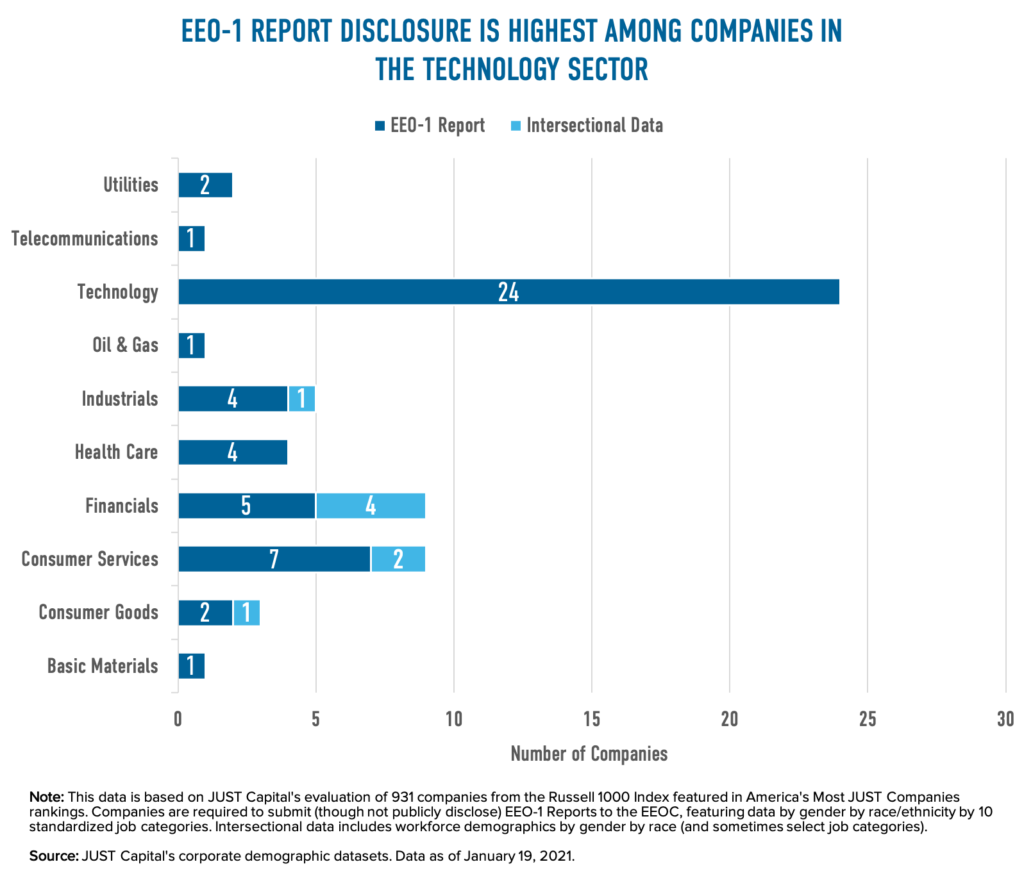
Not all of the 59 companies in the JUST universe publicly released an actual EEO-1 Report: eight published a modified version of the report, which still features intersectional workforce data by gender, race, and ethnicity but sometimes uses percentages instead of counts, alters or condenses the 10 job categories, or excludes job categories altogether. What’s more, EEO-1 Report disclosure is heavily concentrated among companies in the technology industry, where 24 companies make up nearly half of all disclosures.
How EEO-1 Report disclosure has changed
The good news is that disclosure of EEO-1 Reports (and intersectional data) is on the rise across the board. In December 2019, only 32 companies in our universe publicly reported this level of diversity data. Today, that number has grown by 84%, with 27 more companies disclosing. The recent concerted effort by investors and others in the business community has likely been a factor in this increase, too, as just between September 2020 and January 2021, 18 new companies were added to our list.
Still, 68% of companies in the Russell 1000 release no data on the racial and ethnic makeup of their workforce, suggesting that there is considerable work to be done to encourage diversity data disclosure of any kind, let alone EEO-1 Reports.
It is important to note that disclosing an EEO-1 Report, or diversity data in general, is not a substitute for the tremendous amount of work that is needed to cultivate diversity and inclusion and address systemic inequities across corporate America. But publicly sharing this data is a first step – a benchmark – in holding companies accountable to the commitments so many of them have made to advancing racial justice and equity for their workers and communities alike. As advocate and investor groups continue to push for diversity data disclosure, we’ll be among those continuing to watch how these commitments translate to actions around EEO-1 Reports and beyond.
A deeper dive: Which Russell 1000 companies have released their EEO-1 Report.
In the table below, explore which companies from the JUST universe have publicly reported their EEO-1 Report (or other highly detailed intersectional diversity data).

Almost three quarters of the largest public school districts in America opened this year as remote learning only. (kawee/Adobe Images)
A child care crisis was brewing long before COVID-19 struck the United States earlier this year. Before the pandemic, parents across the country were already faced with a child care market riddled with issues of availability, accessibility, and quality, and priced at an exorbitant cost. JUST’s data showed that on top of that, the vast majority of the largest American companies lacked any child care benefit. The coronavirus crisis has not only exacerbated these existing issues with child care but it has also exposed new challenges and uncertainties for working parents. And the latest hurdle is a messy, unpredictable, and unprecedented back-to-school season.
This year, 73% of the nation’s 100 largest public school districts, serving 8 million children, will only be opening their classrooms remotely. Others are opting for a hybrid approach, involving a combination of in-person and remote learning. Whether learning is fully or partially remote, many children aged 0 to 13 will require adult supervision and after-school care to fill in child care gaps as parents continue to work.
The added problem, though, is that the pandemic has also dramatically changed the child care provider landscape and parental preferences for care.
A survey conducted by the Bipartisan Policy Center at the start of the pandemic found that 60% of both center- and home-based child care providers were closed. More recent survey data from the National Association for the Education of Young Children (NAEYC) at the end of the summer found that 18% of child care centers and 9% of home-based child care continued to remain closed. For those child care providers that have weathered the pandemic or have reopened, there are unprecedented costs and considerations.
For instance, providers must simultaneously invest in staff, enhanced sanitization and cleaning procedures, and personal protective equipment while also reducing enrollment and class sizes to promote social distancing. NAEYC survey research from July shows that 70% of providers are incurring substantial costs to adjust their operations to meet these critical health and safety needs. These costs ultimately fall back onto parents, who are already burdened with child care’s high price tag.
At the same time, however, the pandemic has altered parental choices for child care. A Care.com study found that 63% of parents surveyed were somewhat or very uncomfortable sending their child to center-based child care. Instead, 35% of respondents were considering shifting to home-based care. The American public appears to have similar attitudes toward school reopening, too, with 46% agreeing that reopening should come with major adjustments and 31% preferring for schools not to reopen at all, according to a report by the Associated Press-NORC Center for Public Affairs Research.
As working parents juggle closures with their own preferences, earlier survey research from Boston Consulting Group estimated that 60% of them had not found alternative child care or school arrangements. And the need for child care is high for both those parents who are able to work from home and those working in-person. In April, a Bipartisan Policy Center survey of parents with young children found 43% of parents working remotely due to COVID-19 needed some type of child care, while 49% who were “essential” workers – disproportionately women and people of color – required more formal child care services.
Working mothers have shouldered the brunt of filling these unmet child care needs during the pandemic. The Center for American Progress’ recent analysis of the U.S. Census Bureau’s Household Pulse Survey discovered that millennial mothers were almost three times more likely than fathers to be unable to work as a result of child care and school closures. Working mothers have been making tradeoffs to fully meet their families’ child care needs even before the COVID-19 pandemic, which can result in absenteeism at work, lost wages, or even exits from the labor force altogether. These tradeoffs have significant implications for perpetuating gender inequities and cost families millions each year.
Unmet child care needs impact employers, too. Prior to the pandemic, American employers were estimated to lose $12.7 billion a year due to breakdowns in typical child care arrangements that lead to lower employee productivity and greater absenteeism and turnover. A Brookings researcher recently told Barron’s that school closures will cost the U.S. economy $56 billion per month in lost productivity, as parents navigate both work and caregiving. Over a typical school year, that could amount to $500 billion if schools continue to stay closed.
An overwhelming consensus among parents – 96% of those surveyed earlier this year – is that the government and businesses must act to provide working parents with additional support for child care. JUST Capital’s own polling has found that the American public believes that a one-two punch is needed to tackle issues of childcare provision. Specifically, when we asked who should be responsible for providing a stipend to fund childcare services, 62% of respondents selected either federal or state government.
But in the absence of any federally coordinated response to the COVID-19 care crisis, the responsibility falls on companies to step up to help their working parents fill the gaps in care arrangements as children return to school this fall. Our polling shows that there’s a growing demand from Americans that employers play a role in providing financial support for child care for their workers: 39% of Americans say that employers should be responsible for doing so.
Prior to the pandemic, the landscape of company-provided child care generally included three options: on-site child care, subsidies for off-site child care providers, and subsidized backup dependent care, which can be used when existing care arrangements fall through. JUST Capital’s analysis of companies in the Russell 1000 shows that before the pandemic, the vast majority of companies did not provide any type of child care benefit to their working parents. Just 6% of companies provided child care through a center on site, 8% offered subsidized child care, and 15% offered backup dependent care.
The COVID-19 pandemic elicited an additional dependent care response from companies in light of child care and school closures and disruptions to employees’ typical care arrangements: 9% of the companies we evaluated this year instituted or extended their backup dependent care benefit that were specific to the challenges presented by the pandemic. These benefits were a mix of increased backup dependent care support or additional paid time off for employees to deal with care challenges in response to COVID-19.
Of the few companies that added backup dependent care benefits in response to the pandemic, most only offered temporary relief. For instance, Visa temporarily increased the number of maximum backup care visits available to its employees to 20 through its partnership with LifeCare. Microsoft and Google offered extensive increased paid time off benefits to their employees. While still a temporary fix, they provided 12 and 14 weeks, respectively, of additional paid leave for employees to deal with dependent care issues and school closures, surpassing the amount of time given by many of their peers. Although these additions are critical in addressing short-term disruptions to child care, the temporary nature of these provisions is insufficient for coping with the ongoing care needs as children return to school.
Backup dependent care and extended time off do not solve the longer-term complexities of child care needs for fully or partially remote school this fall. Parents who are still working from home, back in the office, or on the frontlines require ongoing child care benefits that are flexible enough to meet their unique situations and preferences.
Companies should consider offering employees more flexible benefits, such as subsidies, stipends, or other financial support that can be used for a variety of dependent care arrangements – ranging from center-based care to family, friend, and neighbor care – that best suit their families. Some companies, like Bank of America and Adobe, provided a more flexible dependent care reimbursement as part of their responses to the pandemic. Bank of America’s benefit allows employees to receive up to $100 a day to go toward the backup care of their choice.
Adobe explicitly states the availability of a care reimbursement that can be used however employees see fit: “If care is not available through the Bright Horizons backup care program, you will be offered the option to secure care from your personal network (e.g., a neighbor, friend or babysitter) and receive a reimbursement of $100 per day.”
The nuanced challenges presented by back-to-school in the time of COVID-19 call for companies to consider creative, equitable solutions to obstacles faced by caregivers of all types, whether they are in corporate positions or on the frontlines.
As companies determine what type of policies work for them, those that take employee benefits seriously should bring the same weight they do to health insurance or retirement to child care policies, because the severity and business-side impacts are on the same level. Whether companies decide to step up and provide robust benefits directly or advocate for a federal solution can be up for debate and will likely vary across companies, but what shouldn’t be up for debate is whether this is an issue that should be prioritized.
Another week of nationwide, even global, protests for racial equity – spurred by the police killing of Black and Brown men and women including Elijah McClain, George Floyd, Breonna Taylor, and Rayshard Brooks – has propelled commitments to antiracist action among institutions across the country. This moment of systems upheaval has opened the eyes of many Americans to issues of inequity and violence that are not new, but are being held under a new microscope. As government agencies, businesses, investors, and nonprofits alike continue to reckon with next steps – including NYC Comptroller Scott Stringer who called on 67 companies this week to release their workforce demographics – we’re unpacking how America’s largest corporations have responded in support of Black Lives Matter and their Black employees.
Earlier this month, we looked at which companies among America’s 300 largest employers made a statement in support of the Black Lives Matter movement and whether those companies have disclosed a breakdown of the racial and ethnic composition of their workforces. We found that 59 of the 199 companies that had released a Black Lives Matter statement had disclosed enough detail to show how many employees identify as Asian, Black, Latinx, or White, and just 17 of these companies had disclosed information that would typically be found in an EEO-1 Survey, the most detailed format of demographic disclosure.
We applaud these companies for their transparency. Disclosure from companies on their demographic diversity represents a critical first step on the journey to addressing workplace inequities.
When we look at the breakdown of the demographics at these companies, we see that, in aggregate, they largely match the demographics of the overall U.S. population – but when we look more closely by company and industry, we see that some demographics are more highly concentrated in certain sectors than others, while others – like Black workers – are significantly underrepresented.
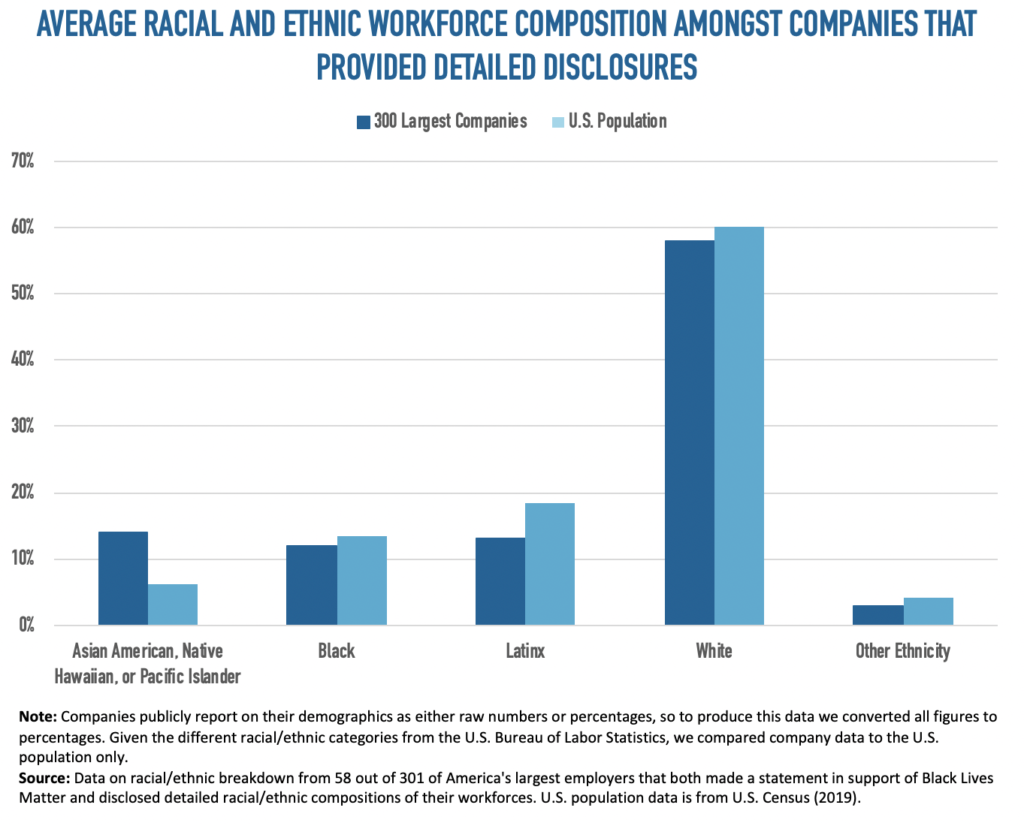
In looking across all 59 companies that disclosed sufficient details on demographics, we compared workforce breakdowns to the overall distribution of the U.S. population and found that workforce representation overall included:*
Representation of White and Black workers, along with those identifying as “Other Ethnicity,” largely match that of the U.S. population, while Asian Americans are overrepresented (14% vs. 6.2%) and Latinx employees are underrepresented (13% vs. 18.5%). But when we look at each company, we find an even more nuanced picture of Black and Brown underrepresentation at some of America’s largest employers:
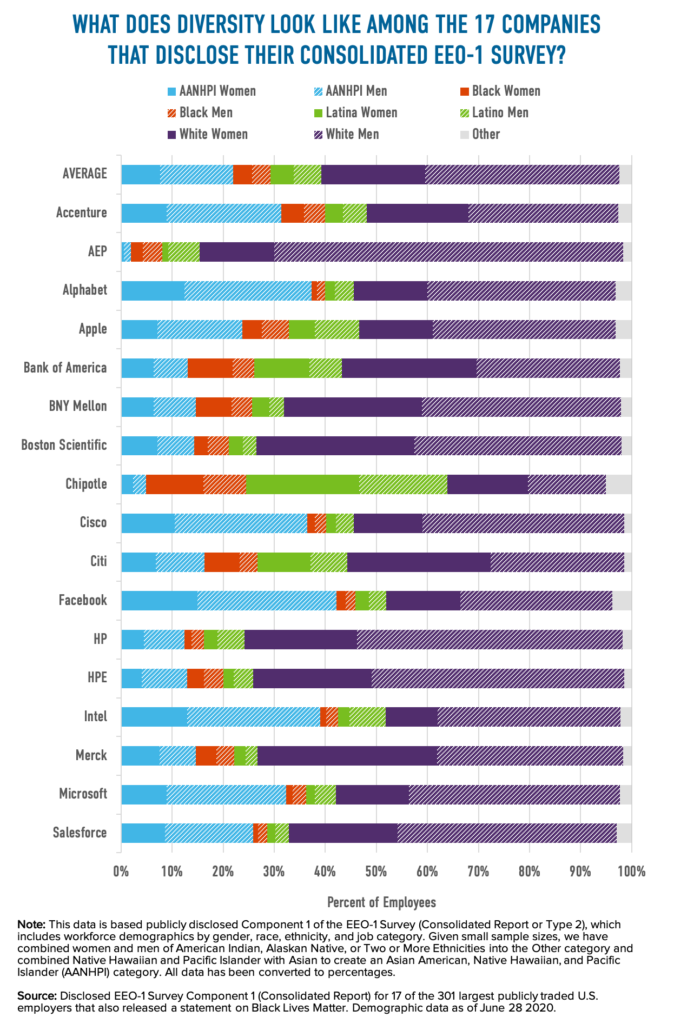
By looking at the intersection of race, ethnicity, and gender at these 17 companies, we find that on average, 17% of workers identify as Black or Latinx and 36% of workers identify as women. While on net this demonstrates underrepresentation of these groups, the situation is even starker among Technology companies, which are most likely to disclose their EEO-1 Surveys.
Nine out of the 17 companies that both released a Black Lives Matter statement and disclosed an EEO-1 Survey are classified as part of the Tech sector. At these nine Tech companies, just 12% of workers identify as Black or Latinx and 30% identify as women. When examining Black diversity at these employers in particular, it is clear that both men and women are chronically underrepresented, with Black men on average making up 2.7% of the workforce and Black women making up just 1.8%.
Though these breakdowns of detailed racial and ethnic data highlight critical disparities in Black and Brown representation among America’s largest employers, it also provides a clear benchmark from which progress can be measured. And as companies increase their internal and external commitments to racial equity, disclosing racial and ethnic demographic data – especially that are available in an EEO-1 Survey – acknowledges the inequities that exist and anchors any commitment to build a more diverse workforce.
But disclosing racial and ethnic demographic information and EEO-1 Survey data is just a first step in understanding inequities in the workplace. There is much more to be done for companies to understand their current performance. For instance, evaluating differences in pay by gender, race, and ethnicity by job category or analyzing discrepancies in hiring, promotion, and retention rates by minority groups can help uncover how other dimensions of racial inequity impact Black and Brown workers. In addition to this work, all companies must consider how systemic racism plays a fundamental role in the structures of our daily lives, our relationships, and the economy, and work to build antiracist structures at every level of their business. We unpack many of these steps in our list of specific actions companies can take to support Black colleagues.
While this week we’ve focused on the companies that have disclosed detailed racial and ethnic demographic breakdowns for their workforces, there are a number of companies among America’s 300 largest employers that have made no disclosure at all. In order to address systemic inequity and racism in the workplace, we encourage companies to increase transparency to expose areas for improvement. In unison with NYC Comptroller Scott Stringer’s call for corporate action, we urge these companies to publish their current workforce demographic breakdowns, specifically EEO-1 Surveys. By building a deeper and more open understanding of where corporations currently stand in the movement for racial equity, we can create more equitable workplaces.
*Note: The data in this piece was last updated on June 28, 2020.
On June 9th JUST Capital launched an updated version of the COVID-19 Corporate Response Tracker, now featuring data for 300 of America’s largest public employers (up from 100) across 20 dimensions of corporate action. Though the tracker grew by 200 companies, one of the most interesting trends we noticed was that overall rates of disclosure dropped in nearly every dimension.
To further unpack these shifts, we compared disclosure rates across the 20 dimensions between the original 100 largest and the newly added next 200 largest U.S. employers.*
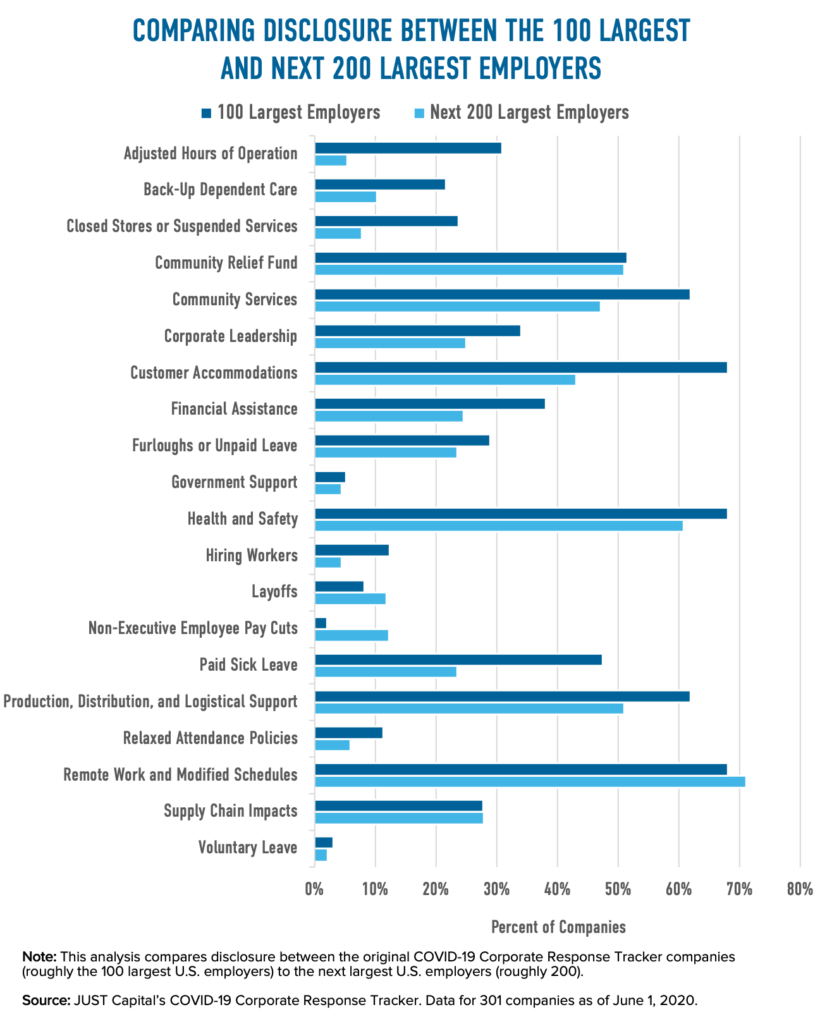
The findings are stark – larger employers appear to have a greater propensity to disclose positive actions in response to the pandemic, much as the top performers in our Rankings tend to be those with the most employees. For instance, the 100 largest employers are:
Conversely, the next 200 largest employers announce engaging in cost-cutting measures that disproportionately impact workers at a higher rate than their counterparts in the largest 100. The next 200 are 1.4 times more likely to lay off employees and 5.9 times more likely to cut pay for non-executive employees.
There are three notable exceptions. When it comes to donating cash to community relief efforts, enhancing health and safety protocols or providing workers with PPE, and permitting employees to work remotely (when possible) or modifying onsite work schedules, rates of disclosure are similar between the 100 largest and the next 200 largest U.S. employers.
So, what explains the differences in disclosure between the 100 largest and next 200 largest companies? One factor to consider is the date of collection. As time has passed since we first collected data in mid-March, some of the critical early measures that companies took to support their workers, customers, and communities – such as adjusted hours of operation, temporary store closures and service suspensions, and relaxed attendance policies – have phased out. It is possible that the newly added companies once took these actions and discontinued them as the pandemic progressed. A company’s national visibility or brand presence may play a role, as well, as less visible companies (oftentimes smaller) may dedicate fewer resources toward disclosing their actions. Yet another explanation for lower disclosure rates among the next 200 largest companies could be related to industry or business operations (e.g. there is a greater proportion of B-to-C companies among the 100 largest), and, relatedly, impacts on financial performance.
Most likely, a combination of these factors drive the discrepancies in disclosure between the 100 largest and next 201 largest companies. And as we enter the reopening phase of the COVID-19 crisis, we are likely to see companies continue to shift how they’re responding. We are continuing to track what businesses are doing – stay tuned for more updates and analysis in our Corporate Response Tracker and the 2021 Rankings this Fall.
*Note: In this piece, we use short-hand language to describe the “100,” “next 200,” and “300” largest U.S. employers. The Corporate Response Tracker, however, includes a total of 301 companies: 97 companies are part of the initial tracker, while 204 have been added during the tracker expansion. The rounded values help simplify discussion of the Tracker.
Last week, JUST Capital released a report exploring what types of financial assistance America’s 100 largest employers – monitored in our COVID-19 Corporate Response Tracker – have provided to their essential workers to compensate them for putting their health at risk and help mitigate financial instability during the pandemic. We found that 20 companies announced temporarily increasing hourly wages or offering hazard pay, and 18 companies announced providing one-time bonuses to their employees. Our analysis also posited that companies that are financially able to do so should prioritize increasing hourly wages over providing one-time bonuses. In this piece, we unpack this argument in depth.
Across the 100 companies we analyzed, those that announced a temporary wage increase added an average of $2.11 to employee’s hourly earnings. Companies that announced offering a one-time bonus gave full-time workers $500 and part-time workers $192 on average.
At first blush, bonuses seem to give workers access to much more cash than a temporary bump to hourly wages. Having this cash upfront can help workers cope with unexpected expenses that arise due to health emergencies, shifts in employment status, switches in child care arrangements during school closures, or other changes to financial circumstance during the pandemic. But as demonstrated by the chart below — which was also featured in our report — the longer-term outlook is different: Over time, the cumulative earnings from a temporary wage increase outpace those from a one-time bonus.
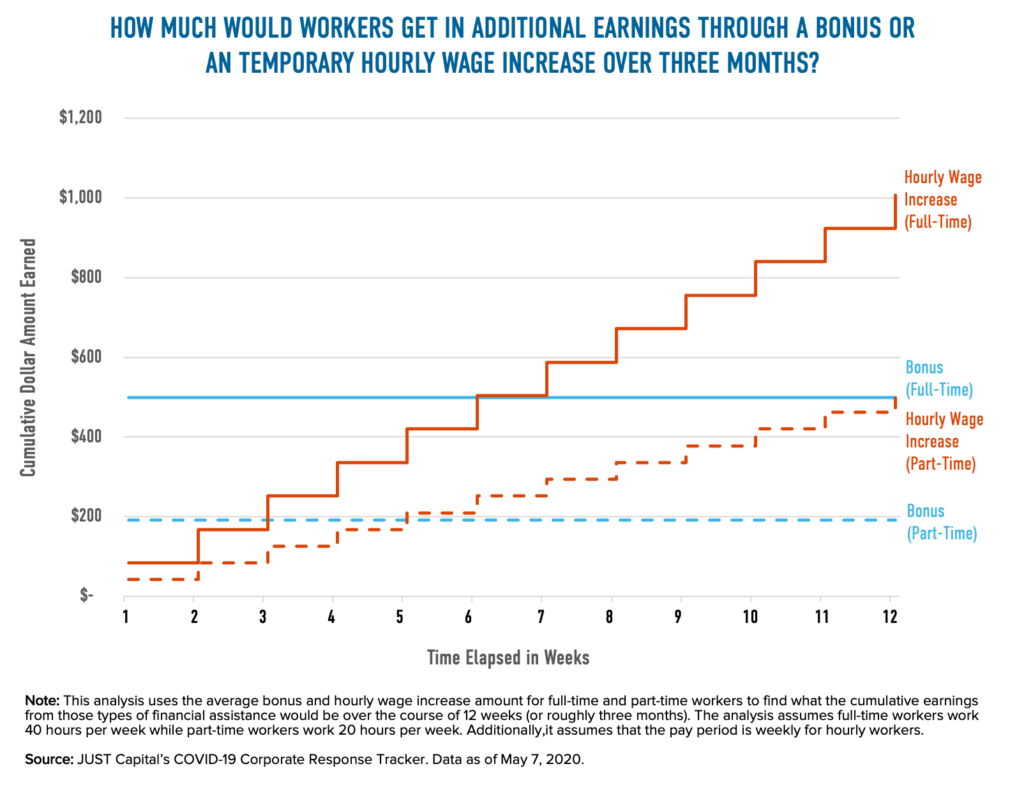
The hypothetical example illustrated in the figure above uses (1) the average one-time bonus amount and (2) the average hourly wage increase amounts for both full- and part-time workers to chart what cumulative earnings under each financial assistance program look like over a three month horizon.
In this scenario, imagine that Company A announced a one-time bonus for its full- and part-time workers of $500 and $192, respectively, while Company B announced a $2.11 per hour wage increase for both its full- and part-time workers paid on a weekly basis. By the end of the first week, full- and part-time workers at Company A would have collected and extra $500 and $192, respectively, and workers at Company B would have only collected an extra $84 and $42. In other words, full- and part-time workers at Company A would have earned an additional 6.0 and 4.6 times the amount of their counterparts, respectively, at Company B.
Right after the end of the fifth week, however, the cumulative earnings from an hourly wage increase for part-time workers at Company B start exceeding the cumulative earnings from a part-time worker’s bonus at Company A. Around the end of the sixth week, the cumulative earnings from an hourly wage increase for full-time workers at Company B eclipse the cumulative value of the bonus for full-time workers given by Company A. By the end of the third month, full-time workers at Company B will have cumulatively earned 2.0 times as much in extra wages as full-time workers at Company B. And part-time workers at Company B would have cumulatively garnered over 2.6 times as much in additional wages as their counterparts in Company A.
In deciding between following the plans set up by Company A (bonuses) or those implemented by Company B (temporary wage increases), companies are implicitly being asked to think about whether COVID-19 will have short-term impact on their businesses and workers or a long-term one.
There is a lot of uncertainty around how the COVID-19 pandemic will continue to play out, but many experts have speculated that the crisis will have long-term impacts on public health, our economy, and many other dimensions of our daily lives. In an outstanding example from our analysis, Charter Communications announced that it would increase the wages of its hourly workers to $20/hour permanently by 2022, while many other companies’ pay increases are set to expire this month. Given these long-term impacts, however, companies that are contemplating between the two actions or are financially able to do so should consider increasing workers’ hourly wages – and consider making these increases permanent.