This report was written by Mona Patni, JUST Director of Quantitative Research & Analytics.
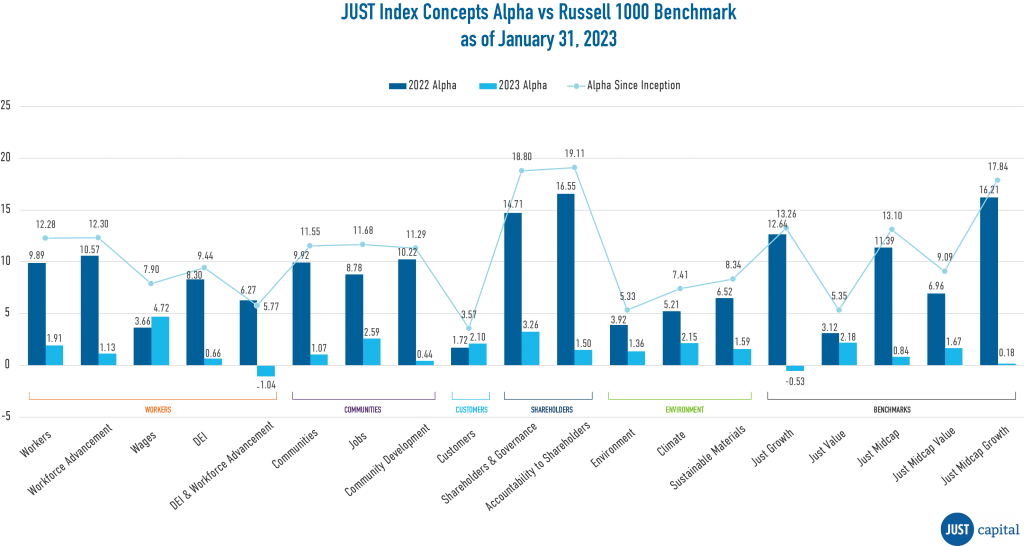
Each index concept has outperformed its benchmark since inception, with the Accountability to Stakeholders index concept focused on good governance generating over 19% alpha.
As part of our ongoing work to build the business and investor case for just business behavior, Just Capital has released 19 new index concepts that demonstrate the power of investing in companies at the forefront of stakeholder value creation.
Each concept features companies that score in the top 20% of our Rankings of America’s Most Just Companies, which evaluate how the nation’s largest corporations perform on the Issues that matter most to Americans today. Each concept demonstrates that investors need not sacrifice returns to support companies doing right by all their stakeholders.
Incepted on December 31, 2021, each concept has over a year’s worth of performance history, and to date, each one of them has outperformed the Russell 1000 benchmark with alpha ranging between 3.6% to 19.1%. The chart below demonstrates that throughout 2022 and even in January 2023, the indexes have continued to outperform and generate alpha:
Just Capital’s full slate of index concepts include:
The top performing index since inception is the Accountability to Stakeholders Index with 19.1% Alpha. This issue index highlights the financial performance and impact of investing in companies that prioritize good governance with diverse, independent boards that oversee corporate performance on key environmental, health, safety, and social matters. JUST Capital’s “Prioritize accountability to all stakeholders” Issue accounts for 2.1% of a company’s score in our Rankings of America’s Most JUST Companies, and covers three metrics encompassing 10 data points, tracking Board Independence, Board Diversity, and Board Oversight of JUST Issues, including if ESG-related performance is linked to compensation for employees and executives.
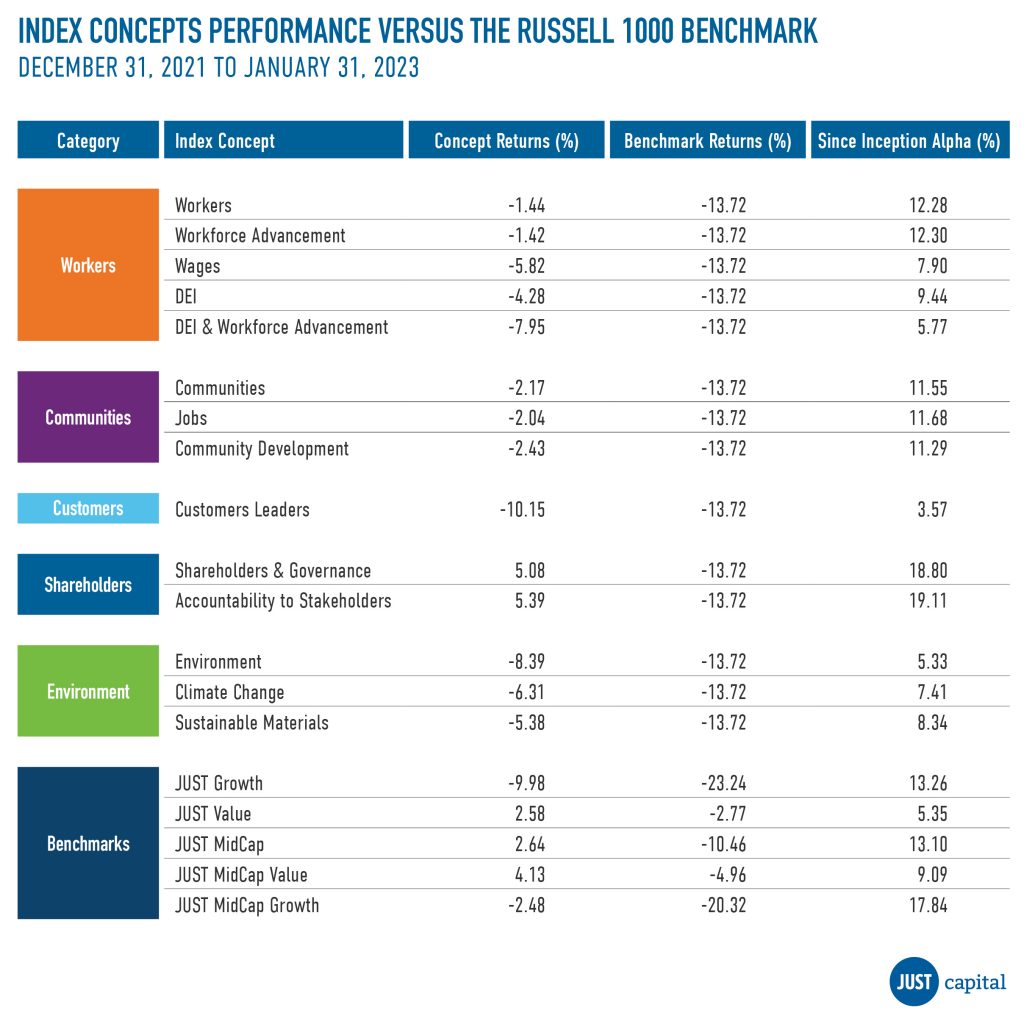
The table below illustrates the cumulative performance and related alpha for all 19 indexes against their benchmarks from December 31, 2021 to January 31, 2023:
Explore additional top performing indexes within the other stakeholder and benchmark groups below and visit our microsite to explore all related charts and data.
Outperforming Index Concept: Workforce Advancement Leaders
Since Inception Alpha vs. Russell 1000 Benchmark: 12.3%
According to JUST Capital’s survey research, Americans identified Workforce Advancement as one of the top Issues companies should prioritize, and our data set tracks corporate performance on five data points: Average Hours of Training or Career Development Per Employee, Career Opportunities Rating, Tuition Reimbursement, Retention Rate, and Internal Hiring Rate. This concept tracks the financial performance and social impact of an intersection of companies in our Rankings that prioritize upward mobility and the professional advancement of their workforces. The Workforce Advancement Issue accounts for 7.1% of a company’s score in our Rankings of America’s Most JUST Companies.
Compared to the Russell 1000, Workforce Advancement Leaders Are:
Outperforming Index Concept: Jobs Leaders
Since Inception Alpha vs. Russell 1000 Benchmark: 11.6%
Americans agree that companies should serve their communities where they operate, and this concept helps investors track the performance of companies that prioritize job creation within those communities. Our data set covers four key Issues encompassing 42 data points, including Employee-Led Giving and Volunteering, Opportunities for Local Businesses, Local School Support, Percent of U.S. Jobs Created, and more. The Local Job Creation Issue accounts for 11.1% of a company’s score in our Rankings of America’s Most JUST Companies.
Compared to the Russell 1000, Jobs Leaders:
Outperforming Index Concept: Customers Leaders
Since Inception Alpha vs. Russell 1000 Benchmark: 3.6%
Customers are a key corporate stakeholder, and this index concept helps investors track the financial performance and social impact of companies that make customers a core priority. Overall, Customer Issues – including whether companies protect data privacy, make beneficial products, and more – account for 14% of a company’s score in our Rankings of America’s Most JUST Companies.
Compared to Russell the 1000, Customers Leaders:
Outperforming Index Concept: Sustainable Materials Leaders
Since Inception Alpha vs. Russell 1000 Benchmark: 8.3%
This index concept tracks companies that prioritize the environment through use of natural resources, renewable energy, and waste reduction practices. The IPCC’s August report found that unless there is an immediate, rapid, and large-scale reduction in greenhouse gas emissions, limiting warming to 1.5 degrees Celsius or even 2 degrees Celsius will be beyond reach. The “Uses sustainable materials” Issue accounts for 3.5% of a company’s score in our Rankings of America’s Most JUST Companies.
Compared to the Russell 1000, Sustainable Materials Leaders:
Outperforming Concept: JUST Midcap Growth Leaders
Since Inception Alpha vs Russell 1000: 17.8%
Within the benchmarks category, JUST MidCap Growth Leaders has been leading the performance since inception. The JUST MidCap Growth index concept takes the top quintile of companies in JUST Capital’s annual Rankings within the Russell 1000 MidCap Growth Index. This index concept exposes investors to a stylized benchmark portfolio concentrated around America’s Most JUST Companies.
Compared to Russell 100 companies, JUST Midcap Growth Leaders:
If you are interested in supporting our philanthropic mission by licensing our unique data, we are happy to discuss data needs, index licensing, and other ways we can partner. Please reach out to ESG Business Development Associate, Michael Wirtz, at mwirtz@justcapital.com.

The rise of ESG (environmental, social, and governance) investing in the United States has been rapid. Recently, it has also become a divisive political issue. Some critics, such as the The State Financial Officers Foundation, have gone so far as to label ESG a contributor to the elevated inflation lingering in the country. Given that some of the underlying factors typically covered by ESG investing often relate to the themes and issues we cover in our own Rankings, we thought we’d take a closer look at this, and see what the data has to say.
Annual inflation has cooled from the four-decade high seen last summer, but recent data shows it remains higher than many had expected. As a result, the Federal Reserve may raise interest rates even higher in the months ahead to make sure inflation declines further until it reaches its long-term 2% target.
But even as inflation declines, it still remains a singular source of stress on family budgets for essentials like grocery staples, commuting, and energy services. Indeed, polling shows Americans believe inflation is the number-one issue facing the country today. Large numbers of Americans are currently struggling with economic hardship, especially as inflation reduces wages’ purchasing power, and indeed real wages have, on average, declined over the past year.
The literature suggests there are four main causes of the current inflation: First, supply side causes due to the COVID-19 pandemic, Russia’s invasion of Ukraine, and China’s zero COVID policy which strained supply chains and restricted the supply of many goods. Responding to the pandemic, public officials then, on the monetary side, expanded the money supply (the second cause) and also, on the fiscal side, increased government spending (the third cause), fueling demand. Finally, as demand rose, companies were able to regularly raise prices which concomitantly drove higher profits.
Though there are ongoing academic and policy debates about the relative influence of these causes and the degree to which they feed into each other, there is precious little economic evidence to suggest that corporate and investor-led ESG strategies have been a major factor driving inflation at this point in time.
Of course, one main challenge in evaluating the connection between ESG and inflation is that different people define ESG in different ways. Much of the argument that ESG contributes to inflation is centered on the energy complex, the opposition to fossil fuel production and usage, and increased gas prices. Although there are real debates about the relationship between ESG, energy supply, and commodity prices, there is little clear evidence to suggest that ESG strategies by companies and investors pushed gas and crude oil prices higher in 2022. Indeed, executives of major oil and gas firms have themselves stated that ESG is not one of the main reasons wearing on oil and gas production growth.
As regular JUST followers know, our approach centers not on an ESG approach but rather a stakeholder-oriented approach in which the factors that matter are identified and prioritized by the American people. Nevertheless, given the above, we thought it would be interesting to examine the connections between our own company Rankings and indexes, and inflation.
What we found is that as inflation further exacerbates nominal declines in equities and indexes, investors can turn to JUST Capital’s approach to identifying corporate stakeholder leadership to shield their portfolios’ real returns. Just companies tend to outperform their peers, and in fact JUST Capital’s U.S. Large Cap Diversified Index (JULCD) and JUST 100 Total Returns Index (JUONETR) have both outperformed their benchmarks since their inception (respectively by 9.4% and 13.3% as of December 31, 2022).
Companies, meanwhile, can unlock value by enacting human capital policies to increase employee satisfaction, retention, productivity, and ultimately performance. Productivity, whereby the same unit of input yields additional output, is key. Though inflation squeezes margins, especially through cost pressures, companies can maintain or even increase their profitability by increasing productivity.
Research has shown that higher wages for low-income workers result in higher productivity, and JUST Capital survey research found that the American public overwhelmingly agrees (87%) that companies should regularly increase wages to keep up with the rapidly rising cost of living. Companies can hedge against inflation by increasing productivity not only by raising employee wages, but also by investing in benefits packages, career advancement, worker health and safety, and flexibility.
As investors and companies face the economic uncertainties of 2023, one strategy that can help protect margins and outflank the challenge of inflation is to turn to JUST Capital’s stakeholder-focused approach based on the priorities of the American public. Our research suggests that it is a win-win for not only investors and companies, but also for the American public in general.
Using data from JUST Capital’s Rankings of America’s Most JUST Companies, USA Financial has developed four account strategies that have seen phenomenal growth in assets under management (AUM). These strategies have delivered strong performance not only in 2022, but since inception.
The strategies rely on JUST Capital’s Overall Weighted Score, which takes into account the 20 core Issues determined through our survey research across key business stakeholders. Our 2023 Rankings continue to reflect the increased interest Americans show for workers’ issues, and these investment vehicles have quickly gained support from investors who care about good performance along with issues like workers’ pay and health and safety.
The funds have been popular with investors nationally, with a large concentration in the Midwest, and especially those in the 55+ age demographic. Because our Rankings reflect the issues that the majority of Americans are concerned about, these investment strategies appeal to investors across geography, generational divides, and political spectrums.
“The dynamic nature of the companies that rise to the top of JUST Capital Rankings are attractive investment options,” USA Financial CEO Mike Walters told us. “And knowing that these large companies are conscious of their place in the world and responsibility for the greater good makes the JUST Capital 100 a great starting point to apply our criteria.”
USA Financial offers four active strategies using JUST Capital’s Overall Weighted Score:
Depending on the selected strategy, USA Financial Formulas applies proprietary formulaic criteria or its Value Line Research (VLR) Ranking to the holdings obtained from our JUST 100 and JUST Industry Leaders when managing the account.
AUM has more than doubled in these strategies, with combined AUM growth of 252.6% from December 2021 to December 2022. The best performing of the four is the JUST Capital Industry Leaders Sustainable Equity Freedom strategy, delivering an alpha of 65.45% since inception and an alpha of 18.87% in 2022.
The companies comprising these USA Financial strategies have demonstrated their commitment to delivering value to all their stakeholders, not just their shareholders. They have shown that it is possible to achieve strong performance on issues that Americans prioritize without incurring additional costs. JUST Rankings serve as a scorecard for just business behavior and these strategies demonstrate that just business behavior pays off in the long run.
If you would like to learn more about JUST Capital’s Investor Strategies work, contact our team, and if you would like to license our data, fill out this form. You can also contact USA Financial to learn more about its strategies discussed above.
The U.S. fixed income (bond) market rivals the U.S. equity market in valuation, with total issuance of $49.1 trillion, and $10 trillion, or 20% of that is corporate debt. In this piece, we’ll investigate the corporate debt market, looking both at how opportunities in debt compare to those in equities in this moment, and how companies that prioritize all their stakeholders as represented in the JUST Rankings enjoy better credit ratings.
After the 2008 global financial crisis, the Fed and other central banks engaged in unprecedented quantitative easing, suppressing global interest rates. While low interest rates supported equity and other asset (including bond) prices, they were a challenge for retirees and other savers needing current income. More recently, renewed inflation accompanying the emergence from the economic disruptions of COVID forced the Fed to increase rates in response, leading to declines across both stocks and bonds in 2022.
As investors consider what’s next for interest rates, economic growth, and prospective returns from different asset classes, the natural, evergreen question of “Where should I invest now?” is front of mind. One broad comparison worth looking at is the expected earnings yield on equities versus the available yield on bonds. At a macroeconomic level, investors choose between earning the yield from bonds in coupon payments, or the income yield from stocks. In the chart below, the corporate earnings yields are the actual realized earnings for S&P 500 companies in that year divided by the S&P 500 index value at the prior year’s end. The value for 2023 is based on consensus 2023 earnings estimates.
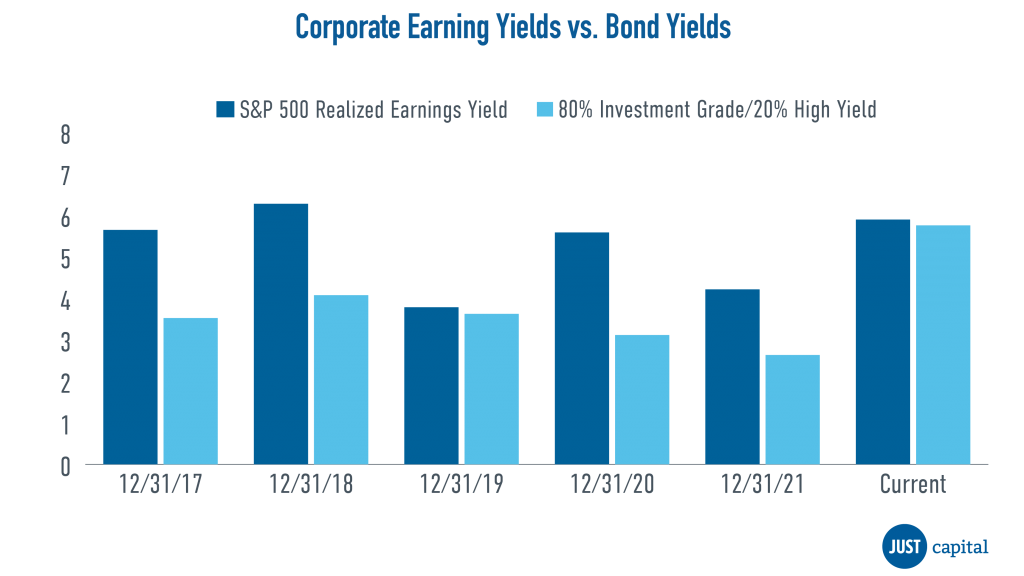
We generally see the S&P 500 earnings yield handily outperforming the available yield from corporate bonds over this period. The exception, of course, came in 2020 when earnings collapsed during COVID. However, a portfolio of corporate investment grade and high yield bonds now offers an attractive prospective yield compared to equities, suggesting that the time to invest in corporate debt may be upon us. While the asset price adjustment of 2022 was painful for both equity and debt holders, an era of more normal interest rate policy in a pro-inflationary economy will offer opportunities for investors to diversify risk across the economic cycle.
JUST Capital tracks companies in the Russell 1000, and we’ve observed a strong relationship between a company’s placement in our Annual Rankings of America’s Most JUST Companies and its long-term credit rating. Companies that succeed in prioritizing their workers, customers, communities, shareholders, and the environment – as reflected in the JUST Rankings – also enjoy the advantage of better credit ratings and lower borrowing costs.
The chart below shows the mean JUST 2023 rank within each S&P long-term credit rating category at December 31, 2022. (Of the Russell 1000, 27 ranked companies with a “Not Rated” credit designation and 251 ranked companies with no credit designation were excluded. The “spikes” on the edges of the chart, at ratings AA and CC, are due to the small numbers of companies in those categories.)
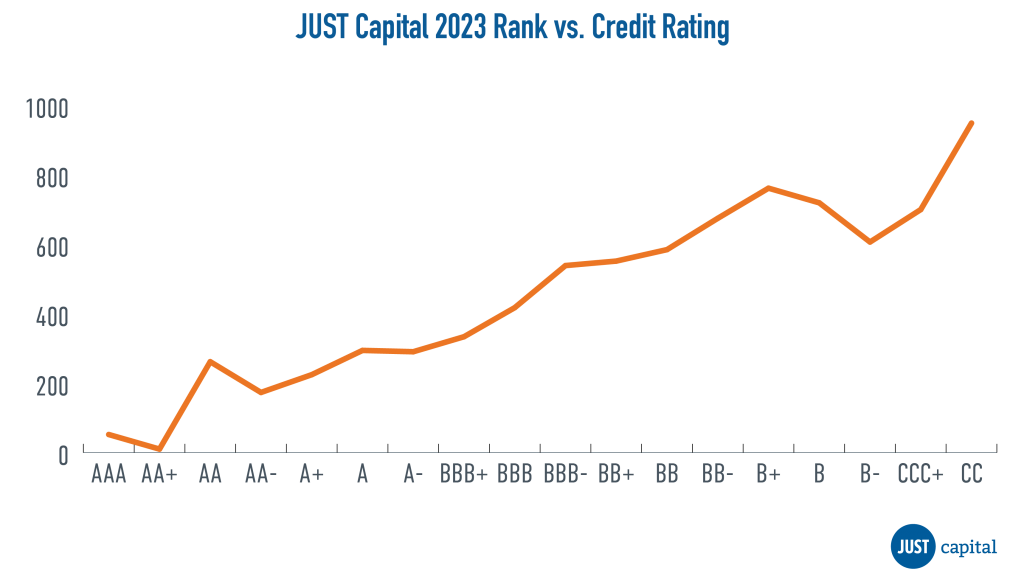
This correlation should not be surprising. Although credit ratings focus on financial measures of strength and JUST Rankings are based largely on non-financial measures of corporate stakeholder performance, they both distinguish companies on management quality and how they manage the balance of risks and opportunities.
Building on this finding, we’ll be further exploring the debt markets and the relationship between JUST Rankings and corporate bonds further throughout this year.
January 19, 2023
By Mona Patni
2022 was a challenging and volatile year for both stock and bond markets. The war in Ukraine,a 40-year high in inflation, historically aggressive Fed rate hikes, and growing concerns about economic and earnings recessions were the main sources of bond and equity markets’ struggles. However, the final quarter of the year did bring some relief with gains in Q4 but still resulted in the worst year for the S&P 500 index since the Global Financial Crisis.
By market capitalization, large-caps slightly out-performed small-caps in the fourth quarter, but modestly outperformed throughout 2022. Large-cap outperformance and small-cap underperformance throughout 2022 was driven by concerns about future economic growth and higher interest rates. Value stocks massively outperformed growth stocks all year and that trend continued in the fourth quarter. Underwhelming earnings weighed on tech stocks in the final three months of the year, while concerns about slowing economic growth combined with rising bond yields hit richly valued tech stocks throughout 2022.
On a sector level, 10 of the 11 S&P 500 sectors finished the fourth quarter with a positive return, although only two of the 11 ended 2022 with gains. Energy outperformed other sectors not just in the fourth quarter but for all of 2022.
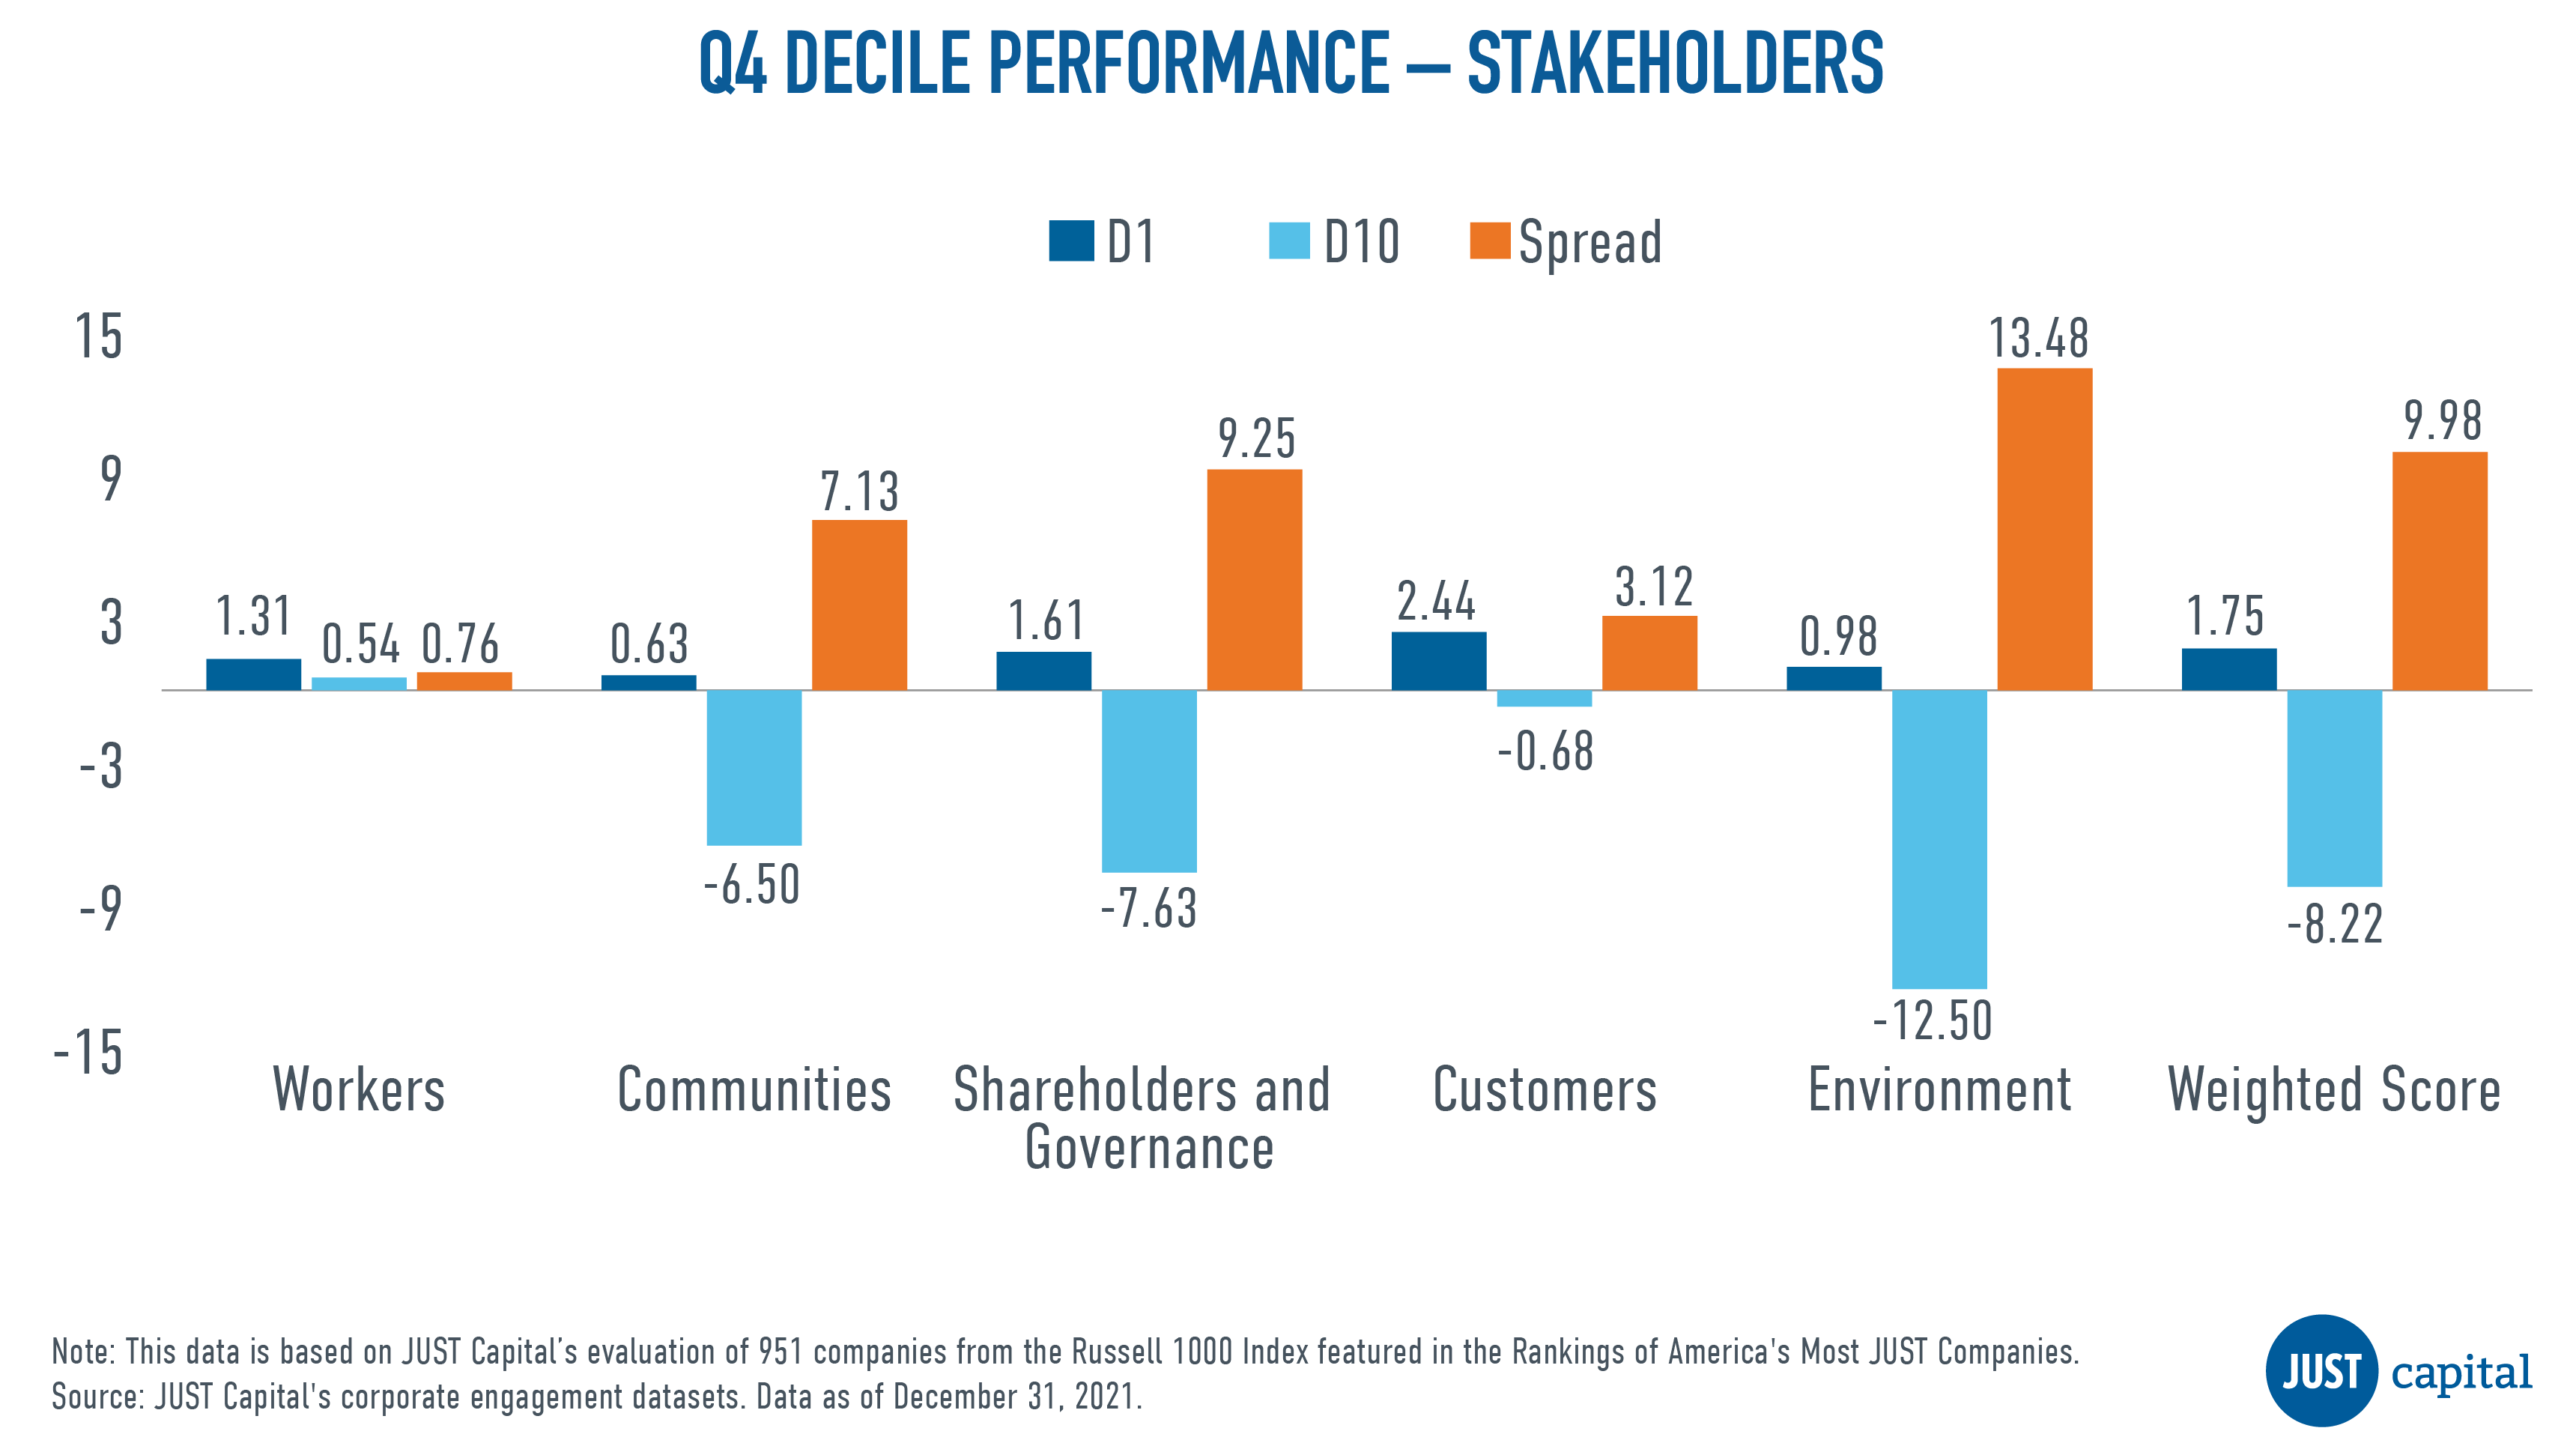
In Q4 2022, in which both stocks and bonds saw solid gains, JUST Capital found that all five of the stakeholders we track delivered positive performance. The Environment stakeholder delivered the best performance over this period with a long-short spread of 13.48%, followed by Shareholders and Governance stakeholder. For all stakeholders other than Workers, top decile stocks outperformed and bottom decile stocks underperformed the universe average; for Workers, the bottom decile outperformed the universe average.
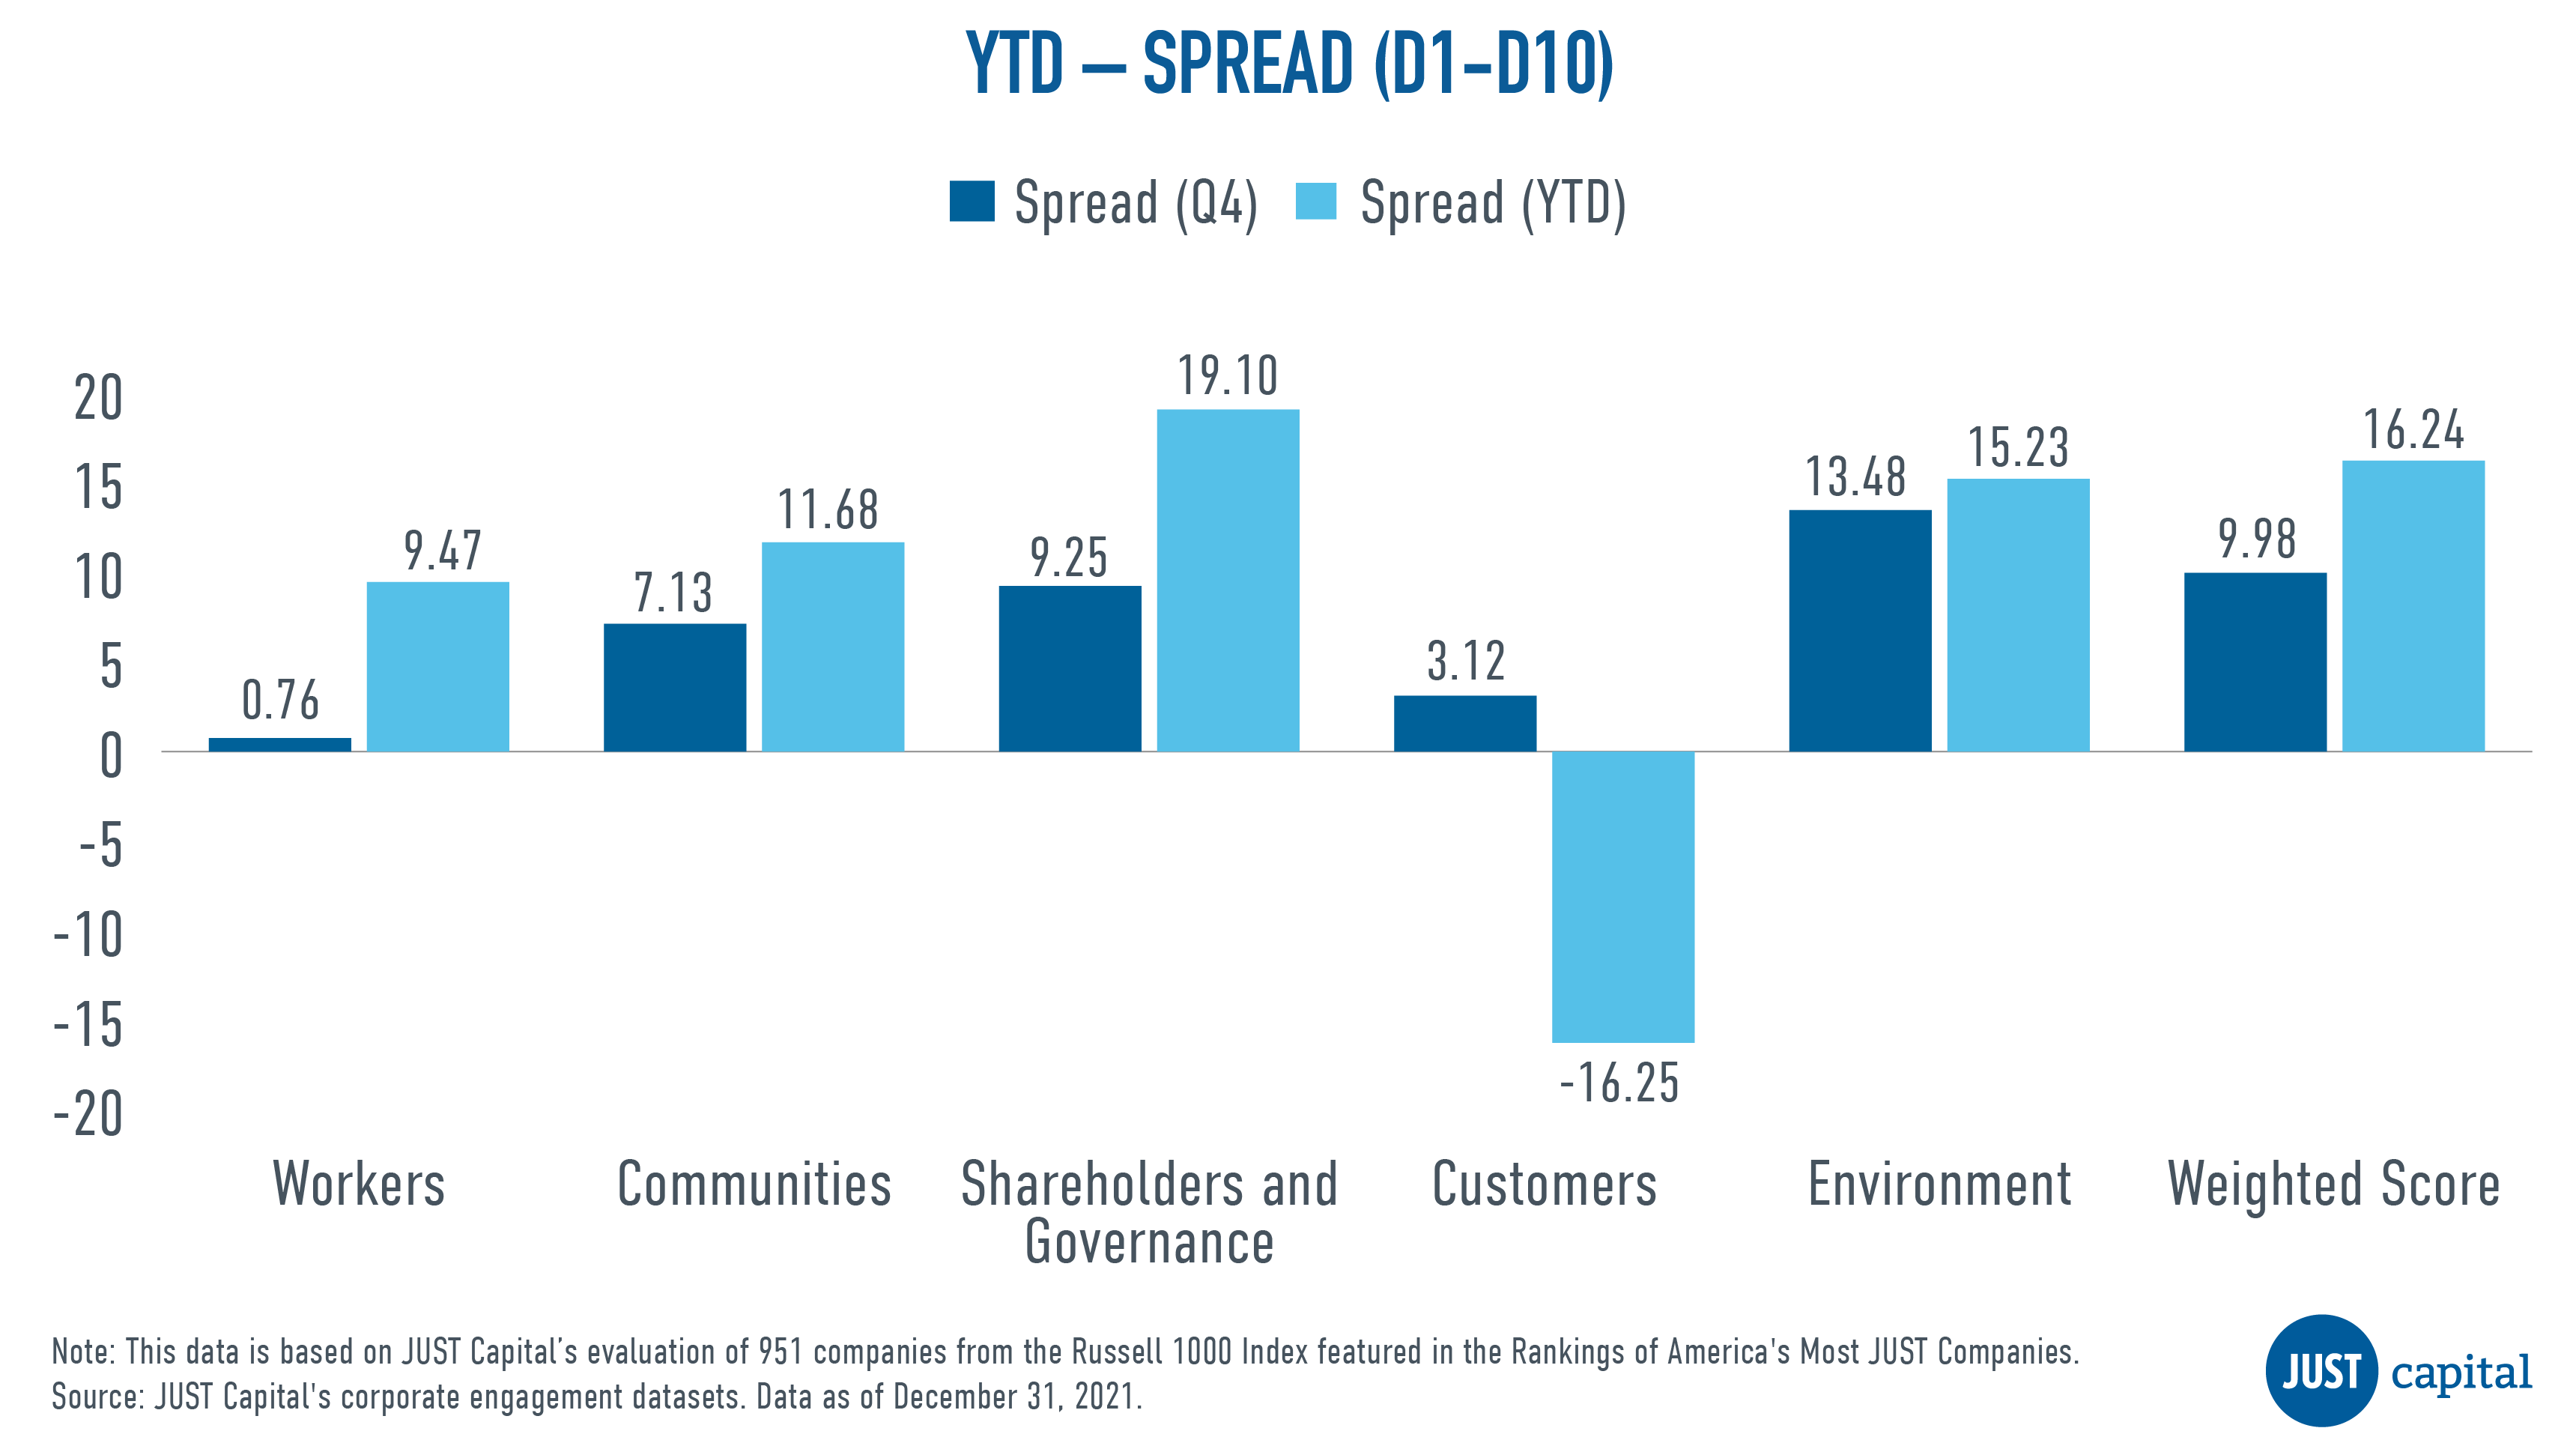
JUST Capital’s Overall Weighted Score takes into account the 20 core Issues determined through our survey research – including paying a living wage, creating a diverse, inclusive workplace, and helping combat climate change – across key business stakeholders: Workers, Communities, Shareholders and Governance, Customers, and the Environment. This Overall Weighted Score had a positive long-short spread of 9.98% in Q4 and delivered a 16.24% spread in 2022.
Shown below is the Year-to-Date (YTD) and Q4 performance, which is quantified by the spread between the top and bottom deciles of all the stakeholders and the overall weighted score.
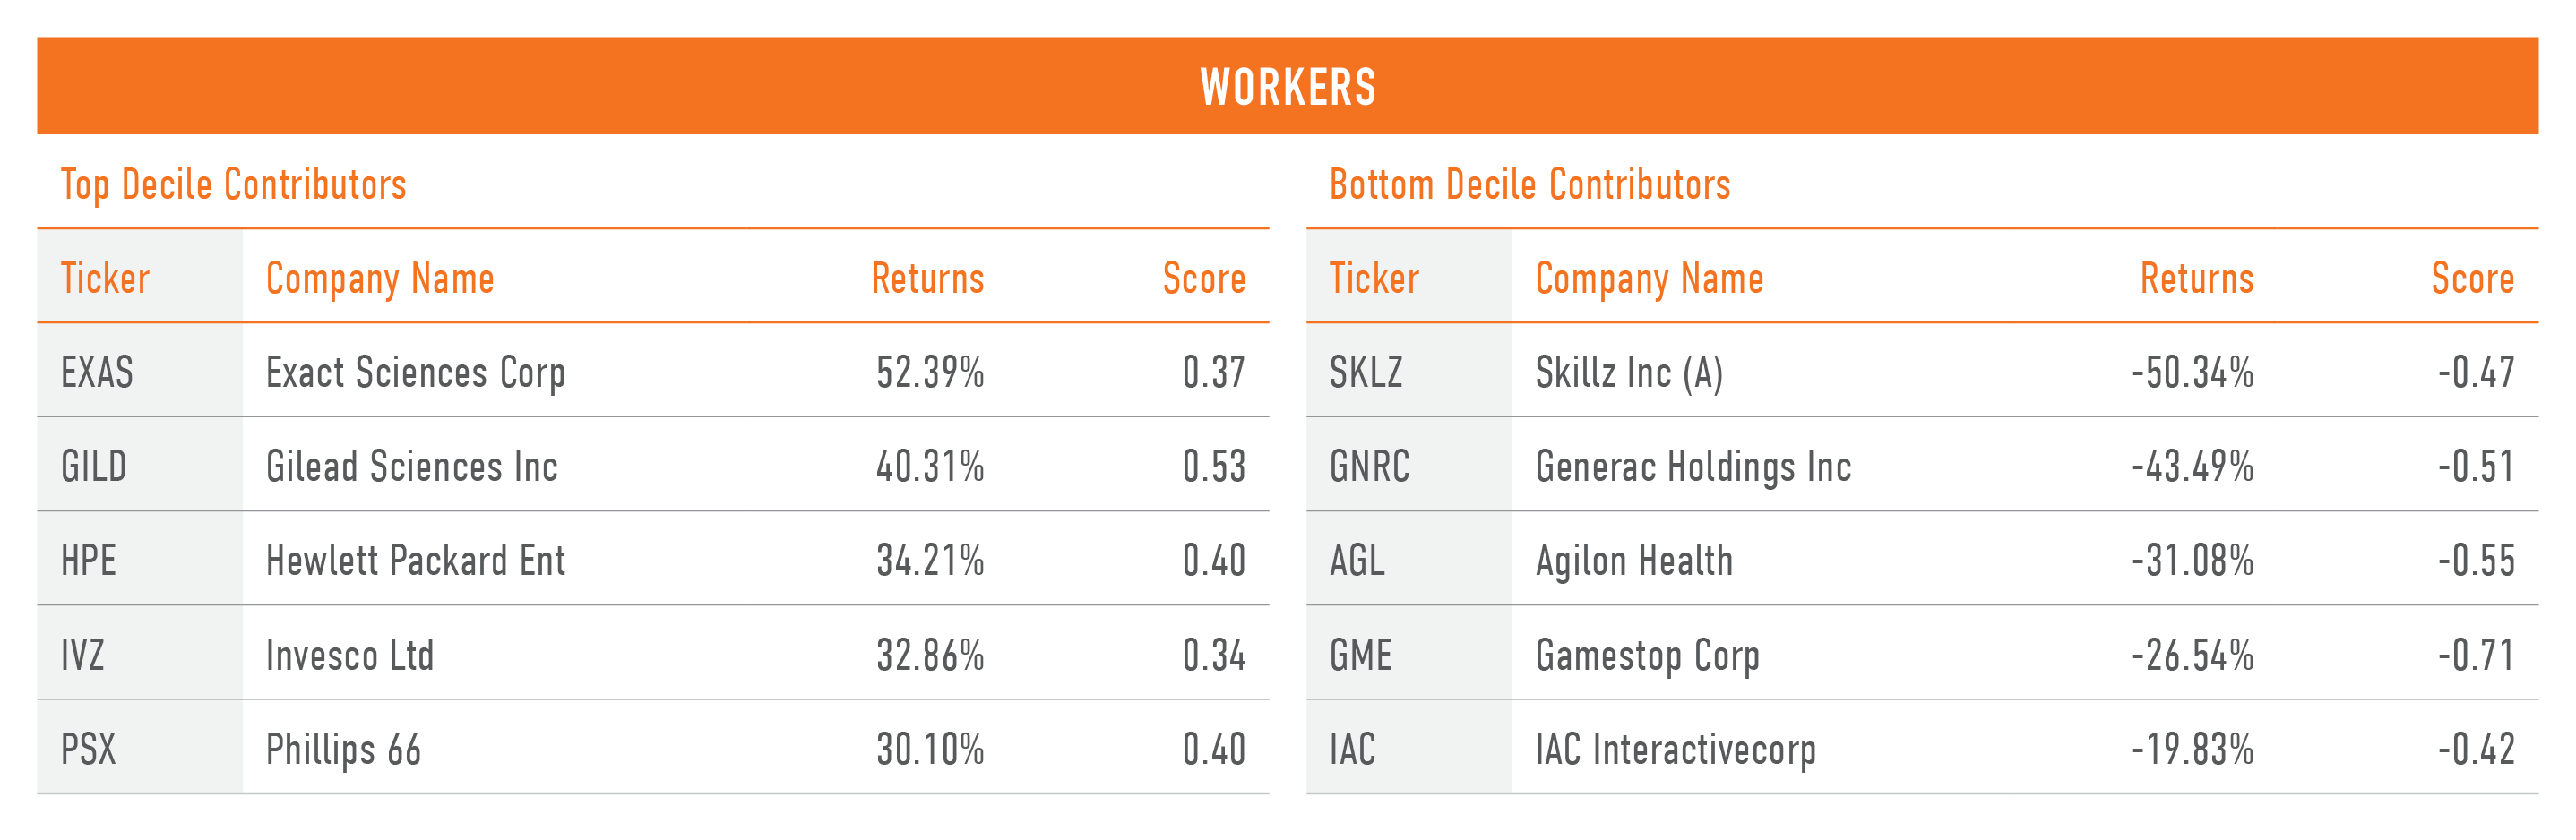
The Workers stakeholder measures a company across five Issues:
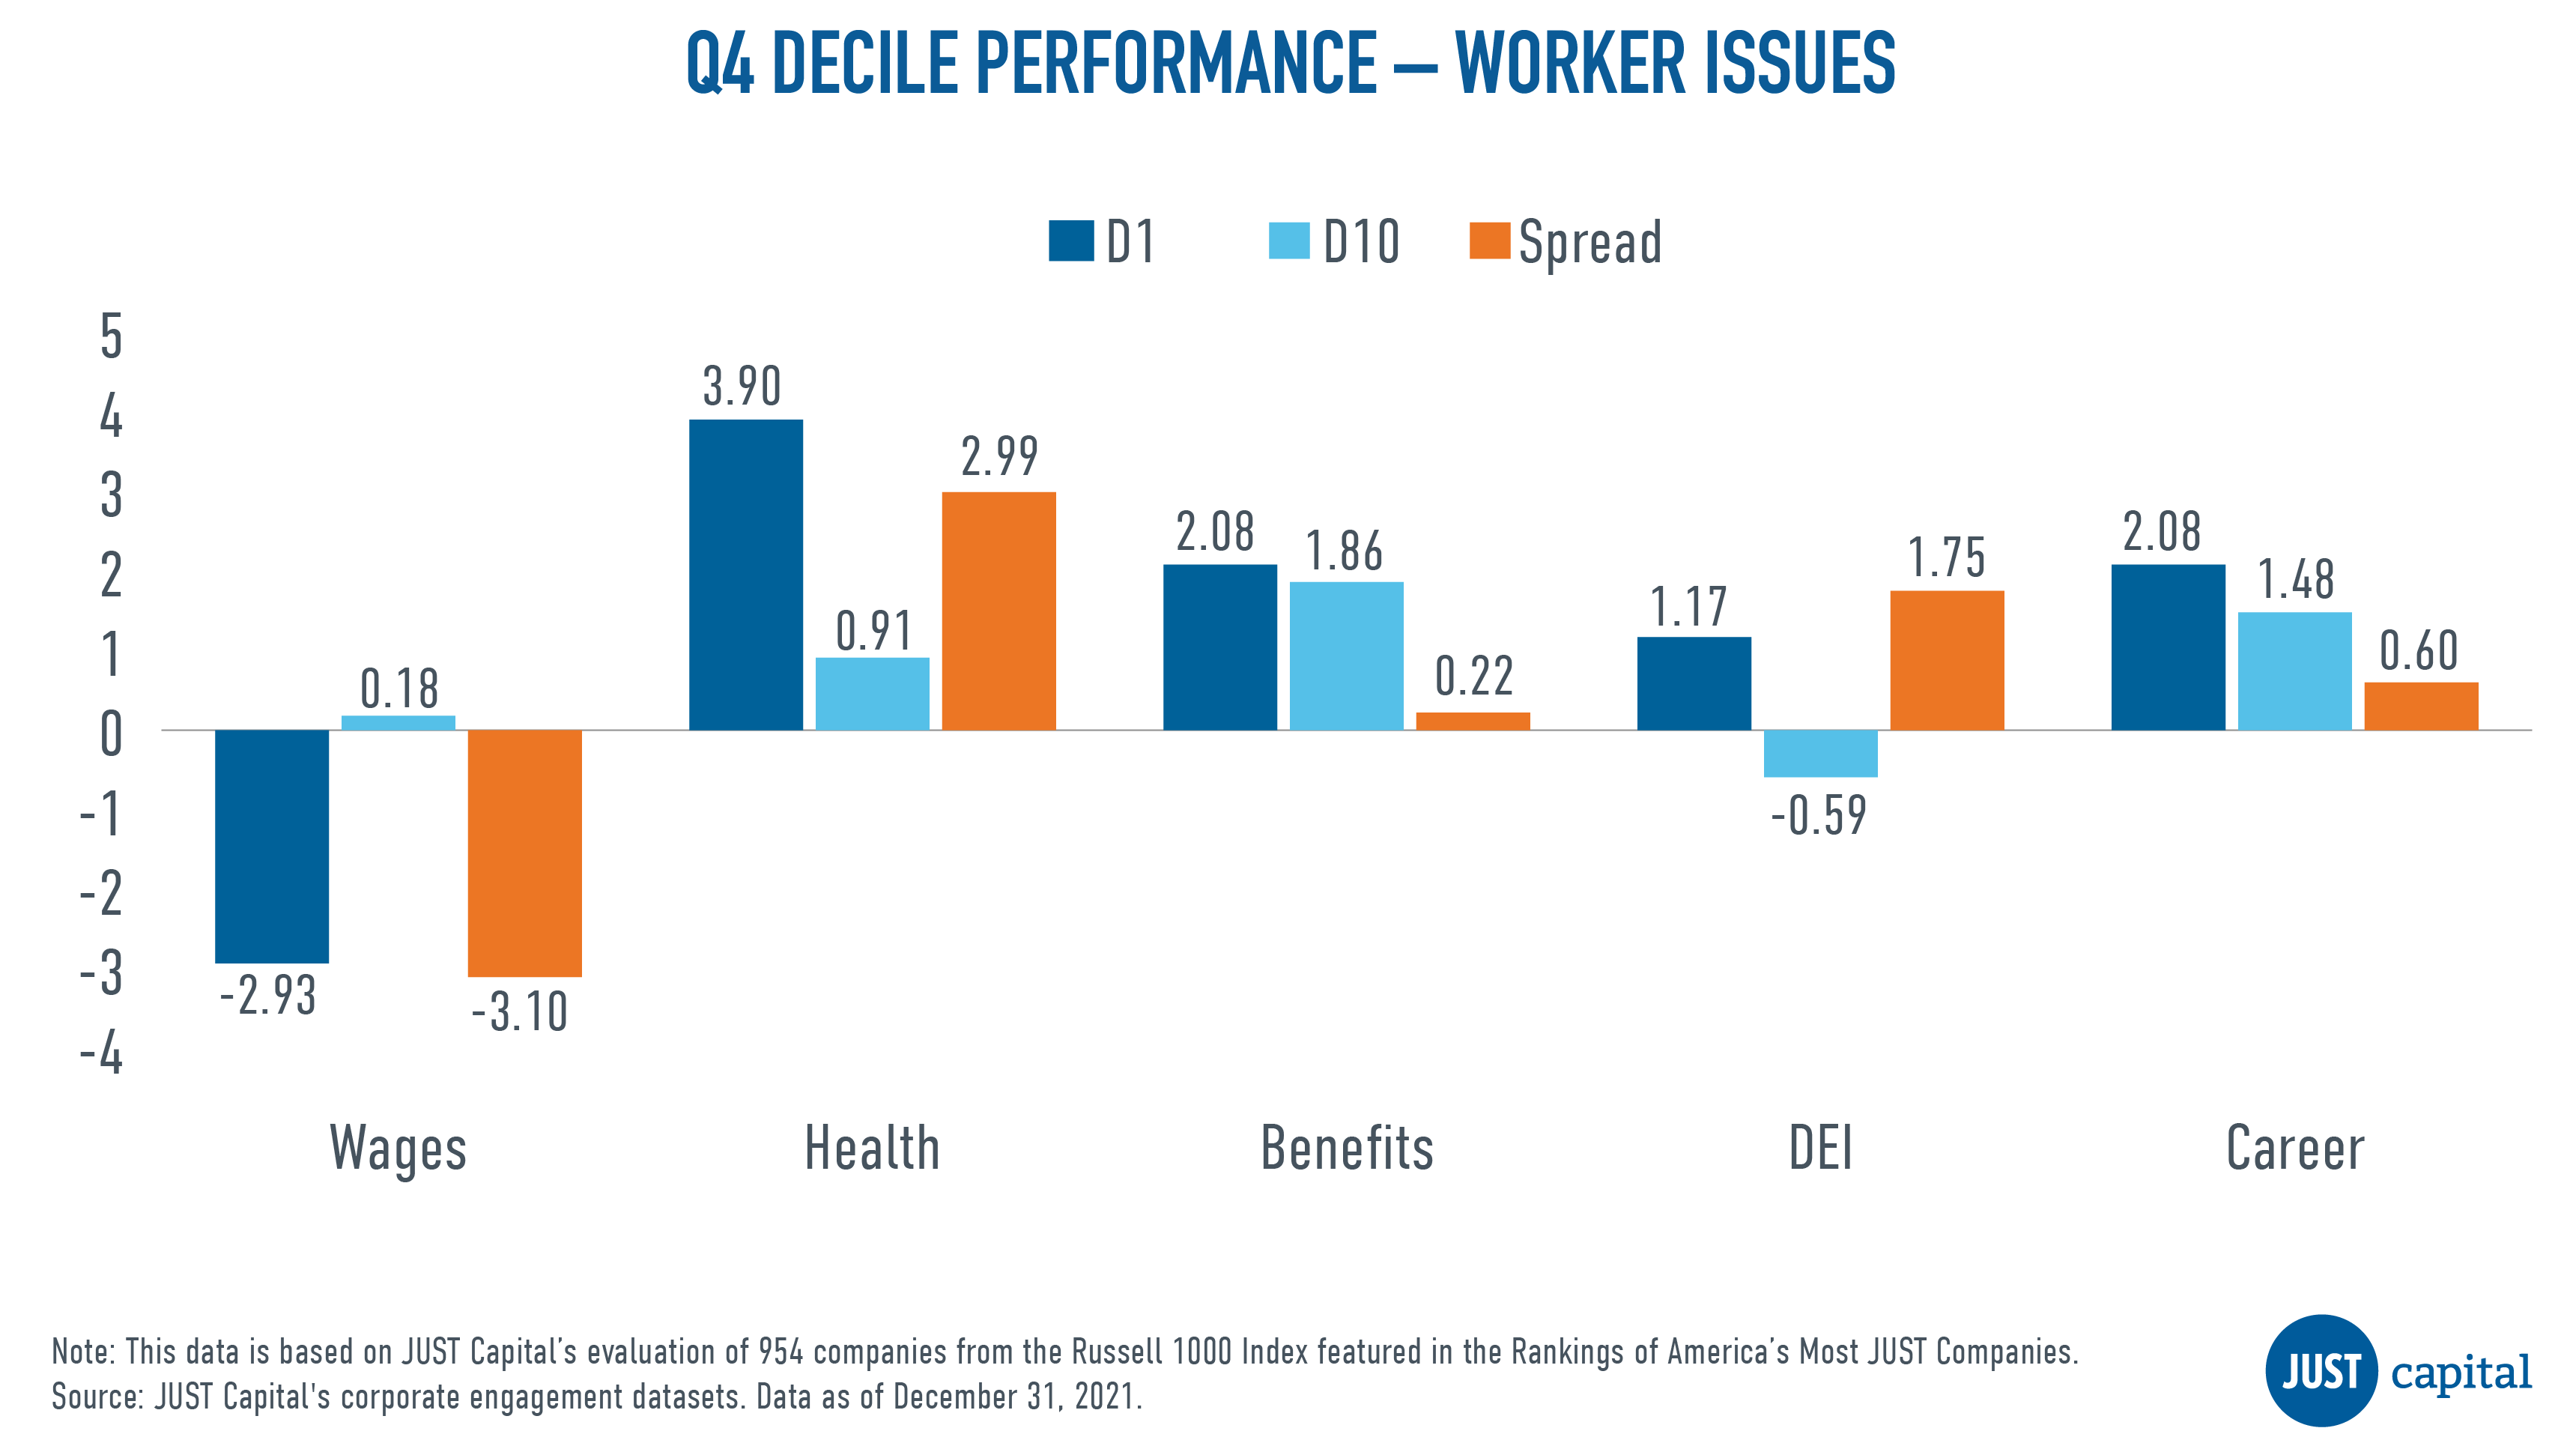
In Q4, we saw four out of five Worker Issues outperform. Underperformance in Wages was driven by negative performance from both top and bottom decile companies.
Shown below are the top and bottom five contributors to the top decile (D1), the top-ranked companies as measured by their Workers score, and the bottom decile (D10), the lowest-ranked companies as measured by their Worker score.
The Communities stakeholder measures a company across four Issues:
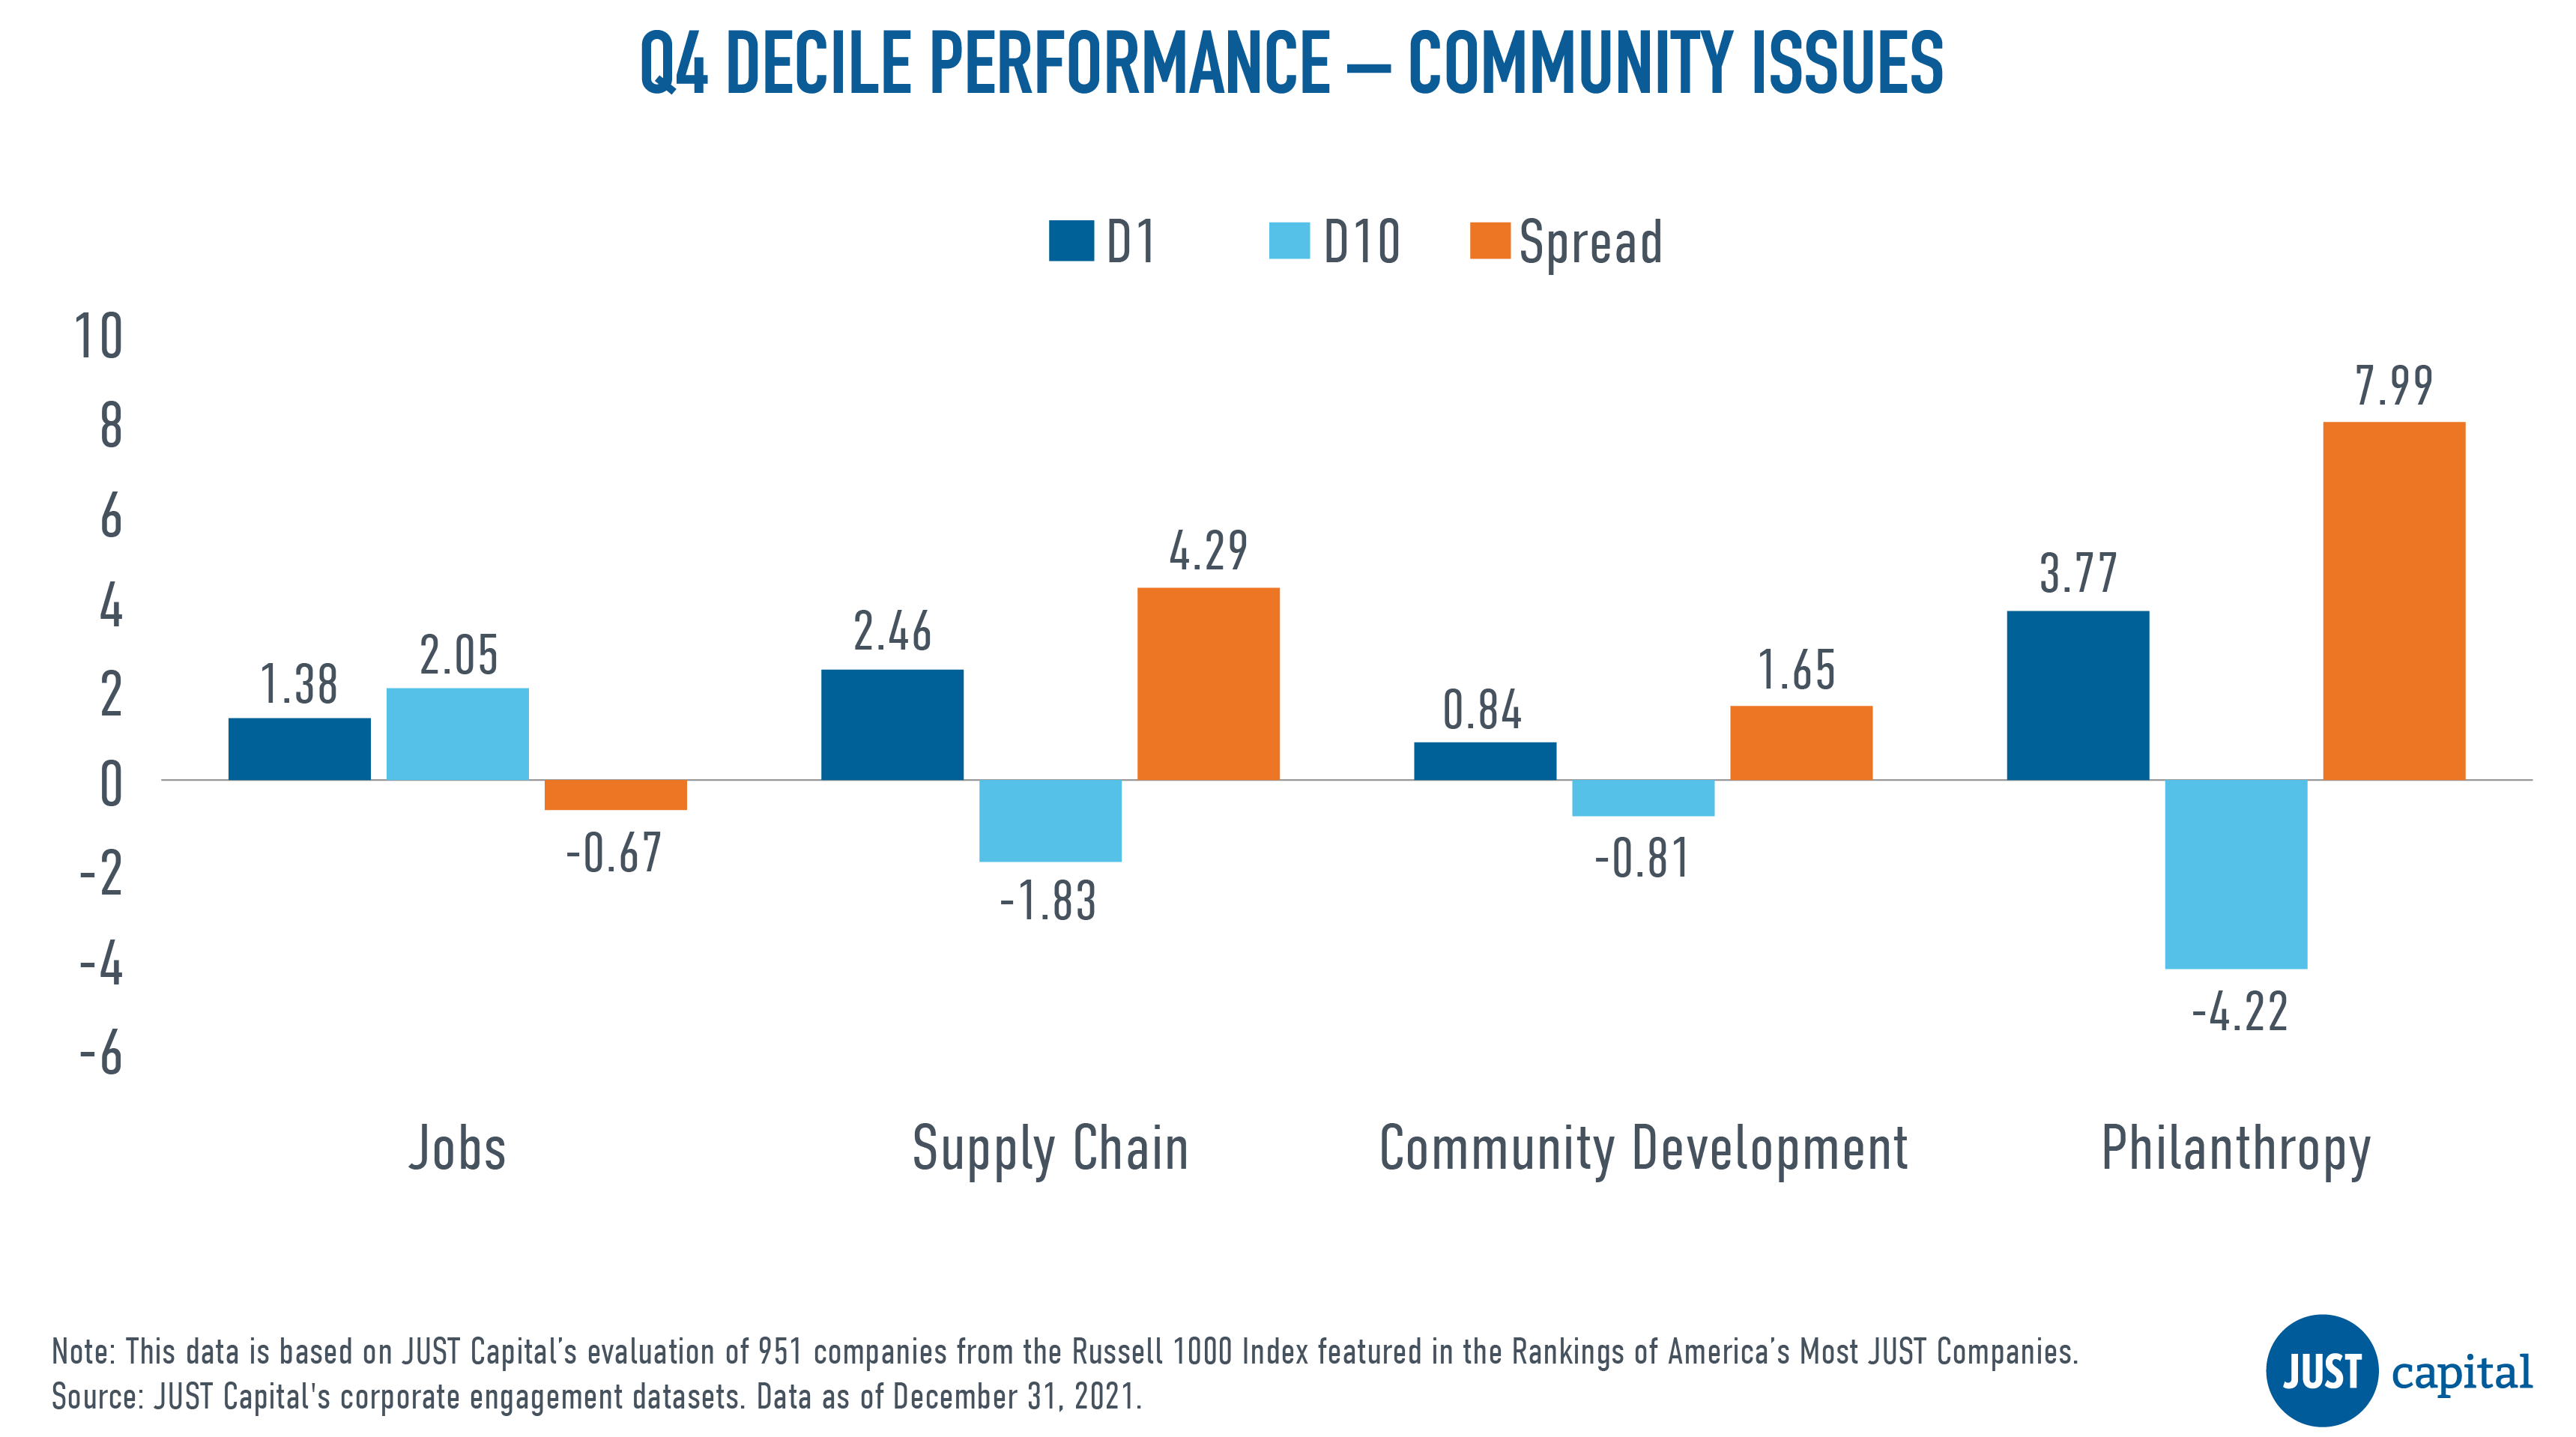
All issues with the exception of Jobs were positive contributors to the Communities stakeholder’s performance. Negative performance within Jobs was driven by the out-performance of bottom decile companies.
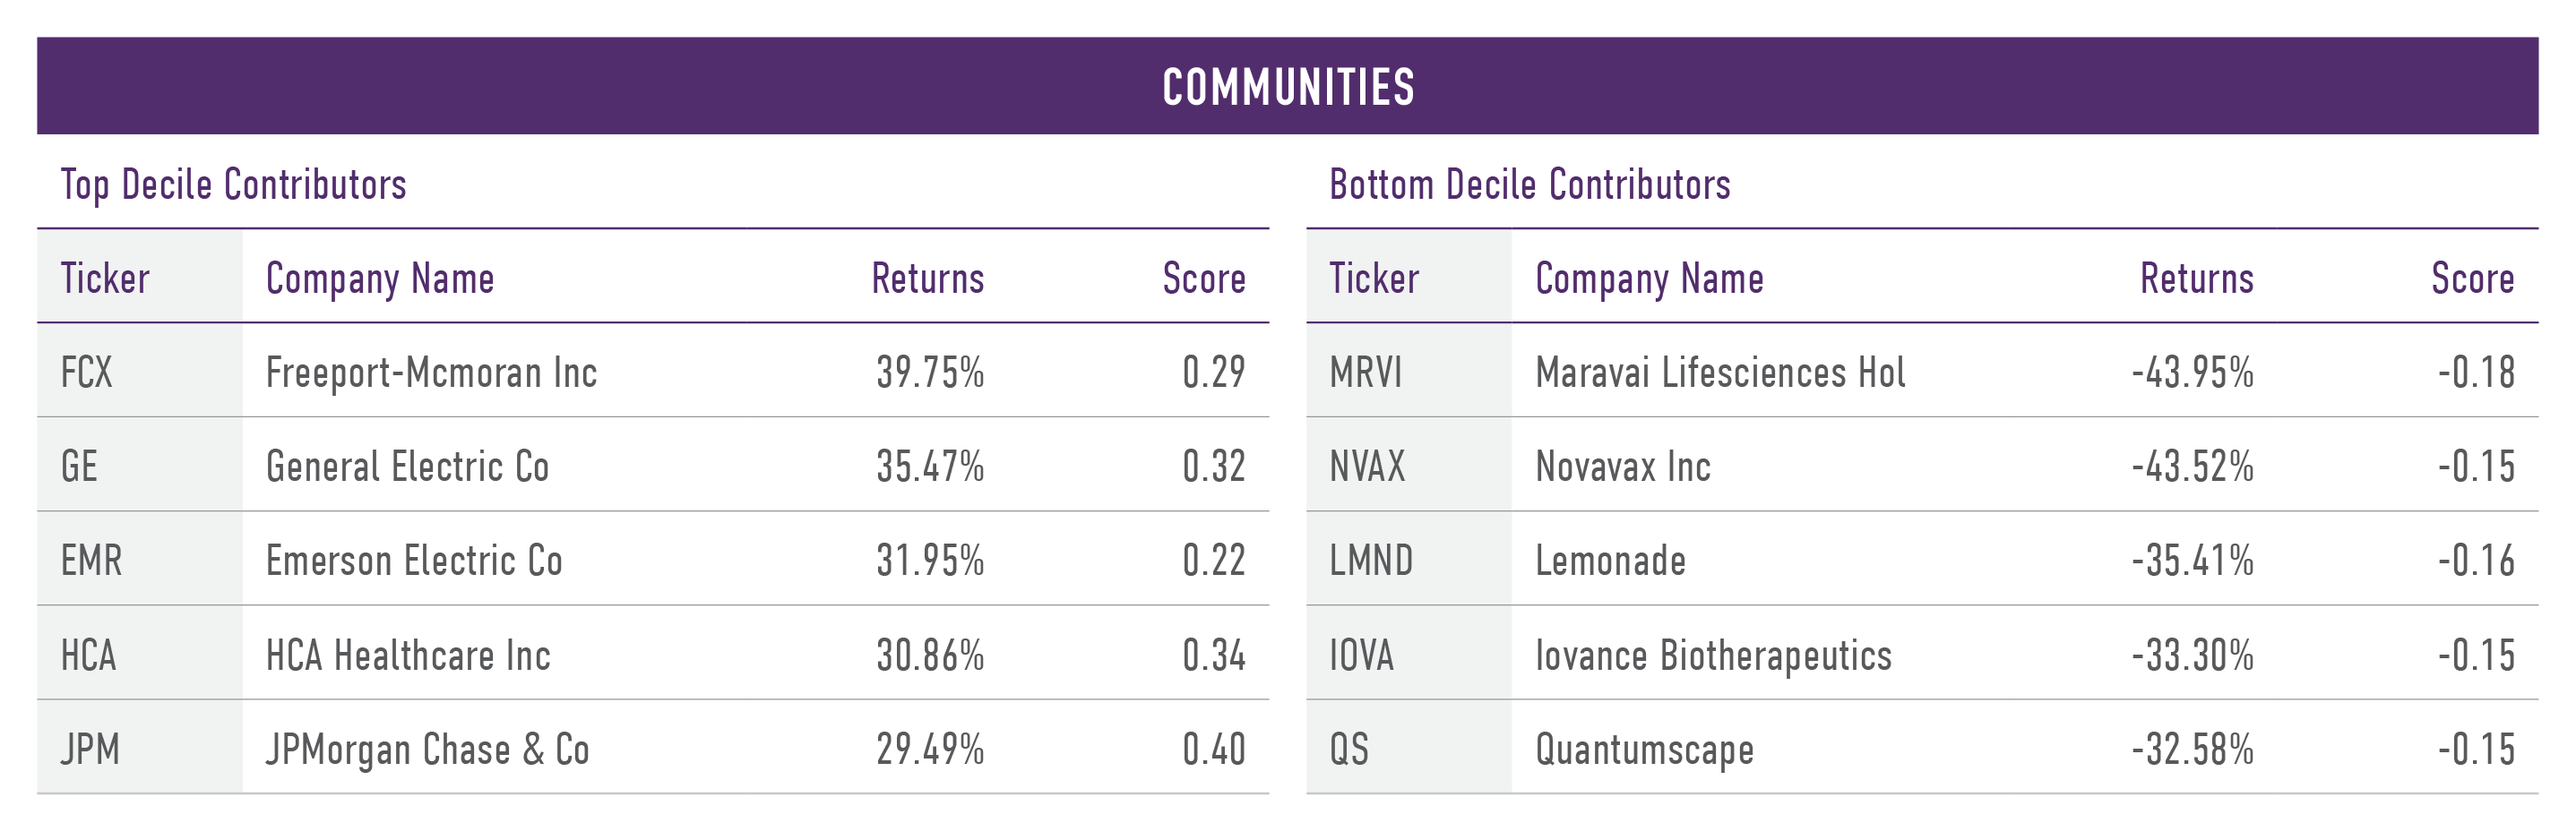
Shown below are the both top and bottom five contributors to the top decile (D1), the best-ranked companies as measured by their Communities score, and the bottom decile (D10), the worst-ranked companies as measured by their Communities score.
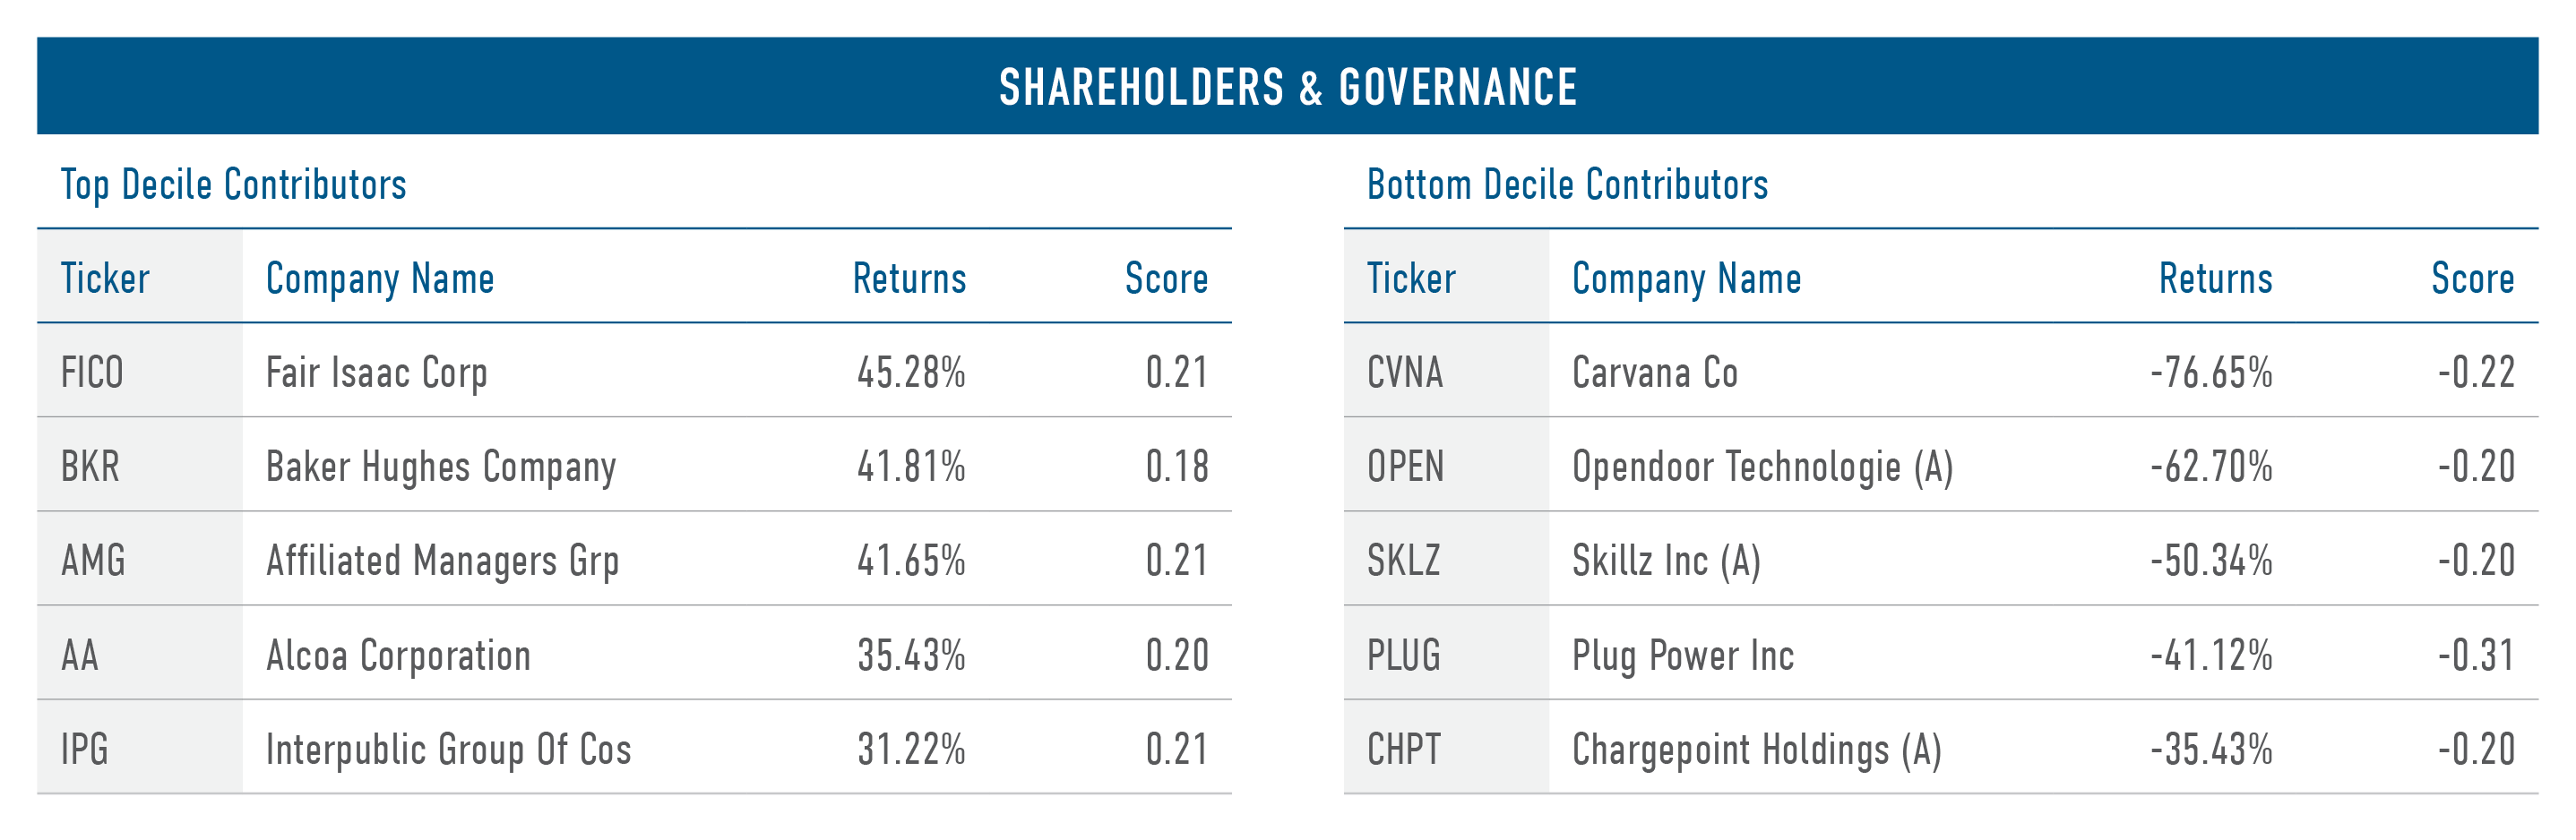
The Shareholders and Governance stakeholder measures a company across three Issues:
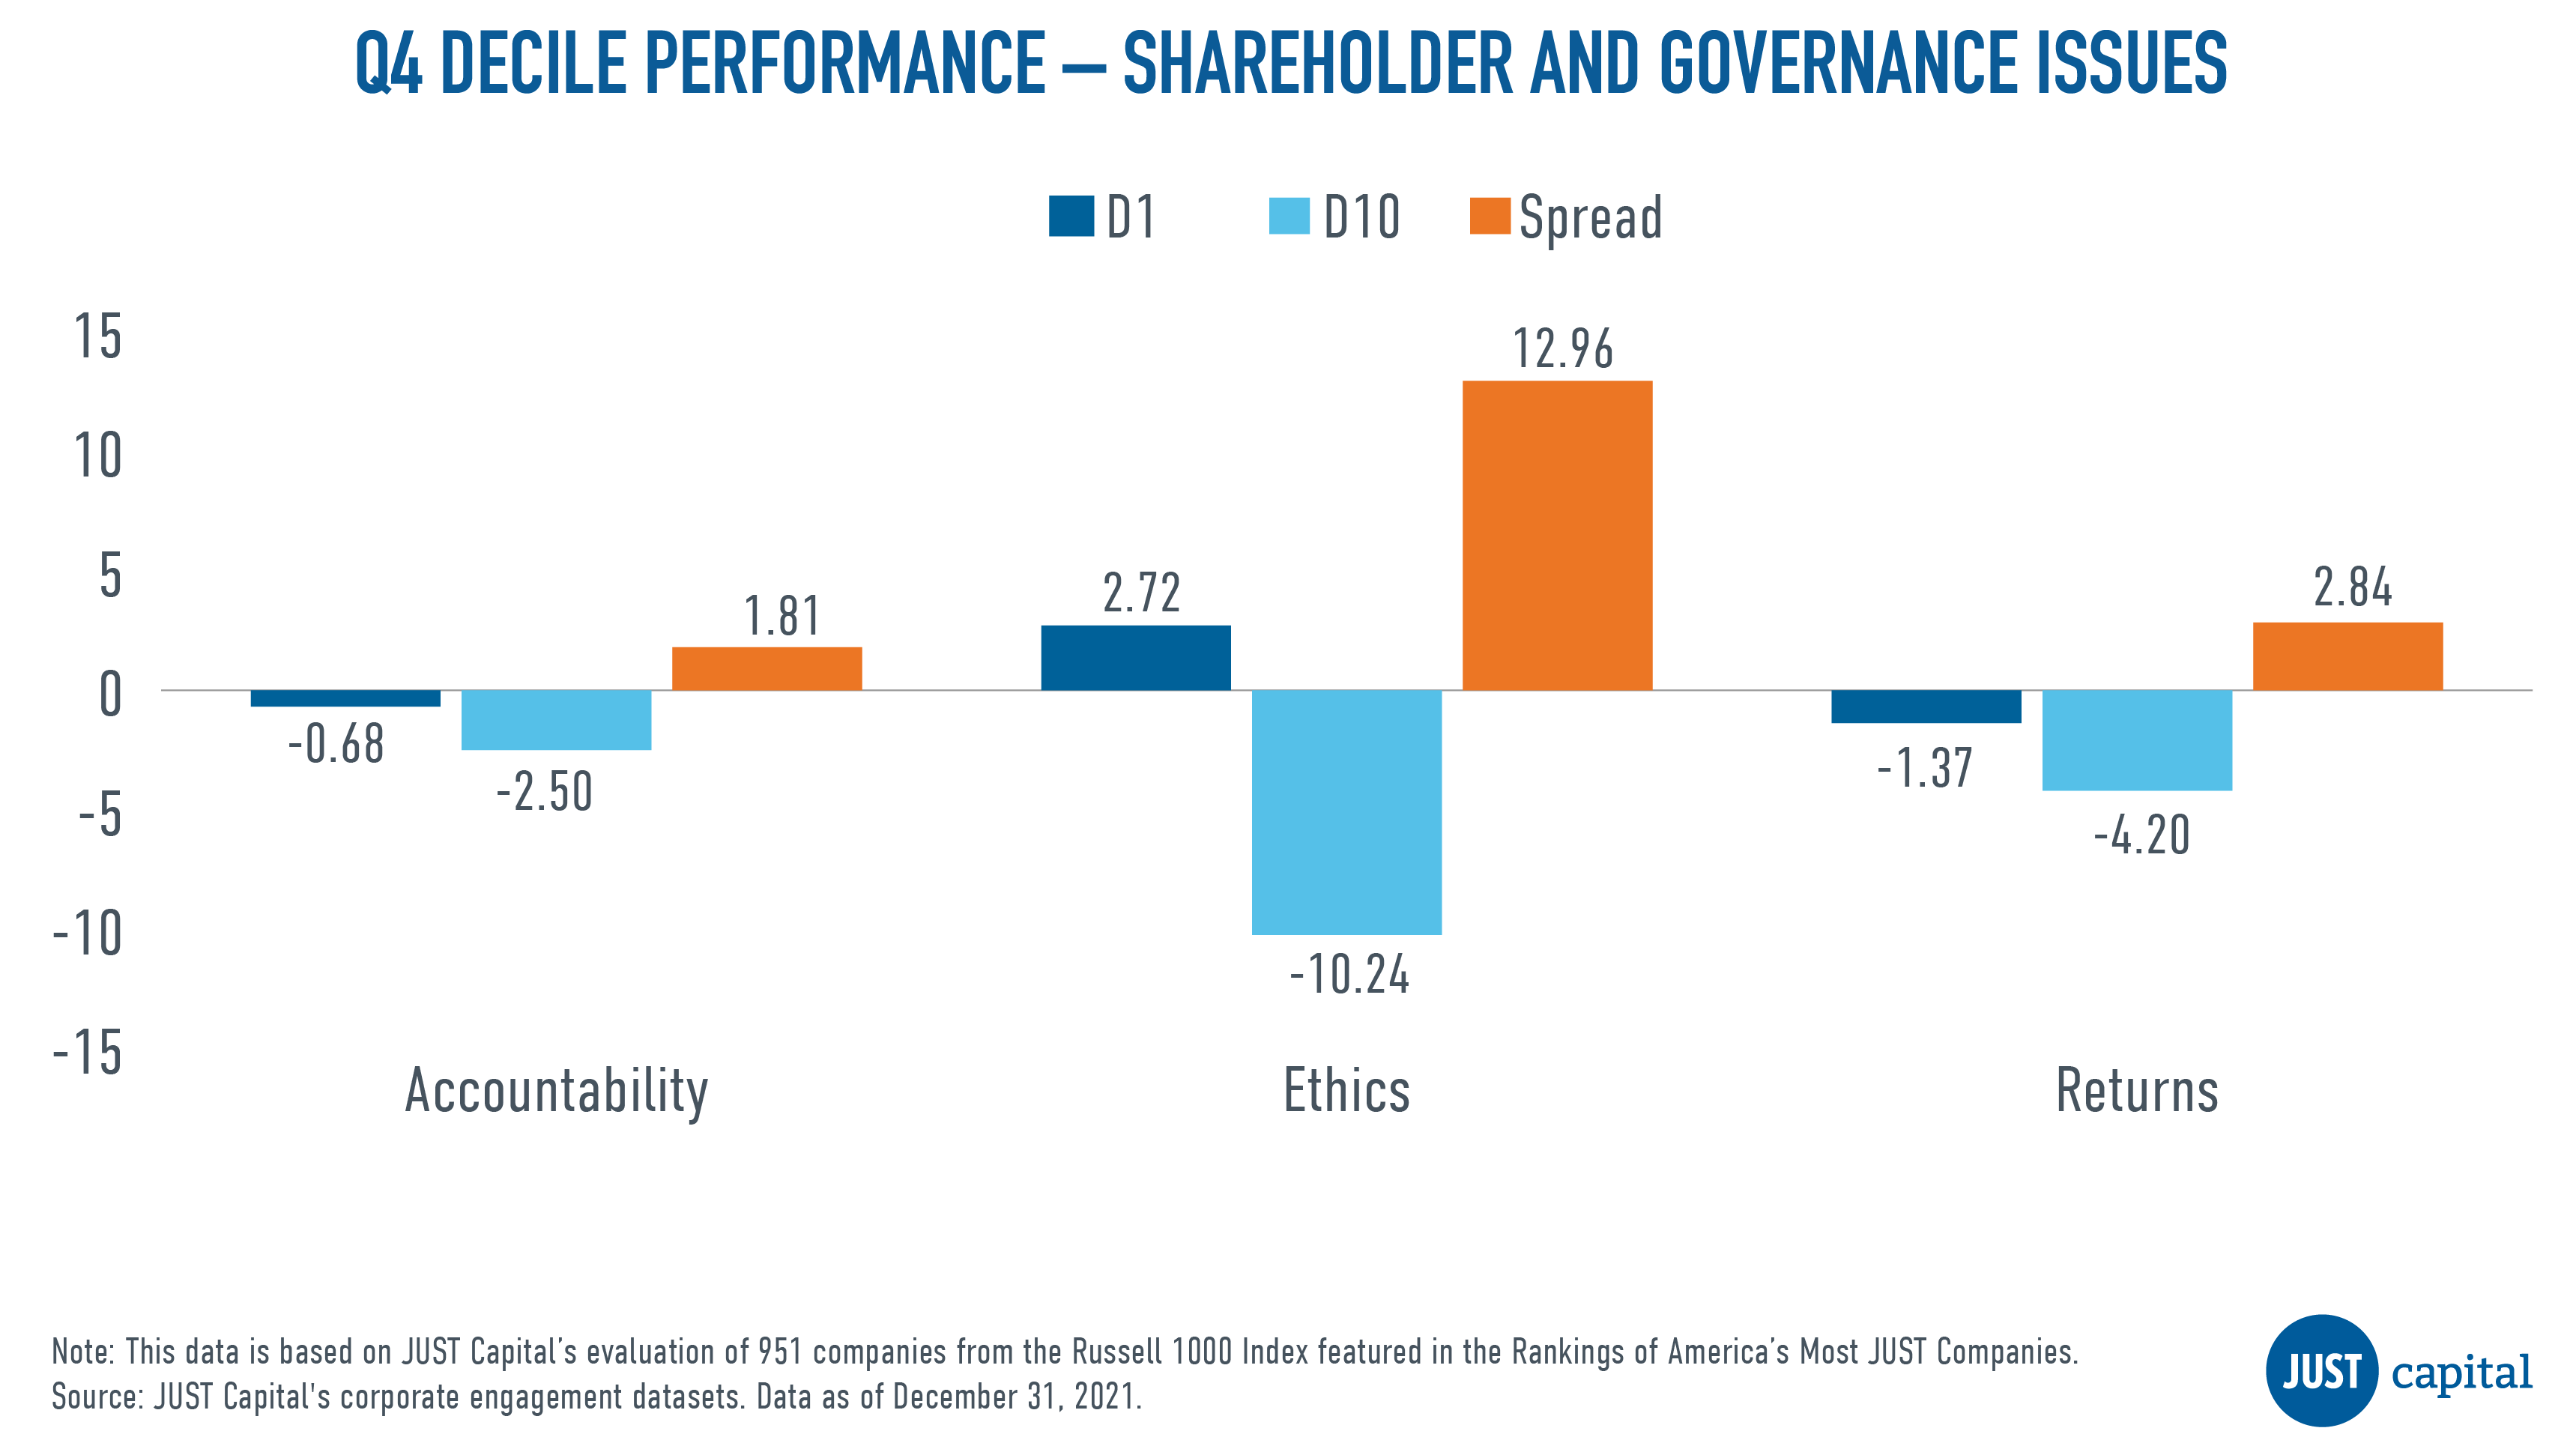
In Q4 we saw all the Shareholder and Governance issues outperform, with Ethics being the leader in performance driven primarily by the underperformance of bottom decile companies.
Shown below are the both top and bottom five contributors to the top decile (D1), the best-ranked companies as measured by their Shareholders and Governance score, and the bottom decile (D10), the worst-ranked companies as measured by their Shareholders and Governance score.
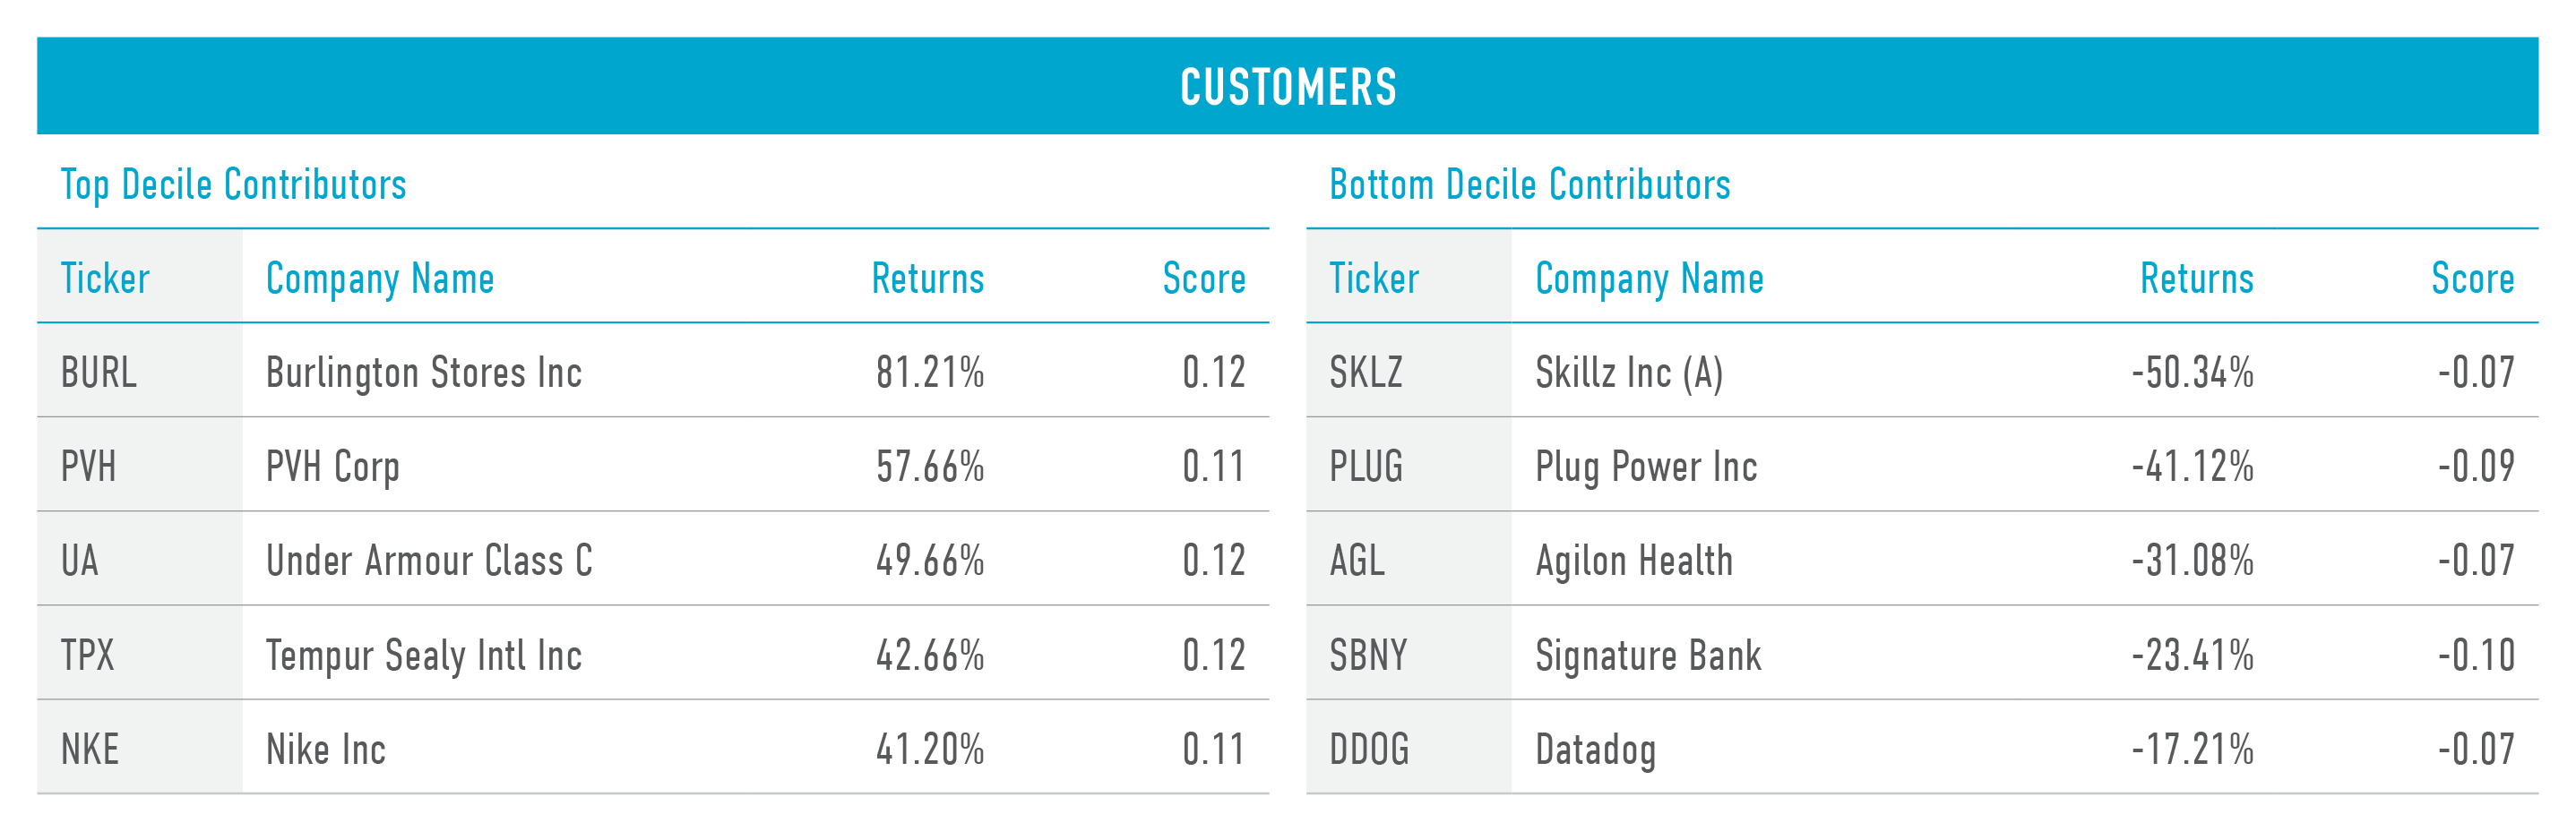
The Customers stakeholder measures a company across four Issues:
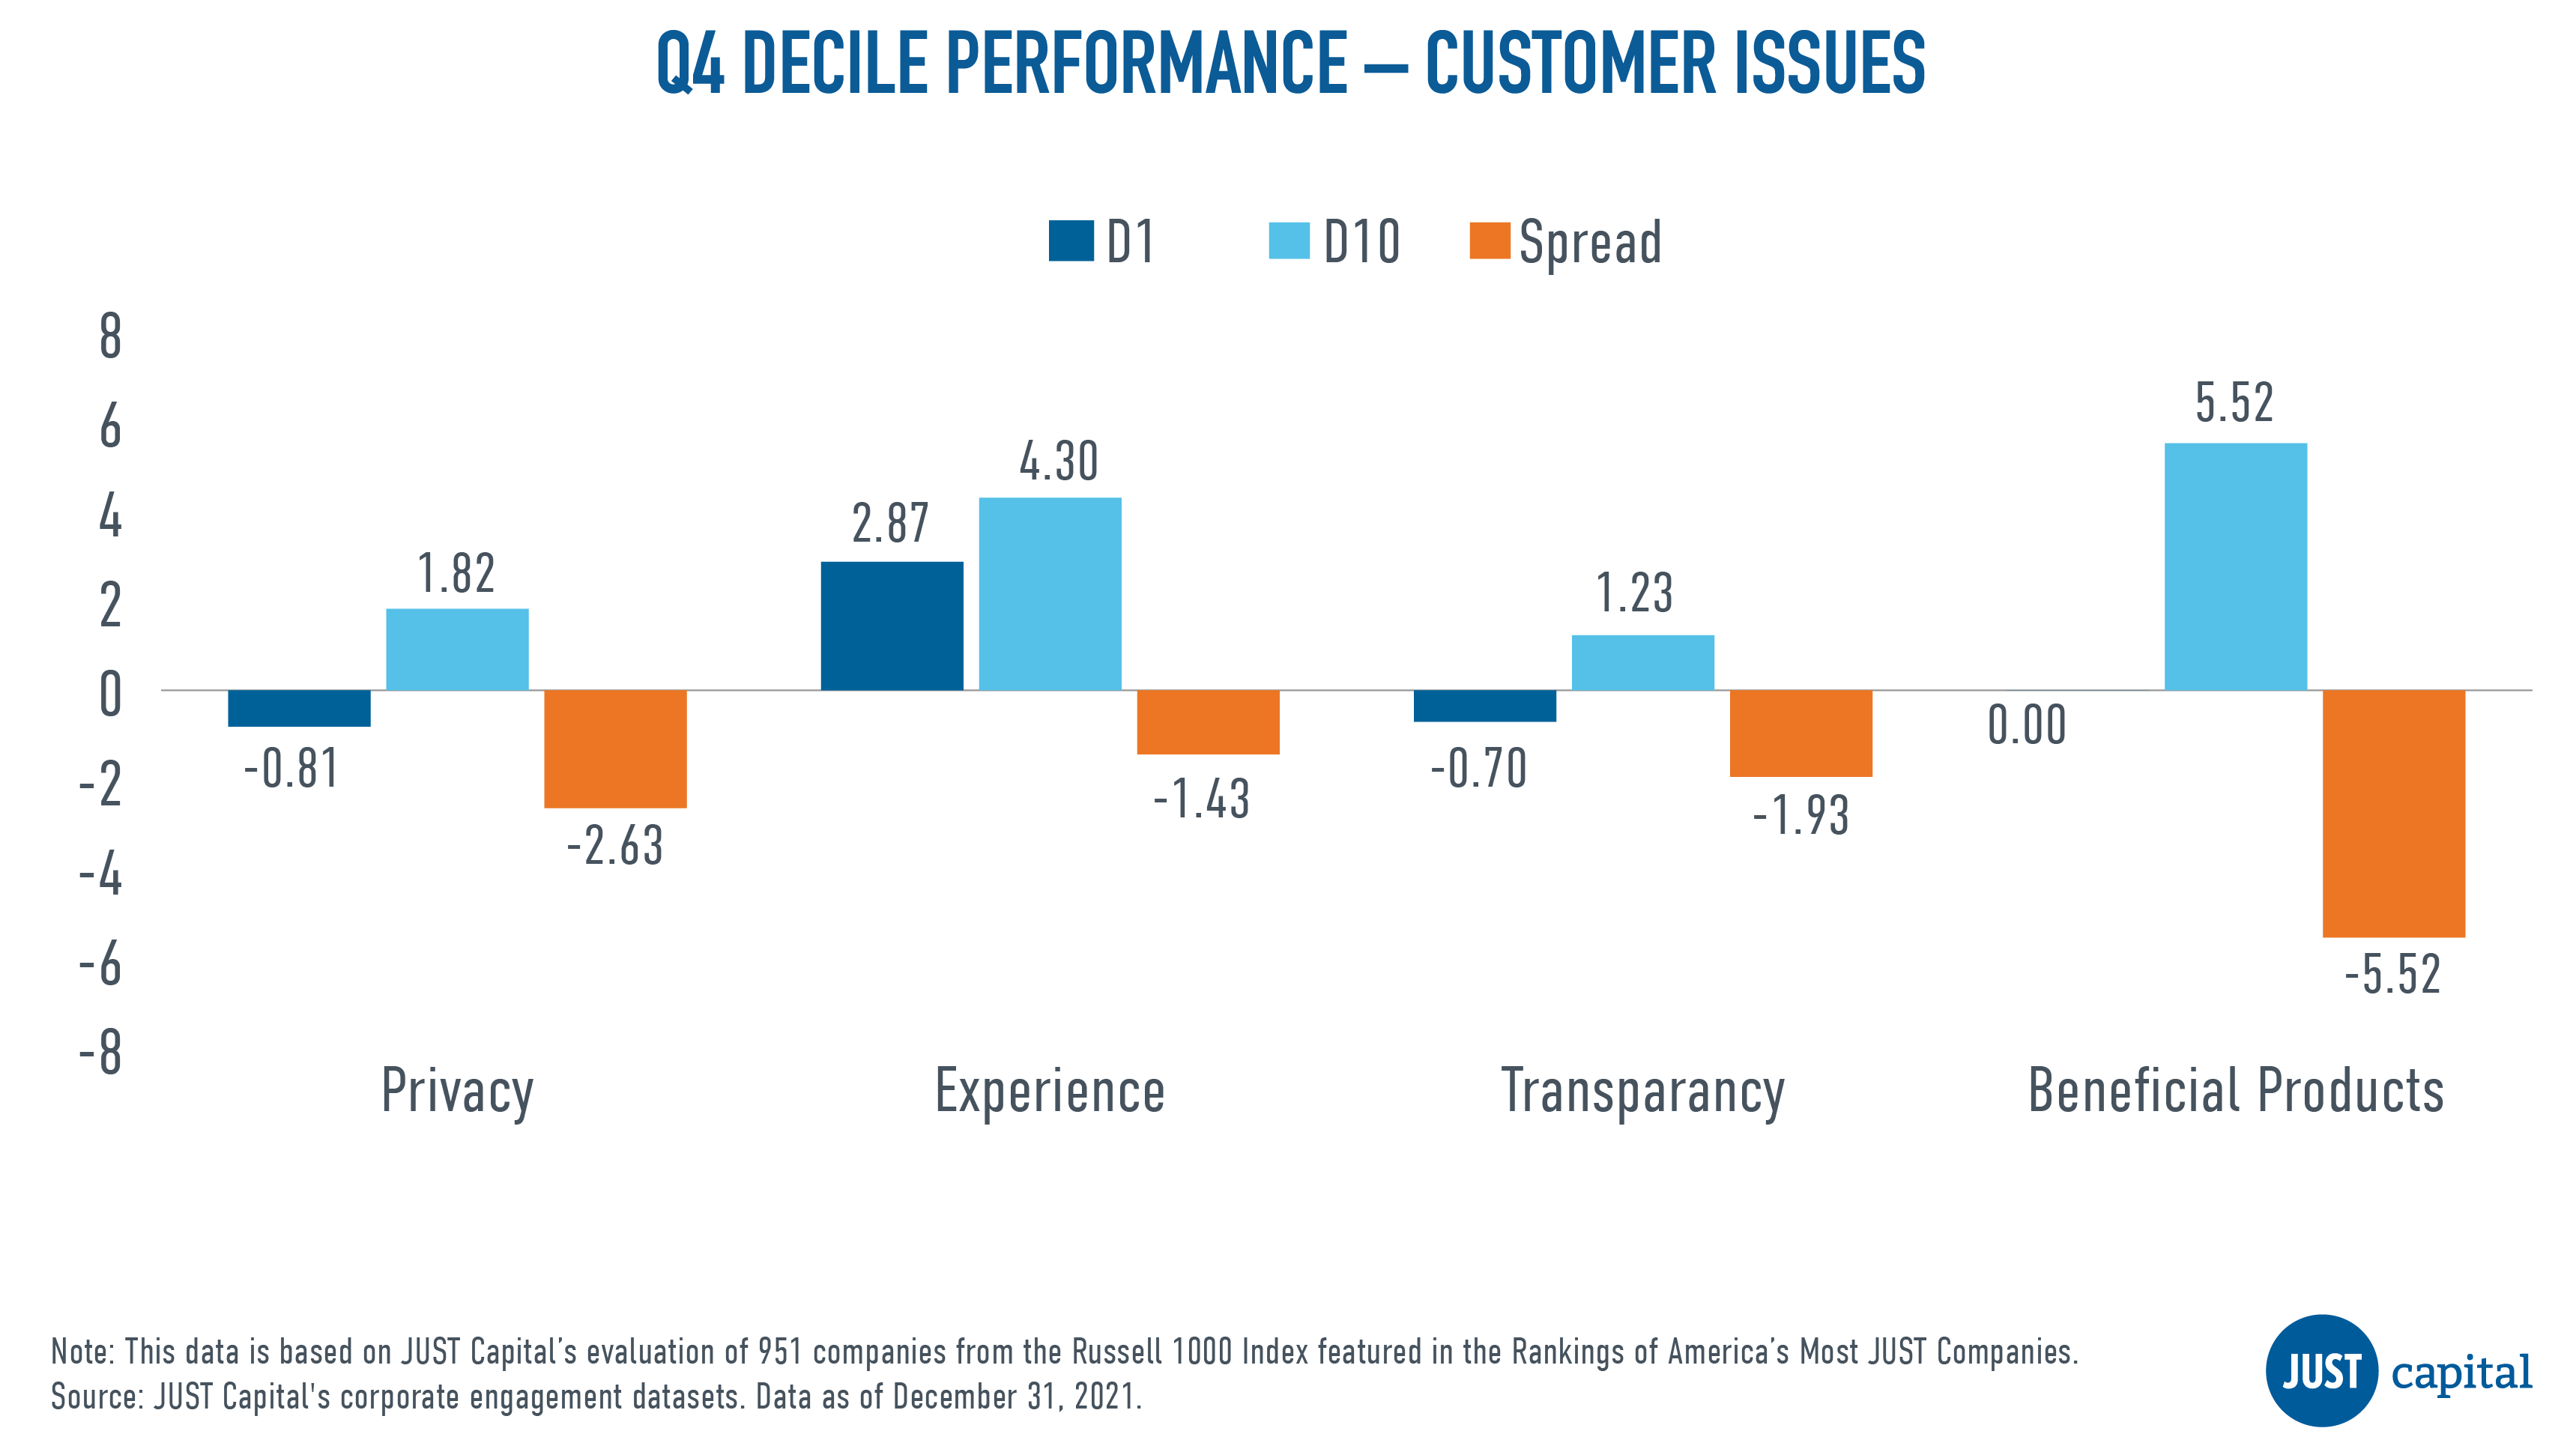
In Q4, we saw all Customer Issues underperform. The Beneficial Products issue was the biggest negative contributor to Customer performance.
Shown below are the both top and bottom five contributors to the top decile (D1), the best-ranked companies as measured by their Customer score, and the bottom decile (D10), the worst-ranked names as measured by Customer score).
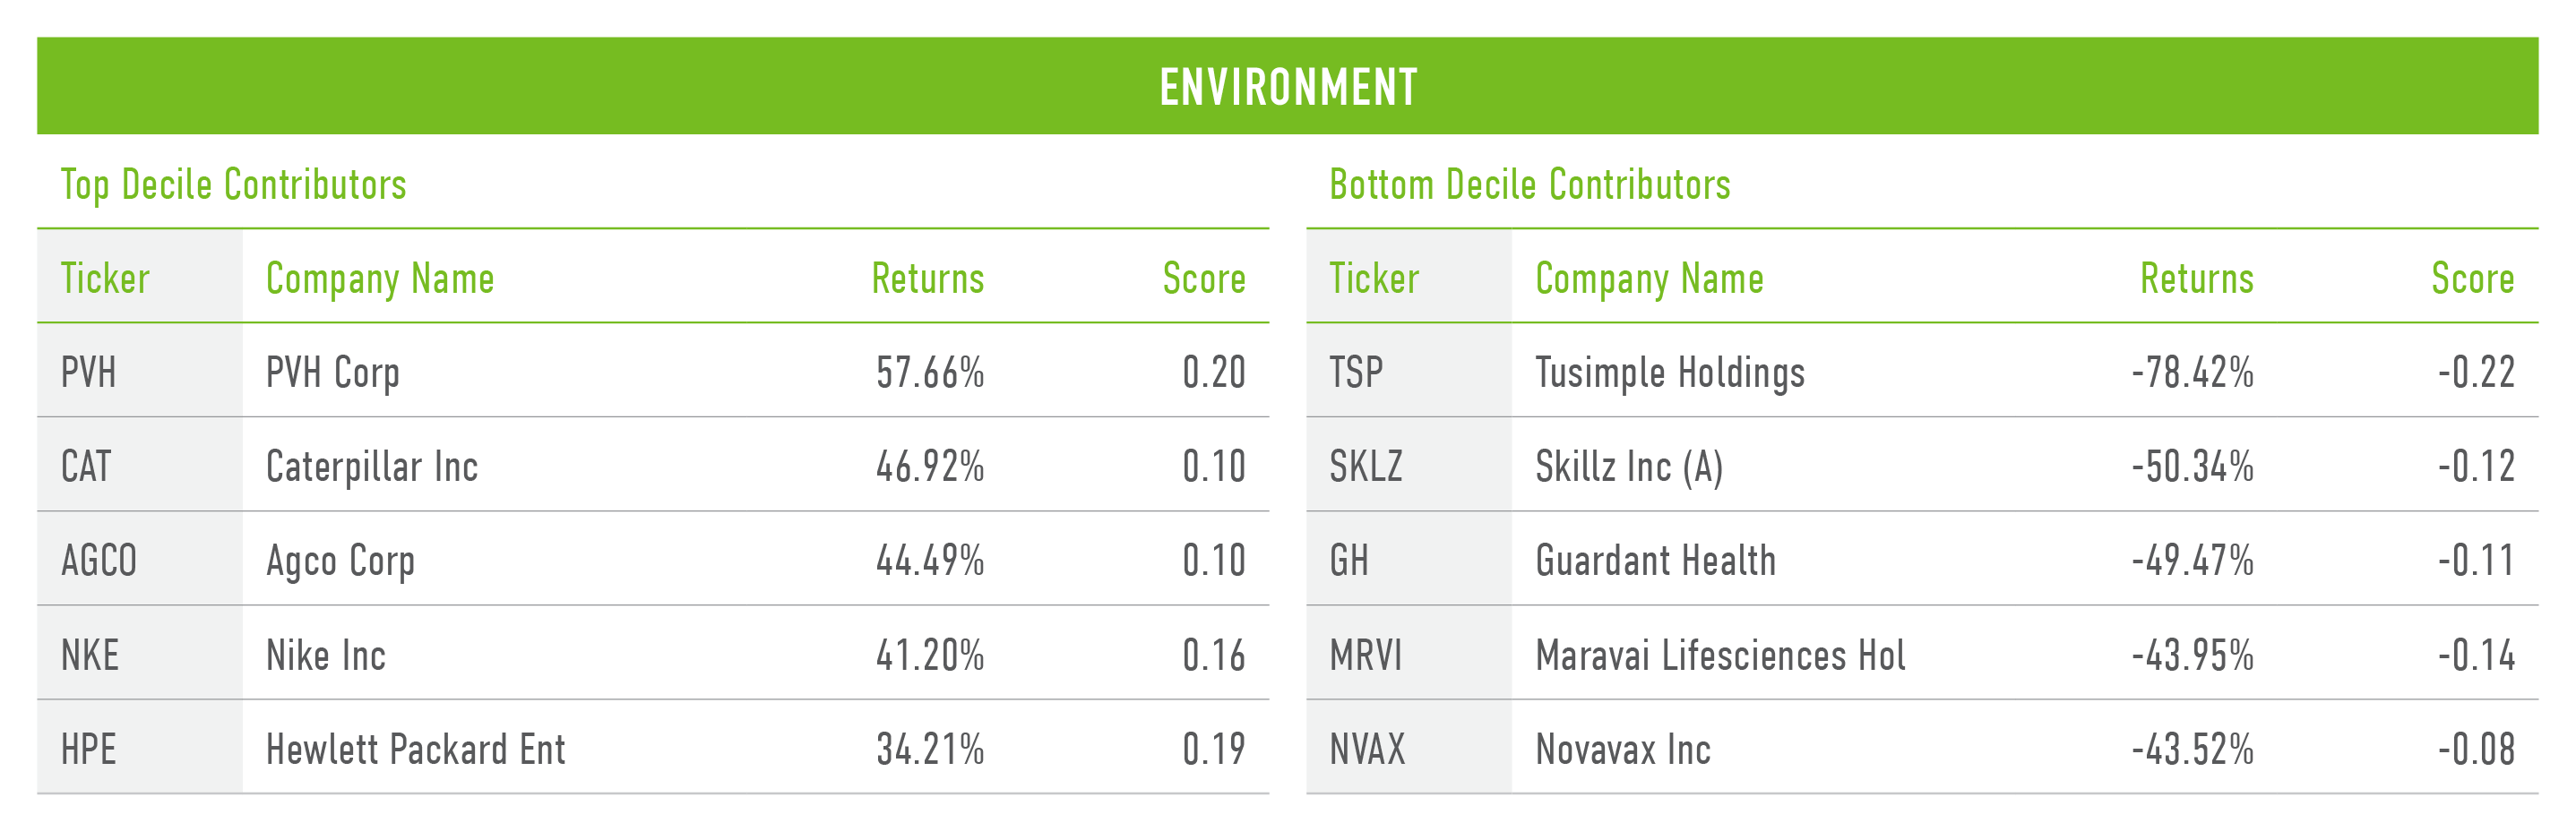
The Environment stakeholder measures a company across four Issues:
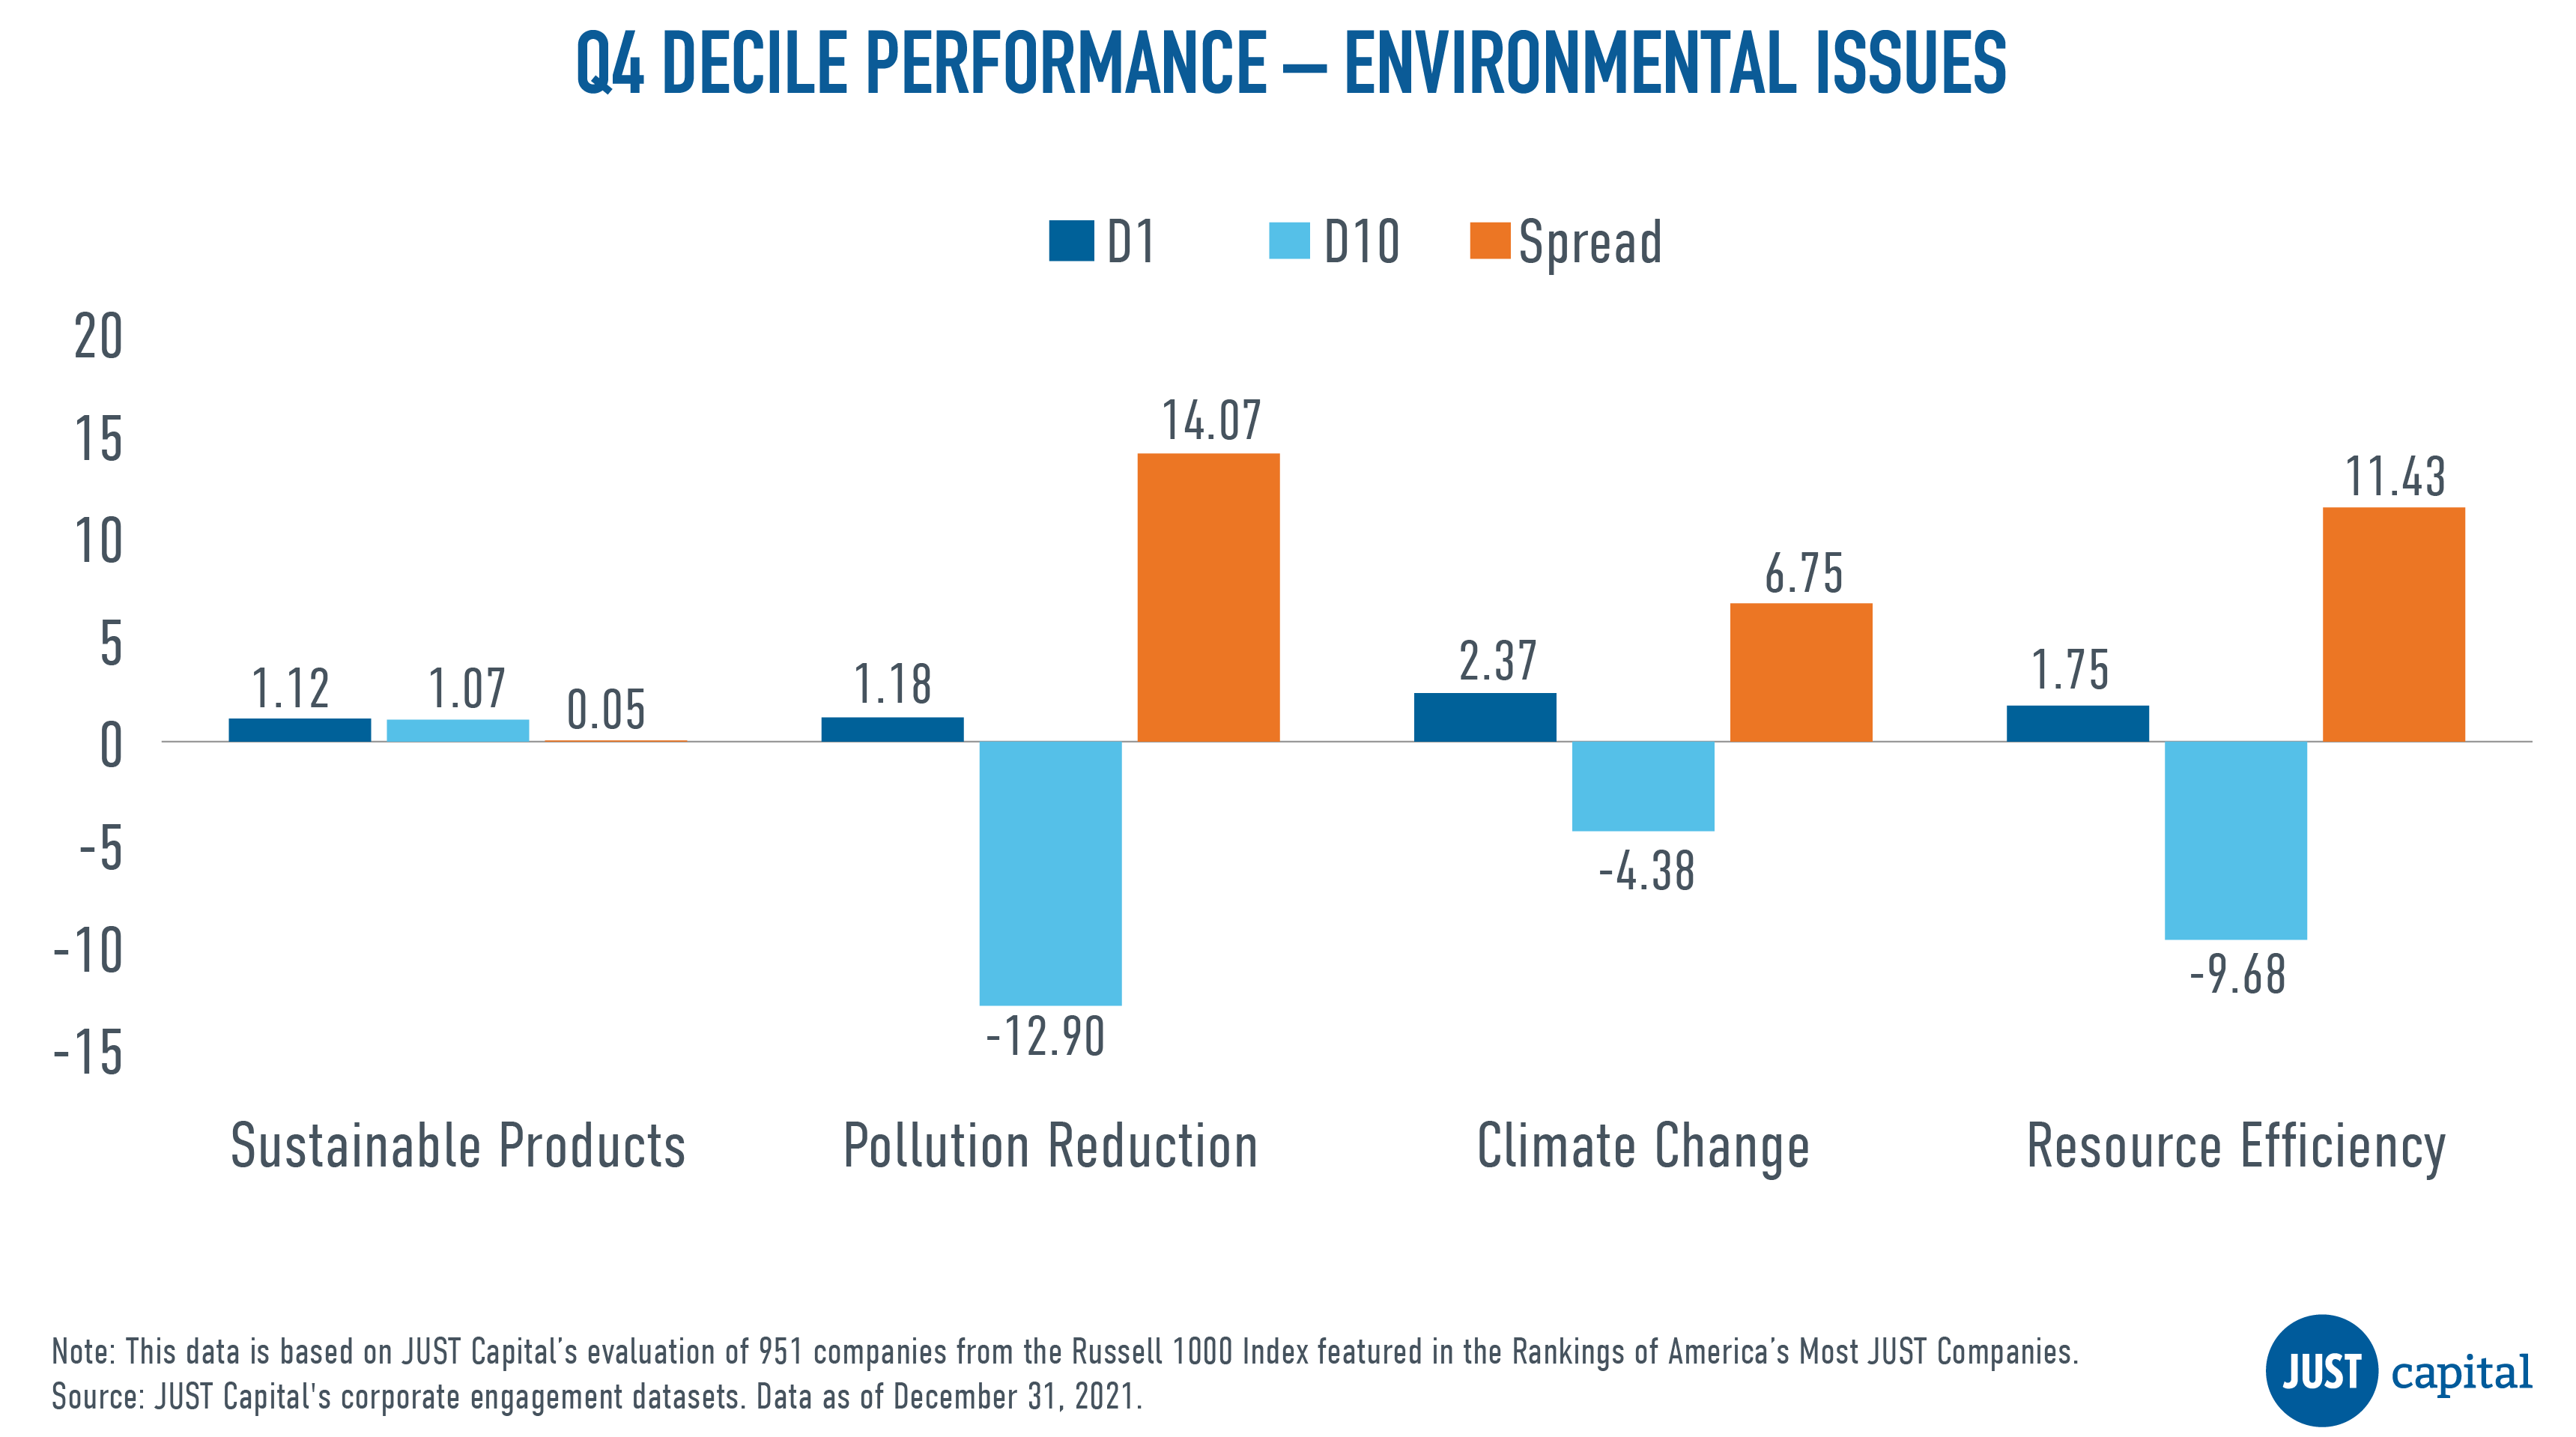
In Q3, we saw all the Environment Issues do well, with the Pollution Reduction Issue being the leader in performance amongst all the Issues in this quarter.
Shown below are the both top and bottom five contributors to the top decile (D1), the best-ranked companies as measured by their Environmental score, and the bottom decile (D10), the worst-ranked companies as measured by their Environmental score.
Computation Methodology
We monitor the performance of these stakeholders and Issues on a long-short basis. The long and short portfolios are selected based on the factor scores as the top and bottom deciles within the universe of companies we track in the Russell 1000. Top decile (D1) companies are those that rank highest based on the factor score, and bottom decile (D10) companies are those that rank lowest based on the factor score.
D1 Performance is computed as:
(Equally weighted average of returns of stocks in D1 bucket) – (Equally weighted average of returns of all stocks within the Universe)
D10 Performance is computed as:
(Equally weighted average of returns of stocks in D10 bucket) – (Equally weighted average of returns of all stocks within the Universe)
Spread is computed as:
D1 Performance – D10 Performance

As the ESG debate heats up among lawmakers, JUST Capital is showing how our data and research prove that “when companies manage their stakeholder relationships well, shareholders also benefit.” That’s how our Managing Director and Head of Investor Strategies, Cambria Allen-Ratzlaff, put it in her opening statement on Thursday in front of the U.S. House Committee on Financial Services Subcommittee on Investor Protection, Entrepreneurship, and Capital Markets.
The topic of the hearing was “E, S, G, and W: Examining Private Sector Disclosure of Workforce Management, Investment, and Diversity Data,” with the question of potential ESG and human capital disclosure standards via the Securities and Exchange Commission (SEC) the focus. Rep. Brad Sherman, D-Calif., led Democrats on the committee calling for a robust set of standards, and Rep. Bill Huizenga, R-Mich., led Republicans arguing that such standards would be SEC overreach.
Representing JUST Capital, Allen-Ratzlaff highlighted the data that shows that it remains quite difficult to capture the human capital metrics that Americans across all demographics, as well as major investors, are calling for, and in her capacity as Co-Chair of the Human Capital Metrics Coalition, she recommended four disclosures that would benefit shareholders. Using JUST’s research, Allen-Ratzlaff avoided the argument over what’s “woke” politicking by regulation rather than votes, and instead pointed to current challenges in gathering the data the public and investors alike are asking for.
Below, you’ll find a recording of the full hearing along with text of Allen-Ratzlaff’s opening statement. At the House subcommittee’s website, you can read and download JUST’s full written testimony, filled with intricate details supporting our position.
Testimony of Cambria Allen-Ratzlaff
Managing Director and Head of Investor Strategies, JUST Capital
Co-Chair, Human Capital Management Coalition
Chairman Sherman, Ranking Member Huizenga, and Members of the Subcommittee:
Good afternoon. My name is Cambria Allen-Ratzlaff, and I am pleased to appear before you today representing JUST Capital where I am Managing Director and Head of Investor Strategies. I also Co-Chair the Human Capital Management Coalition, a group of 37 large investors representing over $8 trillion in assets.
I have brief prepared remarks and respectfully request that the full text of my oral and written statements be entered into the public record.
JUST Capital is an independent, nonprofit research organization dedicated to measuring how America’s largest public companies create competitive value for their shareholders while serving their workers, customers, communities, and the environment. Our view is that when companies manage their stakeholder relationships well, shareholders also benefit.
Every year, we survey the American public to identify the business issues that matter most to them. We then use publicly available data to quantify performance of the Russell 1000 against those priorities. The vast majority of this data is hand-collected by our research team, taking 10,000 to 15,000 hours on average. Once we have reviewed the data and assessed company performance, we build our annual Rankings. We also leverage the data we collect to understand how performance translates into investment returns.
As researchers, our work goes where the voice of the American public takes us.
Since 2015, we’ve engaged more than 160,000 Americans representative of the U.S. adult population. And we have found that Americans are remarkably united in what they want companies to prioritize: workers, wages, and jobs. This holds across every single demographic group.
Paying a fair and living wage is the most important priority across all groups, followed by creating jobs at home. Americans are also primarily concerned about health and safety, and workforce mobility and training. So much so that collectively, worker issues make up 44% of our assessment model.
Our thesis is that companies that are better at managing their stakeholder relationships tend to generate more returns for their investors. We have consistently observed this to be true:
As U.S. public companies are born from, and an integral part of, American society, it is perhaps unsurprising that what is good for workers is good for investors. Our reporting system, however, has been slow to adapt.
Consider this: The only line-item data U.S. public companies are required to disclose on their workforce is headcount. This reporting standard was set in 1973, when over 80% of the S&P 500’s market cap was property, plant, and equipment. Fast forward 50 years to today, and 90% of the S&P 500 is based on intangible assets. It’s human capital – the collective knowledge, skills, and experiences of the workforce – powering economic growth.
But as our financial reporting standards have lagged, this also means that up to 90% of company value may not be reflected in companies’ disclosed financials. And investors have taken note.
Speaking on behalf of the Human Capital Management Coalition, the Coalition has urged financial and accounting standard-setters to improve access to workforce data through a balanced approach, where principles-based disclosures are anchored by four foundational, decision-useful disclosures that apply to all companies. They are: (1) the number of full time, part-time and contingent or contracted labor directly involved in firm operations; (2) labor costs; (3) turnover; and (4) workforce diversity data sufficient to understand the company’s efforts to access and develop new sources of talent, as well as how effective these efforts are.
Without this information, investors are flying blind, unable to understand how well a company manages its workforce, and how it impacts a company’s overall business, risks and prospects, to most efficiently direct their financial capital to its highest-value use.
Today, even attempting to get this information is excessively time-consuming. When JUST Capital assessed workforce disclosure at the 100 largest U.S. employers, it took a team of two skilled data scientists over 130 hours to collect data on a discreet number of human capital metrics – or find the data completely unavailable.
If a sophisticated research organization like JUST Capital, or large, global institutions with billions of dollars in capital are unable to access decision-useful, comparable, consistent, and reliable workforce data, small retail investors are at even more of a disadvantage. And, according to JUST Capital’s polling, 85% of Americans across political affiliations agree that companies should disclose more about their business practices and impact on society.
Companies meeting the needs and expectations of the American public have proven them to be value-relevant through their performance. Simply put, companies that are best at harnessing the awesome power of their workforces are also best-positioned to generate long-term value for shareholders.
Thank you, and I look forward to your questions.