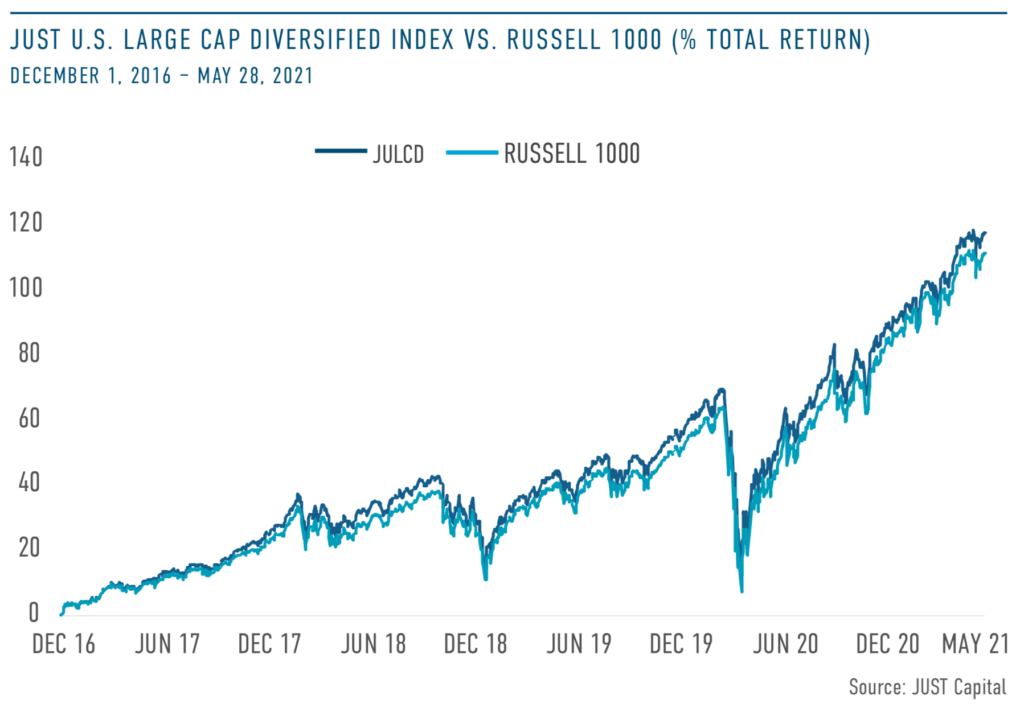
This week’s chart is timely as the Goldman Sachs JUST U.S. Large Cap Equity ETF (JUST ETF) recently hit its three-year anniversary on June 13, 2021. The fund, which began trading on the NYSE Arca in 2018, seeks to track the JUST U.S. Large Cap Diversified Index (JULCD), constructed and managed by JUST Capital and composed of the top 50% of Russell 1000 companies in each industry, based on JUST Capital’s annual Rankings.
Looking at the JULCD Index that the ETF seeks to track, we see it has outperformed the Russell 1000 cumulatively by 6.17% since inception in the 4.5 year period ending in May (Dec. 1, 2016 to May 28, 2021). Additionally, over the past year, the tracking error of the JULCD index relative to the Russell 1000 is 1.54. This indicates the benchmark is closely tracking the returns of the Russell 1000 to provide market beta, but sees additional alpha on a cumulative basis from JUST Capital’s Annual Rankings and methodology.
Given the JUST ETF anniversary and the past year’s surge of flows to ESG funds, we wanted to resurface a speech that JUST Capital’s Co-Founder and Chairman, Paul Tudor Jones, gave at the 2019 Inside ETFs conference. In his keynote, Jones highlights that the companies working to build a more just and equitable economy are also those that continue to deliver lasting value to shareholders. You can watch the full talk below:
Furthermore, companies in the JULCD are driving positive change on the issues our polling shows the American public expects a response to,including worker pay and well-being, customer treatment and privacy, environmental impact, job creation, and investing in communities.Compared to Russell 1000 companies excluded from the Index, 2021 JULCD constituent companies on average:
As the JUST ETF continues into its fourth year, we have seen the fund reach $238 million in assets under management (AUM), be named the Best New ESG ETF and a finalist for ETF of the year from ETF.com, and receive a Morningstar Analyst Rating of Bronze in December 2020.
The Investor Solutions team at JUST Capital continues to expand the suite of products tracking our in-depth company research and polling of the American public. We firmly believe that together we can create a more just and equitable marketplace that works for all Americans. Please reach out using the link below if you have an interest in partnering with us to launch the next stakeholder-driven strategy.
If you are interested in supporting our mission, we are happy to discuss data needs, index licensing, and other ways we can partner, please fill out our request form to answer a few questions, and someone from our Investor Solutions team will reach out to you within two business days.
As a follow-up to our recent Memorial Day chart, which analyzed companies with veteran hiring policies, we revisit corporate diversity and inclusion practices this week to evaluate if there is additional value in sourcing business from veteran-owned suppliers.
As the global economy begins to emerge from the COVID-19 pandemic, U.S. manufacturers have seen unprecedented product demand with global supply chain shortages continuing to exhaust the manufacturing sector. Given the heightened consumer demand and the supply chain risk of correlated suppliers failing to hit their production targets, there is a need for many companies to have a diverse set of suppliers. As part of a company’s supplier diversity programs, veteran supplier policies, in particular, provide equitable opportunity for direct and indirect suppliers owned by veterans.
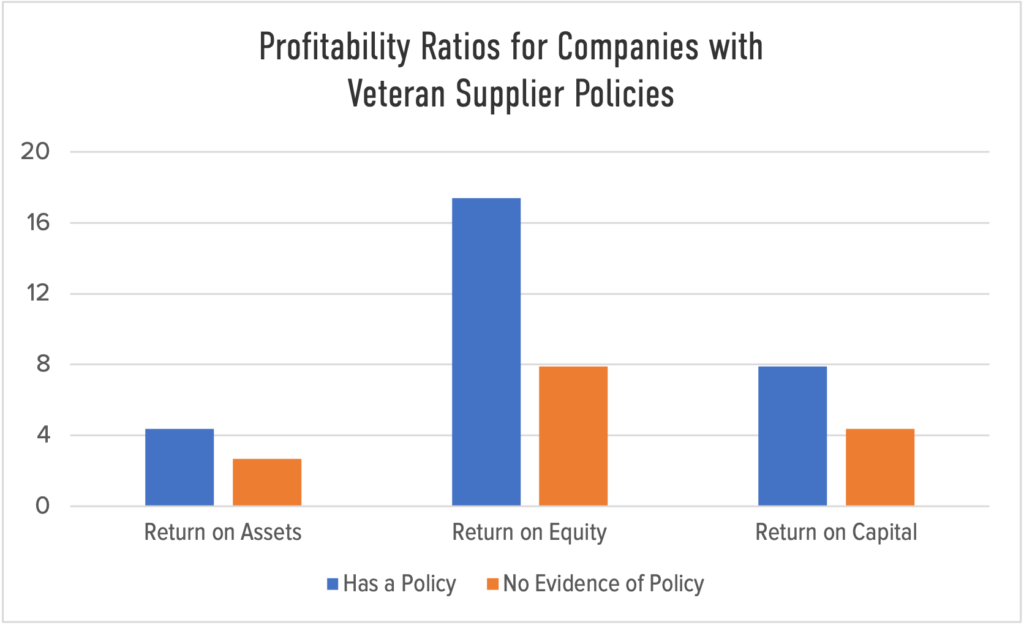
Looking at the 928 companies we ranked in 2021, we find there are 309 that provide veteran supplier policies. Digging into the data around various profitability ratios, we see higher return on assets, return on equity, and return on capital across the board for companies with these policies in place.
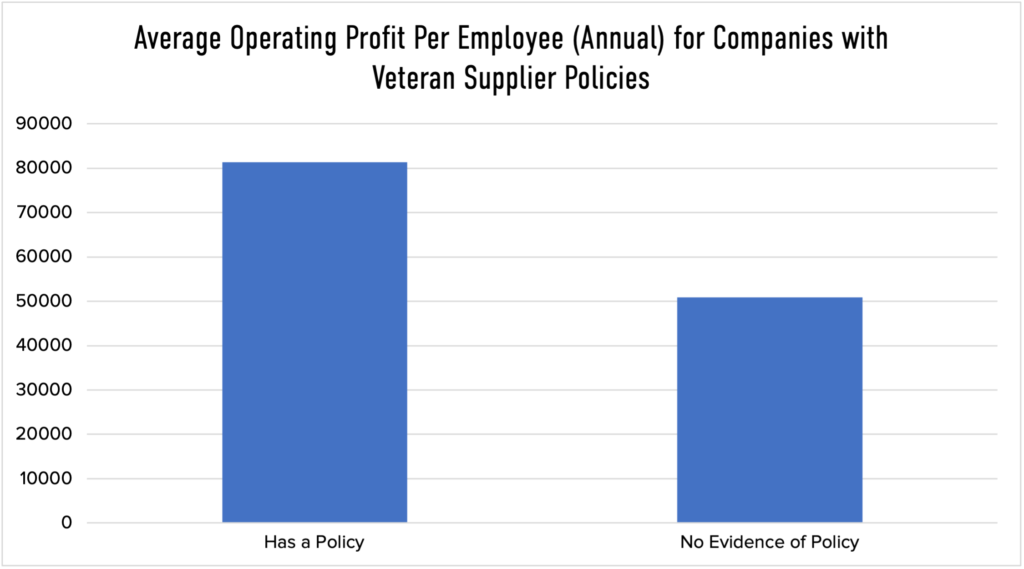
And looking at average operating profit per employee, we see a roughly 60% annual increase across companies with a veteran supplier policy or program in place:
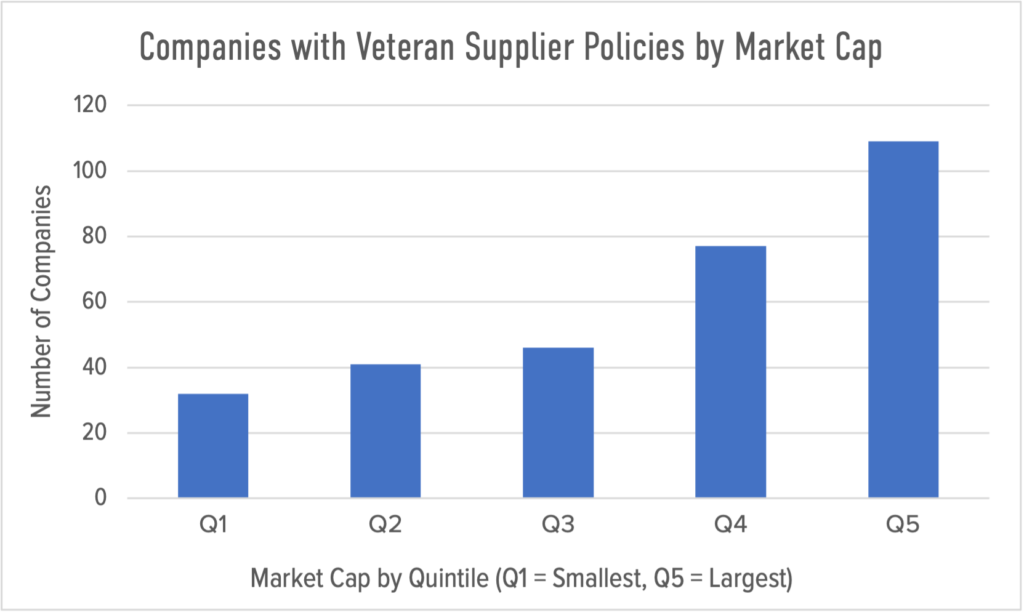
Finally, our analysis breaks out the companies with veteran supplier policies to show that the larger the market-cap of a company, the likelier it is to have a program in place.
Bank of America is our top-rated company for community development – the issue that tracks whether companies institute veteran supplier policies – and it not not only provides such a policy but offers resources to other companies looking to do so. Ranking #12 in the JUST 100, Bank of America spends nearly $2 billion every year with diverse businesses and has a number of resources on its website for smaller companies to get started on building their own diverse supply chain.
Bank of America’s approach to veteran suppliers and community development overall is an example of how taking a stakeholder lens to business can allow for finding opportunities for long-term value creation across every aspect of the company.
If you are interested in supporting our mission, we are happy to discuss data needs, index licensing, and other ways we can partner, please fill out our request form to answer a few questions, and someone from our Investor Solutions team will reach out to you within business days.
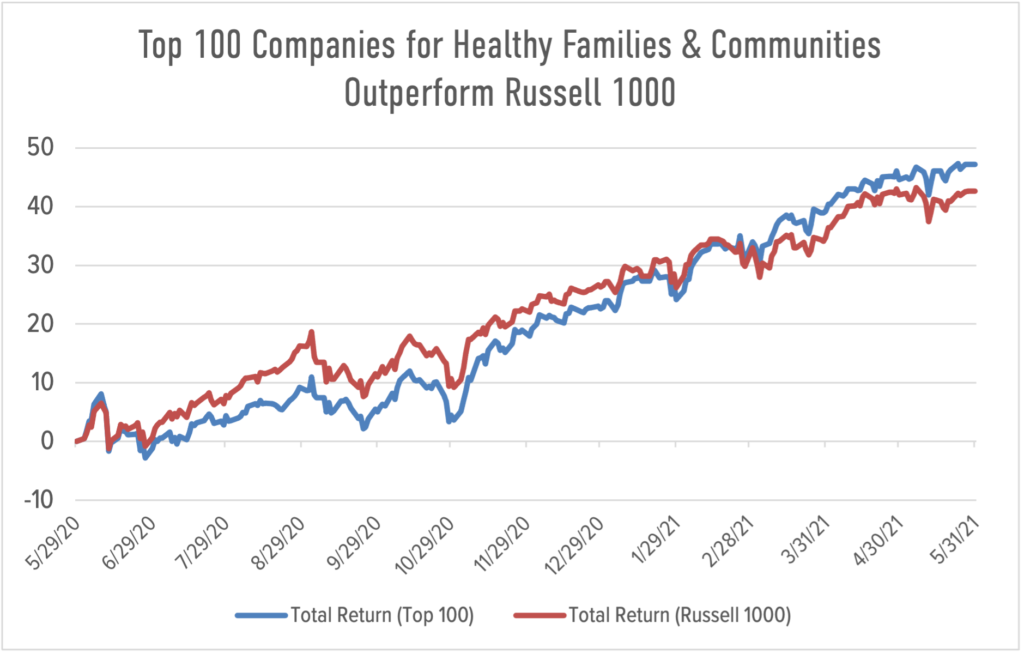
This week’s chart serves as a complement to our list of the Top 100 U.S. Companies Supporting Healthy Families & Communities published this week. Here, we examine the trailing one-year returns of the 100 leading companies from the list, relative the Russell 1000 companies we rank.
JUST Capital’s research team, with support from the Robert Wood Johnson Foundation, identified 10 key issues that determine whether companies are supporting the health and well-being of workers, their families, and the communities in which they operate.
The methodology utilized in the calculation of our 2021 list considers whether a company scores highly on the following 10 issues:
Over the time period of 6/1/2020 through 5/31/2021, the Top 100 Companies Supporting Healthy Families and Communities have outperformed the Russell 1000 Index by 4.6%. Top sector contributors were Financials, Consumer Discretionary, and Real Estate.
Top-ranked companies include NVIDIA, which offers unlimited paid sick leave, back-up dependent care, subsidized child care, and equitable paid parental leave for primary caregivers, secondary caregivers, and adoptive parents. Also included in the list are JPMorgan Chase, which is one of the few Russell 1000 companies to disclose non-white-to-white pay ratios.
Explore the rest of the list here to find out which companies continue to prioritize their stakeholders while outperforming their peers, and learn more about the list from JUST’s Chief Strategy Officer Alison Omens, who spoke on CNBC’s Closing Bell about why it’s so important for companies to focus on the health, safety, and well-being of their workers and communities.
If you are interested in supporting our mission, we are happy to discuss data needs, index licensing, and other ways we can partner, please fill out our request form to answer a few questions, and someone from our Investor Solutions team will reach out to you within two business days.
In this week’s chart, we take a closer look at corporate disclosure on human rights policies. In our 2021 Rankings, the second most important priority for corporate America – according to the American public – is to uphold human rights standards across the supply chain, and accounts for 9.2% of a company’s score. Americans want to see companies be transparent about their efforts to address child labor, forced labor, and other abuses of people in their supply chains, and require suppliers to uphold basic human rights standards.
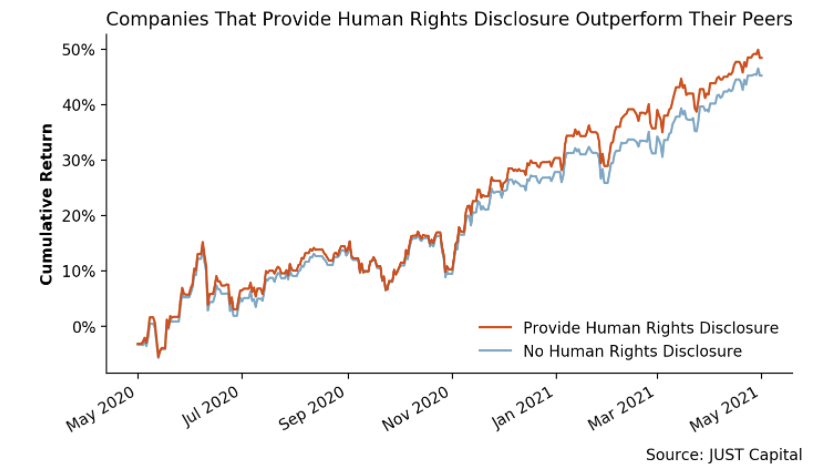
Our analysis looks at one of the data points we use to measure a company’s performance on human rights issues – whether its Supplier Code of Conduct or Human Rights policy, as it pertains to suppliers, explicitly mentions human rights. Of the 928 companies we ranked in 2021, 458 provide this human rights disclosure and outperform those that do not by 3.2% over the trailing year.
Human rights violations within a company’s supply chain were thrust into the spotlight after the 2013 Dhaka garment factory collapse in Bangladesh, prompting organizations and governments to call for a heightened level of supplier due diligence. The World Benchmarking Alliance puts together an annual Corporate Human Rights Benchmark Report, which aims to shine a light on human rights policies by evaluating how 230 public companies across five high-risk sectors track and manage risks related to forced labor, child labor, and freedom of association and collective bargaining within their supply chains. Looking at the automotive sector, they found a “majority of automotive companies failed to demonstrate that they work with suppliers or set core expectations through contractual arrangements to verify the age of workers, prohibit recruitment fees and prevent intimidation or harassment of trade union members and their representatives.” Only one company, General Motors (#28 overall in our 2021 Rankings), provided evidence of mapping its direct and indirect suppliers.
As evidenced in our chart above, it is clear that there is a correlation between financial outperformance and the implementation of human rights supplier policies, further building the case for companies to prioritize supply chain practices. With fewer than 10 years to achieve the 17 sustainable development goals put together by the UN, corporate leaders can start by implementing a human rights supplier policy in order to begin understanding the risks in their supply chains. In turn, this will set the steps in motion to identify, address, prevent, and report publicly on human rights risks, leading to further transparency and more just business practices.
If you are interested in supporting our mission, we are happy to discuss data needs, index licensing, and other ways we can partner, please fill out our request form to answer a few questions and someone from our Investor Solutions team will reach out to you within business days.
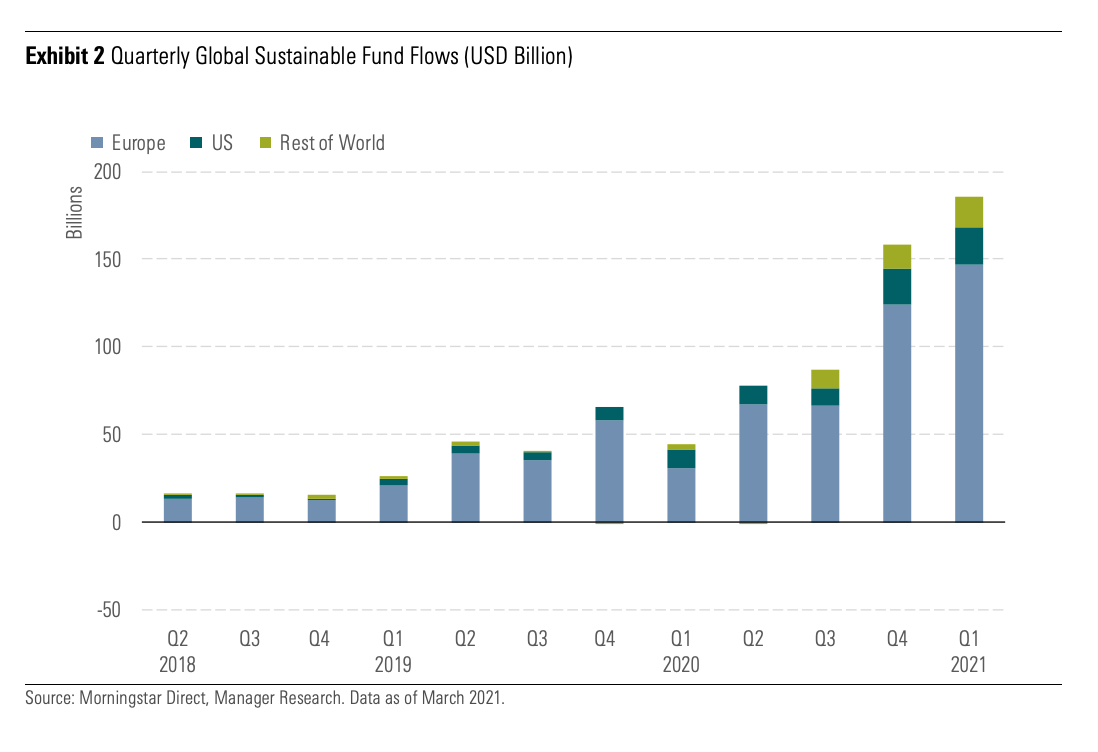
This week, we are highlighting an external report published recently by Morningstar, showcasing the continued record-setting growth of sustainable asset flows.
Looking at the chart below, we see the global inflows in Q1 2021 to sustainability-focused open-end and ETF products accumulating $185.3 billion in assets. This marks a 406% increase over the $45.6 billion pulled in by ESG strategies just one year earlier in Q1 2020.
What’s notable is that Europe continues to dominate in terms of assets, accounting for roughly 82% of global assets under management in the sustainable fund space per Morningstar’s classification, while the U.S. sits at 13.4% of assets.
The market continues to see record-setting performance from strong earnings reports in 2021, a large-scale shift in investor preference from growth to value, and COVID-19 vaccine distribution progress. Despite the change in investment regimes, the JUST US Large Cap Diversified Index (JULCD) has continued to deliver outperformance by 72bps YTD as of 5/12/2021 over the Russell 1000. This trend proves the JULCD is a “portfolio for all seasons” as just companies focused on the long-term continue to show market resilience. From the chart above and the JULCD’s continued outperformance, it’s clear that investor demand for sustainability and stakeholder capitalism shows no signs of slowing.
For questions on ESG data, JUST Capital’s ESG indices, or thought leadership, please reach out to our Director of Business Development, Charlie Mahoney, at cmahoney@justcapital.com
This week’s chart looks holistically at the broader trends in sustainable finance to evaluate the ESG fixed income space. Our commentary pulls two charts from the S&P Global’s market overview published last week, Environmental, Social, And Governance: How Sustainability-Linked Debt Has Become A New Asset Class.
Before diving into this analysis, it’s important to understand the current state and growing trends in the sustainable debt market. Over the past five years, ESG debt issuance has gone from the niche market of government-issued bonds, used to finance local renewable energy projects, to a $732 billion dollar industry1. Per BloombergNEF, sustainable bond issuance grew 29% in 2020 from 2019, driven by a sevenfold increase in social bond issuance of $147.7 billion for social projects amid fallout from the pandemic. This growth is continuing at a pace in 2021 set to surpass last year’s record.
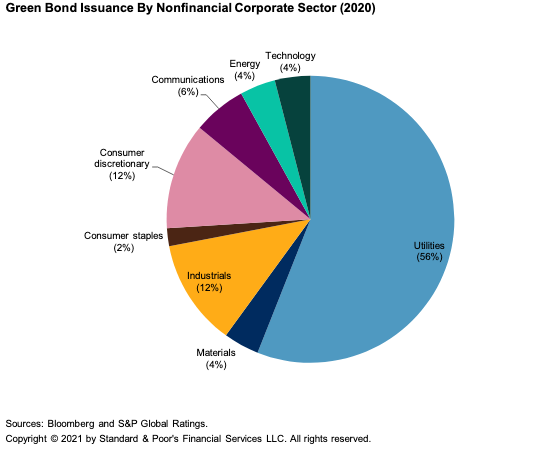
Organizations are continuing to iterate the types of bonds they’re issuing to drive sustainability forward. But one type of issuance, green bonds, captures the majority of the sustainable debt market with $305 billion issued globally during 2020. A green bond is a fixed-income instrument issued by companies with the explicit purpose of financing environmental or climate-focused expenditures. This can include financing for expansion of the subway system, like the New York MTA did, or even the sovereign expenditures, including the green bonds Italy recently issued that received over 80 billion in orders for 8.5 billion euros in debt to finance sovereign expenditures related to low-carbon transport, power generation, and biodiversity.
Green bonds continue to raise record levels of financing, but are largely limited to companies that have various capital expenditures connected to environmental projects or initiatives and fall into the utilities sector. As the chart below shows, these companies issued bonds raising 56% of the total green bond dollars invested in 2020. However, a newer form of raising capital, the sustainability-linked bond, opens up the possibility for companies at the beginning of their sustainability journeys or that fall into “hard-to-abate” (meaning most challenging to decarbonize) sectors to raise debt in a similar fashion while advancing their own ESG initiatives.
A sustainability-linked bond (SLB) is a new form of green financing in which companies issue a debt instrument with the intent of raising financing tied to achieving a predefined KPI (key performance indicator) or set of KPIs over the duration of the bond maturity. What is unique, however, about SLBs is that they open up the sustainable debt field to all companies, regardless of sector or resources and can be used for general purpose – not explicitly for environmental expenditures.
For example, if an issuer is looking to raise debt to achieve a large-scale reduction in carbon emissions, they can issue an SLB linked to a predetermined KPI over the maturity of the bond at a discounted coupon rate (or cost) that will ratchet up or down depending on whether or not they have reached the set target. This enables an issuer to achieve a cheaper cost of debt or “greenium” from investors in exchange for following through on the KPI targets. We’re also seeing companies use the sustainability-linked KPI framework around broader ESG commitments – not just environmental targets. Earlier this year, the Carlyle Group linked a $4.6 billion credit facility to KPIs to increasing board diversity.
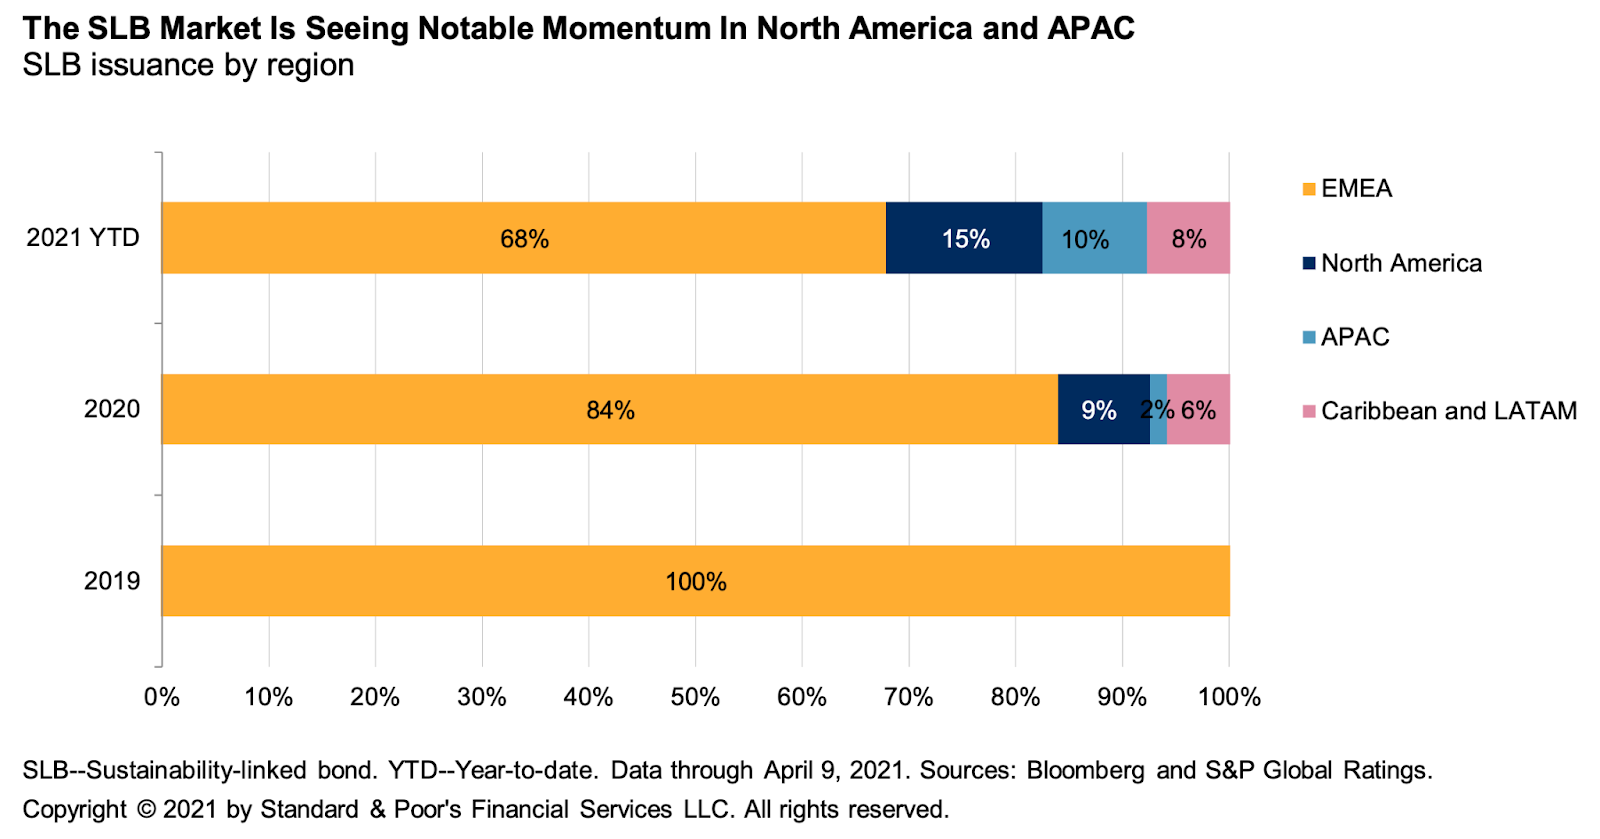
Looking to the charts from S&P below, we see a steady rise occurring in the SLB market over the past 2.5 years with North America moving from 0% of the global market to 15% so far in 2021. “2021 will be the year of sustainability-linked bonds.” Marilyn Ceci, global head of ESG debt capital markets at JPMorgan, said in a recent Bloomberg article. “It’s going to be the fastest-growing sustainable instrument that we have if we extrapolate what we’ve seen already.”
SLBs remain a nascent asset class, but are rising significantly with 13 launched YTD in 2021. As issuers continue to iterate, SLBs represent a win-win opportunity. The ability to leverage SLB financing not just for environmental and governance initiatives, but for social initiatives is a unique and important way for organizations to quantify and transparently progress upon their commitments to social issues.
The opportunity to tie goals and KPIs to debt in a meaningful way empowers organizations to follow through on their commitments to diversity, equity, and inclusion (DEI), workforce financial health, and more. As JUST Capital tracks how they’re taking action against DEI commitments in our Corporate Racial Equity Tracker, SLBs present a massive opportunity for companies to tie their targets to debt financing to achieve a lower cost of capital and publicly follow through on their pledges.
Ultimately, with all of the talk of greenwashing and only 29% of the 444 companies in the S&P 500 in 2020 hiring external assurance to verify their CSR reports, SLBs are a differentiated way to prove organizational commitment in a quantifiable way while being incentivized by investors to do so. The social metrics we track – board diversity, workforce demographics, and pay equity among others – are all industry-agnostic metrics upon which all companies can improve, regardless of size. As organizations grapple with their journey toward becoming a truly stakeholder-driven company, being rewarded with cheaper financing for doing so makes following through on these commitments a win-win opportunity they shouldn’t pass up.
1: BloombergNEF defines their sustainable debt universe as “consisting of green bonds, green loans, social bonds, and sustainability bonds that follow the use-of-proceeds requirements set by the International Capital Market Association (ICMA) and Loan Market Association (LMA), as well as all sustainability-linked bonds and loans that follow the guidelines set by the ICMA and the LMA.”
If you are interested in supporting our mission, we are happy to discuss data needs, index licensing, and other ways we can partner. Please reach out to our Director of Business Development, Charlie Mahoney, at cmahoney@justcapital.com to discuss how we can create a more JUST economy together.